Sacramento, California, and Reno, Nevada, both offer unique lifestyle opportunities, economic climates, and cultural experiences. The differences in these two cities significantly influence the overall quality and standard of living in areas such as crime and safety, cost of living, education, and infrastructure, among others. This comparative analysis will provide insights to help decide which city may be a better fit based on your lifestyle preferences and needs.
Distance between
Sacramento, CA and
Reno, NV : 111.0 miles
Sacramento's population is larger by 95%. Its population has grown by 118,023 people (29.0%) since 2000. The population of Reno has grown by 88,371 people (49.0%) during that time.
Sacramento's overall crime rate is slightly higher than the US average but is significantly higher than in Reno, targeting primarily property crimes. However, both cities have developed strategies to battle crime and enhance safety. In Reno, the city's size allows for a more community-focused approach to policing, making it safer in terms of overall crime. It's important for both residents and tourists to remain alert and follow safety precautions for personal well-being.
City-data.com crime index counts serious crimes and violent crime more heavily. It adjusts for the number of visitors and daily workers commuting into cities. (higher means more crime, U.S. average = 301.1)
City-data.com crime index counts serious crimes and violent crime more heavily. It adjusts for the number of visitors and daily workers commuting into cities. (higher means more crime, U.S. average = 301.1)
Sex Offenders
According to our data, there are 2,168 registered sex offenders living in Sacramento and 1,264 registered sex offenders living in . The ratio of residents to sex offenders in Sacramento is 228 to 1; the ratio in Reno is 194 to 1. The number of registered sex offenders compared to the number of residents in Sacramento is near to than in Reno.
Cost of Living
The cost of living is a critical factor in determining where to live. Overall, Reno has a lower cost of living compared to Sacramento, particularly in housing costs. Medical care, utilities, and groceries are slightly higher in Sacramento, although differences in individual expenses may not be significant, depending on personal consumption habits.
Income Tax
Sacramento, being in California, has some of the highest state income tax rates in the nation. Reno, on the other hand, is in Nevada, which has no state income tax, making it more appealing for those with high incomes.
Property Tax
California's property tax rates are relatively low on a percentage basis, but high property values in Sacramento result in larger tax bills. In Reno, property tax rates are higher, but lower home values often result in lower overall property taxes.
Sales Tax
Both cities have different tax structures. California has a higher sales tax rate than Nevada, contributing to Sacramento's higher cost of living. Reno benefits from Nevada's lower sales tax and lack of state income tax, providing residents with a potentially lower overall tax burden.
Income
Type
Sacramento
Reno
Estimated median household income
$75,311
$67,478
Estimated per capita income
$37,916
$37,989
Cost of living index (U.S. average is 100)
102.9
99.5
If you make $50,000 in Reno, you will have to make $51,709 in Sacramento to maintain the same standard of living.
Geographical Conditions
Sacramento sits in California's Central Valley, near the Sacramento River, providing numerous outdoor recreational activities. In contrast, Reno is nestled in a high desert river valley at the foot of the Sierra Nevada mountains, offering different types of outdoor activities, making it a hub for nature lovers.
Sacramento is home to several universities and colleges, including the University of California, Sacramento State University, and more. Reno also offers quality education, with the University of Nevada, Reno, providing a variety of educational opportunities. Both cities place a high priority on educational advancement.
The economy of both cities is diverse. Sacramento's main sectors include government, education, healthcare, professional services, and IT, while Reno's economy is based primarily on gaming and entertainment, logistics, and emerging tech industries. Job growth has been strong in both cities.
Biggest Employers
In Sacramento, the state of California is the largest employer, followed by healthcare providers. In Reno, the biggest employers are the casinos, along with Tesla and other tech companies. Job prospects depend on the individual's industry and skill set.
There were 1,004 building permits issued in Sacramento in 2012 (943 more than in 2011) compared to 1,414 building permits issued in Reno in 2012 (1095 more than in 2011).
In Sacramento (Sacramento County), 58.1% voted for Democrats and 39.1% for Republicans in 2012 Presidential Election. In Reno (Washoe County), 50.8% voted for Democrats and 47.1% for Republicans.
Elections
Type
Democrats
Republicans
Other
Year
Sacramento
Reno
Sacramento
Reno
Sacramento
Reno
2020
61.4%
50.8%
36.1%
46.3%
2.5%
2.9%
2016
58.0%
46.4%
33.8%
45.1%
8.3%
8.5%
2012
58.1%
50.8%
39.1%
47.1%
2.8%
2.1%
2008
58.4%
55.2%
39.4%
42.6%
2.2%
2.1%
2004
49.8%
47.2%
49.6%
51.4%
0.6%
1.4%
2000
49.4%
42.7%
45.4%
52.1%
5.2%
5.3%
1996
49.8%
21.0%
40.8%
72.1%
9.4%
7.0%
Breakdown of population affiliated with a religious congregation
Type
Adherents
Congregations
Religion
Sacramento
Reno
Sacramento
Reno
CATHOLIC CHURCH
16.2%
14.4%
5.1%
6.1%
SOUTHERN BAPTIST CONVENTION
1.7%
1.1%
8.6%
12.2%
MUSLIM ESTIMATE
0.9%
0.1%
1.3%
0.5%
NORTH AMERICAN BAPTIST CONFERENCE
0.6%
0.0%
2.2%
0.0%
SEVENTH DAY ADVENTIST CHURCH
0.6%
0.4%
2.1%
1.9%
EVANGELICAL LUTHERAN CHURCH IN AMERICA
0.5%
0.3%
1.8%
1.9%
AMERICAN BAPTIST CHURCHES IN THE USA
0.4%
0.1%
1.7%
1.4%
EPISCOPAL CHURCH
0.3%
0.4%
1.4%
3.3%
LUTHERAN CHURCH
0.2%
0.4%
1.1%
0.9%
Weather
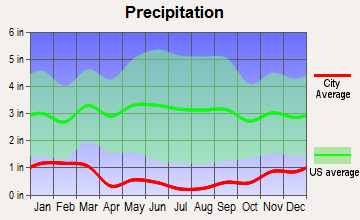
Weather between these two cities differs substantially. Sacramento generally has a Mediterranean climate with mild winters and hot, dry summers, whereas Reno experiences a semi-arid climate, characterized by cold winters and hot summers. If you enjoy more rainfall, Sacramento could be the city for you, while Reno is suited for those who prefer a drier climate.
Weather and climate
Type
Sacramento
Reno
Temperature - Average
62.2°F
51.1°F
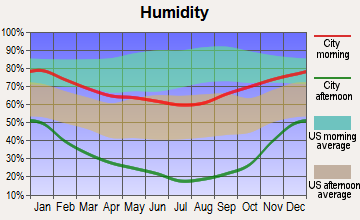
Humidity - Average morning or afternoon humidity
66.8%
51.3%
Humidity - Differences between morning and afternoon humidity
58%
57%
Humidity - Maximum monthly morning or afternoon humidity
87%
75%
Humidity - Minimum monthly morning or afternoon humidity
29%
18%
Precipitation - Yearly average
19 in
8.1 in
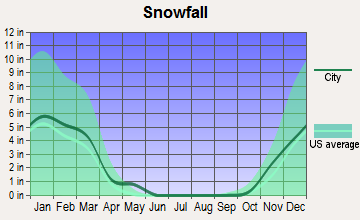
Snowfall - Yearly average
0 in
45 in
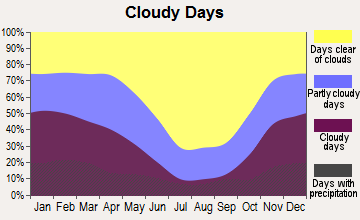
Clouds - Number of days clear of clouds
31.5%
26.3%
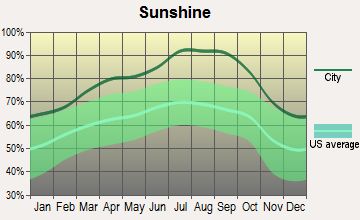
Sunshine amount - Average
83.6%
88.3%
Sunshine amount - Differences during a year
52%
30%
Sunshine amount - Maximum monthly
97%
95%
Sunshine amount - Minimum monthly
45%
65%
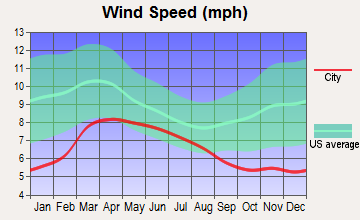
Wind speed - Average
6.8 mph
6.9 mph
Average climate in Sacramento, California
Average climate in Reno, Nevada
Air pollution
Type
AQI
CO
NO2
OZONE
PB
PM10
PM25
SO2
Year
Sacramento
Reno
Sacramento
Reno
Sacramento
Reno
Sacramento
Reno
Sacramento
Sacramento
Reno
Sacramento
Reno
Sacramento
Reno
2018
121
80
0.32
0.22
9.7
12.8
24.7
31.6
0.002
N/A
28.9
20.3
12.7
8.2
N/A
0.2
2017
117
87
0.33
0.22
9.0
12.9
25.2
31.7
0.002
N/A
22.1
19.0
8.8
7.5
N/A
0.3
2016
103
77
0.44
0.20
8.0
12.7
25.3
31.9
0.002
N/A
14.0
17.8
9.0
6.7
N/A
0.2
2015
105
90
0.25
0.21
9.7
14.1
24.9
30.8
0.002
N/A
16.2
18.5
10.9
7.8
N/A
0.4
2014
99
130
0.24
0.22
10.2
13.7
24.9
31.7
0.002
N/A
15.6
21.8
9.6
7.8
N/A
0.4
2013
102
166
0.29
0.27
11.1
16.0
23.2
29.4
0.002
N/A
21.3
27.0
11.9
10.8
N/A
0.5
2012
107
121
0.31
0.27
10.5
14.1
25.2
32.7
0.002
N/A
15.2
18.1
7.9
6.2
N/A
0.4
2011
106
76
0.29
0.27
11.2
16.7
24.0
29.5
0.002
N/A
17.7
N/A
10.8
6.8
N/A
0.5
2010
109
73
0.29
0.23
11.2
16.3
22.8
31.4
N/A
N/A
16.9
N/A
9.3
N/A
0.5
N/A
2009
118
68
0.40
0.32
12.4
17.4
23.3
28.5
0.003
N/A
20.6
N/A
11.4
N/A
0.5
N/A
2008
130
81
0.40
0.27
14.9
17.9
25.4
28.3
N/A
N/A
24.3
N/A
13.6
N/A
0.5
N/A
2007
129
85
0.39
0.34
14.8
18.9
23.7
28.0
0.005
N/A
19.9
N/A
13.5
11.2
0.6
N/A
2006
124
88
0.49
0.38
15.4
19.3
22.7
29.0
N/A
N/A
23.7
29.3
13.0
N/A
0.5
N/A
2005
125
76
0.42
0.45
15.9
18.0
20.0
27.2
N/A
N/A
22.1
30.1
13.5
N/A
0.6
N/A
2004
119
76
0.49
0.38
15.8
N/A
19.1
27.2
N/A
N/A
22.7
33.1
13.3
N/A
0.6
N/A
2003
119
69
0.47
0.44
16.8
N/A
20.3
27.5
N/A
N/A
23.1
19.9
N/A
N/A
0.9
N/A
2002
114
77
0.50
0.53
18.1
N/A
21.2
27.1
0.004
N/A
25.1
N/A
N/A
N/A
1.5
N/A
2001
111
68
0.43
0.77
18.0
7.4
21.2
25.5
0.004
N/A
20.7
16.9
N/A
N/A
1.4
N/A
2000
107
66
0.55
0.75
17.9
7.9
19.5
24.1
0.004
N/A
19.1
N/A
N/A
N/A
1.4
N/A
Natural disasters
Type
Sacramento
Reno
Tornado activity compared to U.S. average
8.8%
2.4%
Earthquake activity compared to U.S. average
7,798.9%
6,879.2%
Natural disasters compared to U.S. average
18%
28%
Transportation
Public transit in Sacramento is extensive and efficient, with the Sacramento Regional Transit District providing bus and light rail services. In contrast, Reno's transportation system is growing but currently less developed. Commute times in Sacramento can be lengthier due to traffic congestion.
Transport
Type
Sacramento
Reno
Amtrak stations
1
1
Amtrak stations nearby
3
2
FAA registered aircraft
414
758
FAA registered aircraft manufacturers and dealers
20
16
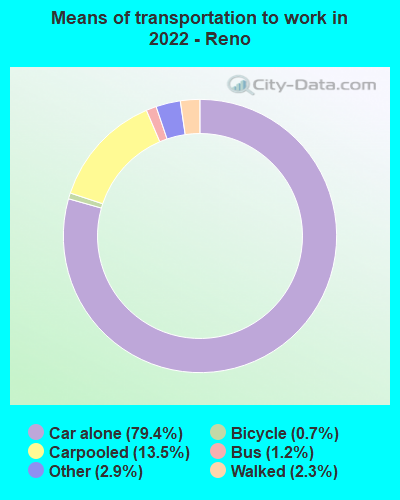
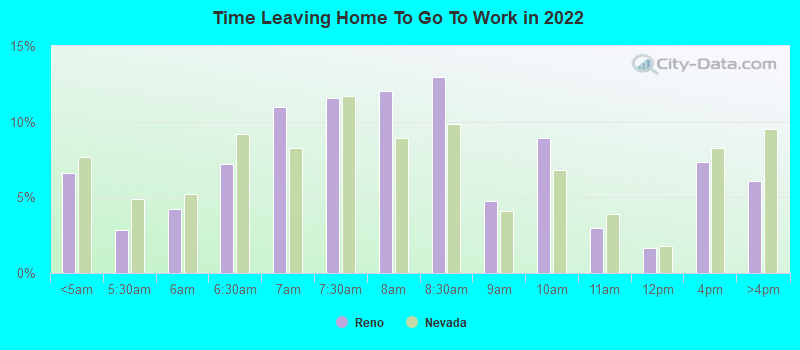
Means of transportation to work
Type
Sacramento
Reno
Bicycle
1.1%
0.1%
Bus
1%
1.8%
Carpooled
12%
10.2%
Car alone
80%
81.6%
Motorcycle
0.2%
0.2%
Railroad
0.4%
0%
Taxicab
0.1%
0.2%
Walked
2.8%
1.7%
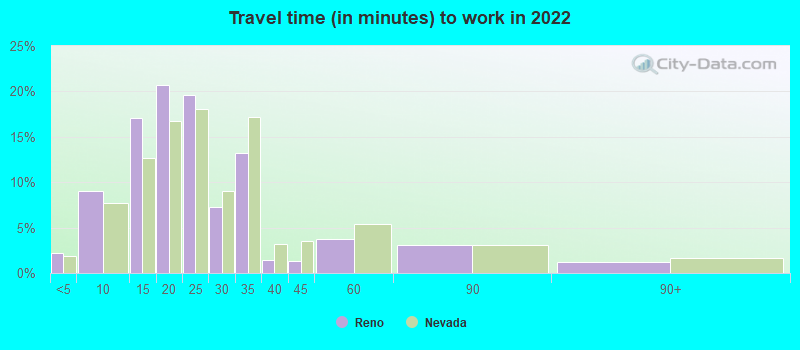
Average travel time to work
Type
Sacramento
Reno
Average
28.5 min
24.2 min
Other means
22.8 min
18.6 min
Public transportation
39 min
36.8 min
Private vehicle occupancy
Type
Sacramento
Reno
Average
1.2
1.2
Drove alone
88.5%
87.1%
In 2 person carpool
9.4%
10.2%
In 3 person carpool
1.2%
1.6%
In 4 person carpool
0.4%
0.6%
In 5-6 person carpool
0.5%
0.3%
In 7+ person carpool
0%
0.2%
How many people usually rode to work in the car, truck or van.
Real Estate
In the real estate market, Sacramento's higher demand and prices reflect its larger population and status as a state capital. Reno's real estate is more affordable, but rising demand could potentially increase prices in the coming years.
Neighborhoods
In both cities, neighborhoods are diverse and appeal to various lifestyles and budgets. Midtown Sacramento is known for its vitality and culture, while Northwest Reno boasts top-rated schools and fantastic views.
Houses and residents
Type
Sacramento
Reno
Houses
210,715
116,918
Average household size (people)
2.6
2.4
Median year apartment built
1977
1984
Median year house/condo built
1978
1993
Length of stay in the house since moving in
12.8 years
10.5 years
Houses occupied
202,093 (95.9%)
110,993 (94.9%)
Houses occupied by owners
103,994 (51.5%)
54,158 (48.8%)
Houses occupied by renters
98,099 (48.5%)
56,835 (51.2%)
Median rent asked for vacant for-rent units
$976.09
$1,306
Median monthly housing costs
$1,558
$1,307
Median price asked for vacant for-sale houses and condos
$398,191
$797,037
Estimated median house or condo value
$449,600
$469,100
Median numbers of rooms
5
5
Median number of rooms in apartments
4.1
3.9
Median number of rooms in houses and condos
5.8
6.2
Median house price - detached houses
$496,462
$560,745
Median house price - in 2-unit structures
$630,561
Over $1,000,000
Median house price - in 3-to-4-unit structures
$205,310
$273,291
Median house price - in 5 or more unit structures
$382,635
$239,159
Median house price - mobile homes
$104,325
$115,836
Median house price - Townhouses or other attached units
$463,571
$364,237
Median house price - All housing units
$481,210
$513,401
Median house age
44
33
Renting percentage
50.6%
52%
Housing density (houses/condos per square mile)
2,168.8
1,691.7
House value disparities
25.5%
27.4%
Household income disparities
44%
44.4%
Median household income for houses/condes with a mortgage
$109,432
$114,336
Median household income for apartments without a mortgage
$82,443
$64,370
Housing units without a mortgage
1,166 (1.6%)
616 (1.7%)
Housing units with both a second mortgage and home equity loan
4,385 (6.1%)
1,679 (4.6%)
Housing units with a mortgage
70,415 (98.4%)
35,814 (98.3%)
Housing units with a home equity loan
204 (0.3%)
129 (0.4%)
Housing units with a second mortgage
5,362 (7.5%)
1,980 (5.4%)
House/condo owner moved in on average (years ago)
10
7
House/condo renter moved in on average (years ago)
3
1
Housing units lacking complete kitchen facilities
1.2%
3.7%
Housing units lacking complete plumbing facilities
0.3%
2.3%
Housing units in structures
Housing units in structures
Sacramento
Reno
One, detached
61.7%
51.5%
One, attached
6.8%
5.7%
Two
1.8%
1.1%
3 or 4
4.8%
5.0%
5 to 9
6.9%
9.7%
10 to 19
4.9%
9.2%
20 to 49
3.5%
5.7%
50 or more
7.6%
8.1%
Mobile homes
1.9%
3.7%
Boats, RVs, vans, etc.
0.0%
0.3%
Median real estate property taxes paid for housing units
Self-employed workers in own not incorporated business
12,891
5,944
State government workers
40,274
7,119
Unpaid family workers
755
127
Industries and Occupations
Sacramento's major industries include government, healthcare, and professional services, while Reno's key industries are gaming and entertainment, tech, and warehousing. Both cities offer a range of occupations, but opportunities may differ based on these dominant industries.
Sacramento is home to some of California's finest healthcare facilities, including UC Davis Medical Center. Reno also has high-quality healthcare facilities, with Renown Health and Saint Mary's Regional Medical Center as major providers.
Health (county statistics)
Type
Sacramento
Reno
General health status score of residents in this county from 1 (poor) to 5 (excellent)
Sacramento's infrastructure benefits from its status as California's capital, with well-maintained highways, bridges, and public buildings. In comparison, Reno's infrastructure is improving, but its growth has exerted pressure on roadways and public utilities.
Infrastructure
Type
Sacramento
Reno
Hospitals
17
11
TV stations
23
15
Arenas or stadiums
1
2
Bank branches located here
127
60
Bank institutions located here
31
11
Main business address for public companies
5
12
Drinking water stations with no reported violations in the past
26
20
Drinking water stations with reported violations in the past
HMDA - Conventional home purchase loans - Applications denied
Year
Sacramento
Reno
1999
1,003
668
2000
1,155
565
2001
983
362
2002
1,197
305
2003
2,258
478
2004
3,872
725
2005
4,610
944
2006
4,276
1,006
2007
2,386
572
2008
1,381
220
2009
647
123
Culture and Food
Sacramento, known as America's Farm-to-Fork Capital, offers a vibrant food scene with an emphasis on locally grown produce. The city also has a rich cultural history, with many museums, festivals, and performing arts venues. Reno also has a diverse food scene with a vibrant arts district, and its proximity to Lake Tahoe offers a wide range of outdoor activities.
Sports Teams
Sacramento is home to the NBA’s Sacramento Kings and a host of minor league teams, offering sports fans numerous opportunities for live games. Reno, on the other hand, has minor league baseball, basketball, and soccer teams, providing a smaller but still vibrant sports community.


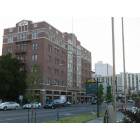
 Sacramento, CA
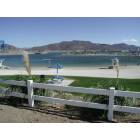
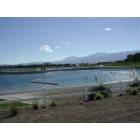
 Reno, NV