San Antonio and Arlington are both vibrant Texas cities with diverse landscapes, strong economies, and rich cultural heritages. San Antonio is known for its historical landmarks and lively downtown, while Arlington is regarded for its sports and recreational facilities. Whether you're considering relocation or a visit, understanding their differences and similarities regarding safety, cost of living, education, and other key aspects can help you make a more informed decision.
Distance between
San Antonio, TX and
Arlington, TX : 239.3 miles
San Antonio's population is larger by 270%. Its population has grown by 307,207 people (26.8%) since 2000. The population of Arlington has grown by 59,817 people (18.0%) during that time.
According to community crime rate data, both San Antonio and Arlington have crime rates higher than the national average. However, it's important to clarify that crime greatly varies depending on neighborhoods within each city. While both cities are making efforts to improve safety, you should research the specific areas you're considering for an accurate understanding of safety levels.
City-data.com crime index counts serious crimes and violent crime more heavily. It adjusts for the number of visitors and daily workers commuting into cities. (higher means more crime, U.S. average = 301.1)
City-data.com crime index counts serious crimes and violent crime more heavily. It adjusts for the number of visitors and daily workers commuting into cities. (higher means more crime, U.S. average = 301.1)
Sex Offenders
According to our data, there are 3,771 registered sex offenders living in San Antonio and 594 registered sex offenders living in . The ratio of residents to sex offenders in San Antonio is 396 to 1; the ratio in Arlington is 661 to 1. The number of registered sex offenders compared to the number of residents is larger in San Antonio than in Arlington.
Cost of Living
Based on the cost of living index, San Antonio is generally more affordable than Arlington. Factors such as housing, food, and utilities tend to be lower in San Antonio. However, both cities are significantly cheaper than the US average, making either a good choice for budget-conscious individuals or families.
Income Tax
Texas is one of the few states that does not impose a state income tax, so this aspect doesn't differentiate San Antonio and Arlington. This is considered a significant financial advantage for residents of both cities, particularly for high earners.
Property Tax
Property taxes are based on county rates in Texas. Bexar County, where San Antonio is located, has a lower average property tax rate than Tarrant County, where Arlington is located. However, the rates within each county can vary depending on the specific location and school district.
Sales Tax
Texas as a state charges a 6.25% sales tax, but local tax rates can add to this. Arlington has a 2% city sales tax, resulting in a total sales tax rate of 8.25%, which equals the rate in San Antonio.
Income
Type
San Antonio
Arlington
Estimated median household income
$54,923
$59,889
Estimated per capita income
$28,860
$31,722
Cost of living index (U.S. average is 100)
87.7
95.9
If you make $50,000 in San Antonio, you will have to make $54,675 in Arlington to maintain the same standard of living.
Geographical Conditions
San Antonio sits at the edge of the Texas Hill Country, which provides beautiful landscapes, rolling hills, and the headwaters of several rivers. Arlington, on the other hand, sits in the flat Texas Prairie, which, while lacking San Antonio's elevation changes, provides its own scenic beauty, particularly in its parkland and water bodies.
Both cities boast numerous educational opportunities. San Antonio, being larger, has more school districts and colleges, including the University of Texas at San Antonio. Arlington, on the other hand, is home to the University of Texas at Arlington. According to school quality information, Arlington has a slight edge over San Antonio in terms of school performance.
Both cities have robust economies with plenty of job opportunities, particularly in sectors such as healthcare, education, and government. However, San Antonio's economy is larger and more diversified, with a larger presence in the military, financial services, and tourism sectors. In contrast, Arlington's economy relies more heavily on entertainment and professional sports.
Biggest Employers
The largest employer in San Antonio is the military, particularly the Lackland Air Force Base and Fort Sam Houston. On the other hand, Arlington’s largest employers are the Arlington Independent School District and the General Motors Assembly Plant. Both cities also have a significant presence of healthcare providers among their top employers.
There were 6,567 building permits issued in San Antonio in 2012 (4973 more than in 2011) compared to 976 building permits issued in Arlington in 2012 (744 more than in 2011).
In San Antonio (Bexar County), 51.6% voted for Democrats and 47.1% for Republicans in 2012 Presidential Election. In Arlington (Tarrant County), 41.4% voted for Democrats and 57.1% for Republicans.
Elections
Type
Democrats
Republicans
Other
Year
San Antonio
Arlington
San Antonio
Arlington
San Antonio
Arlington
2020
58.3%
49.3%
40.1%
49.1%
1.5%
1.6%
2016
54.2%
43.2%
40.8%
51.8%
5.0%
5.0%
2012
51.6%
41.4%
47.1%
57.1%
1.4%
1.4%
2008
52.3%
43.8%
46.7%
55.5%
1.0%
0.7%
2004
44.5%
37.0%
55.0%
62.5%
0.6%
0.5%
2000
44.9%
36.9%
52.3%
60.9%
2.7%
2.3%
1996
49.7%
41.6%
44.6%
50.9%
5.7%
7.5%
Breakdown of population affiliated with a religious congregation
Type
Adherents
Congregations
Religion
San Antonio
Arlington
San Antonio
Arlington
CATHOLIC CHURCH
30.8%
11.1%
8.6%
1.9%
SOUTHERN BAPTIST CONVENTION
6.8%
17.3%
23.5%
33.3%
MUSLIM ESTIMATE
1.2%
2.2%
0.8%
0.9%
LUTHERAN CHURCH
0.7%
0.5%
1.0%
0.9%
EPISCOPAL CHURCH
0.6%
0.3%
1.6%
0.8%
EVANGELICAL LUTHERAN CHURCH IN AMERICA
0.6%
0.3%
2.2%
0.9%
SEVENTH DAY ADVENTIST CHURCH
0.2%
0.4%
1.3%
1.6%
Weather
Texas overall has a hot and humid climate, but there are subtle differences between both cities. San Antonio, located further south and inland, typically has hotter summers and milder winters than Arlington. However, the chances of experiencing extreme weather events like tornadoes are lesser in San Antonio than in Arlington.
Weather and climate
Type
San Antonio
Arlington
Temperature - Average
68.7°F
65°F
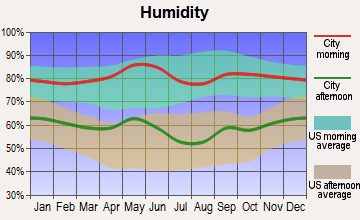
Humidity - Average morning or afternoon humidity
74.9%
71.4%
Humidity - Differences between morning and afternoon humidity
37%
34%
Humidity - Maximum monthly morning or afternoon humidity
87%
82%
Humidity - Minimum monthly morning or afternoon humidity
50%
48%
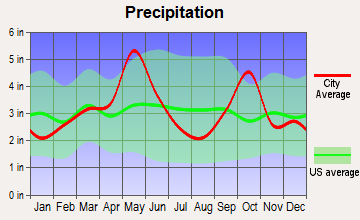
Precipitation - Yearly average
32.2 in
37.9 in
Snowfall - Yearly average
1.2 in
4.2 in
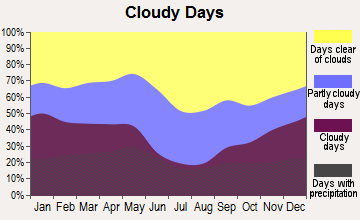
Clouds - Number of days clear of clouds
17.5%
22.7%
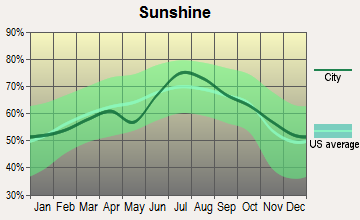
Sunshine amount - Average
62.4%
66.6%
Sunshine amount - Differences during a year
24%
20%
Sunshine amount - Maximum monthly
72%
74%
Sunshine amount - Minimum monthly
48%
54%
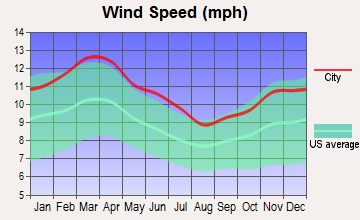
Wind speed - Average
8.9 mph
10.3 mph
Average climate in San Antonio, Texas
Average climate in Arlington, Texas
Air pollution
Type
AQI
CO
NO2
OZONE
PM10
PM25
SO2
Year
San Antonio
Arlington
San Antonio
Arlington
San Antonio
Arlington
San Antonio
Arlington
San Antonio
San Antonio
Arlington
San Antonio
Arlington
2018
83
86
N/A
N/A
4.9
5.8
25.6
27.1
N/A
N/A
8.0
9.4
0.2
0.4
2017
85
86
N/A
N/A
5.1
6.2
26.9
27.2
N/A
N/A
8.4
9.1
1.7
0.3
2016
79
76
N/A
N/A
5.2
6.3
25.7
25.5
N/A
N/A
8.2
8.2
0.8
0.2
2015
76
80
N/A
N/A
4.7
6.5
25.4
24.8
N/A
N/A
9.2
8.6
0.7
0.3
2014
84
78
N/A
0.22
5.5
6.8
27.3
26.6
N/A
N/A
9.5
9.3
0.6
0.3
2013
79
96
N/A
0.25
4.1
6.4
28.2
27.2
N/A
N/A
9.0
11.0
0.7
0.2
2012
77
108
N/A
0.26
4.5
7.8
27.5
30.3
18.1
N/A
9.2
10.5
N/A
0.3
2011
85
96
N/A
0.23
4.6
8.2
29.2
30.7
18.9
N/A
9.9
9.5
N/A
0.6
2010
75
76
0.21
0.23
7.2
8.9
25.8
27.7
17.1
N/A
9.2
8.4
N/A
0.7
2009
74
91
0.23
0.25
8.3
8.7
25.7
29.5
19.5
N/A
9.8
8.5
0.4
0.5
2008
84
92
0.26
0.25
9.3
9.6
26.8
25.8
19.8
N/A
10.1
10.7
0.5
0.5
2007
83
95
0.49
0.30
9.3
10.6
26.3
24.6
23.4
N/A
10.3
9.8
N/A
0.5
2006
86
102
0.51
0.34
9.7
10.4
32.7
29.7
24.8
N/A
9.8
9.9
N/A
0.8
2005
86
110
0.53
0.34
10.7
11.7
30.8
28.4
22.3
N/A
10.1
11.3
N/A
1.0
2004
76
90
0.48
0.39
10.4
10.8
29.6
25.4
22.4
N/A
N/A
N/A
N/A
0.9
2003
77
97
0.57
0.40
10.3
11.1
28.5
27.2
26.7
N/A
N/A
N/A
N/A
1.0
2002
88
97
0.52
0.37
11.2
11.8
30.3
25.8
N/A
N/A
N/A
N/A
N/A
0.6
2001
78
88
0.57
0.48
11.9
14.7
29.3
25.0
N/A
N/A
N/A
N/A
N/A
1.1
2000
82
104
0.52
0.55
11.7
14.5
29.6
26.2
N/A
N/A
N/A
N/A
N/A
1.3
Natural disasters
Type
San Antonio
Arlington
Tornado activity compared to U.S. average
91.5%
254.3%
Earthquake activity compared to U.S. average
73.7%
558.3%
Natural disasters compared to U.S. average
21%
23%
Transportation
While both cities have public transportation options, such as buses and rideshares, San Antonio's system, VIA Metropolitan Transit, is more extensive than Arlington's Via Rideshare. However, both cities are car-dependent and most residents opt for personal vehicle use.
Transport
Type
San Antonio
Arlington
Amtrak stations
1
0
Amtrak stations nearby
1
2
FAA registered aircraft
987
362
FAA registered aircraft manufacturers and dealers
29
5
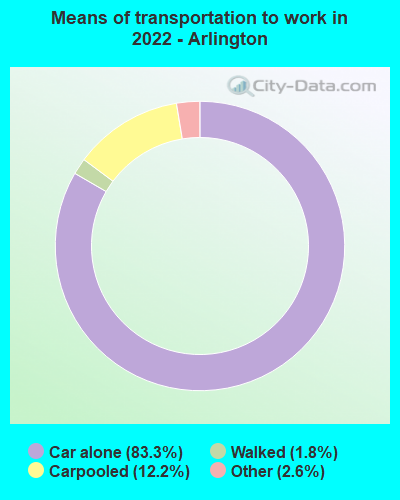
Means of transportation to work
Type
San Antonio
Arlington
Bicycle
0.2%
0.2%
Bus
1.6%
0%
Carpooled
12.9%
11.9%
Car alone
81.9%
85%
Motorcycle
0.1%
0.1%
Walked
1.6%
1.4%
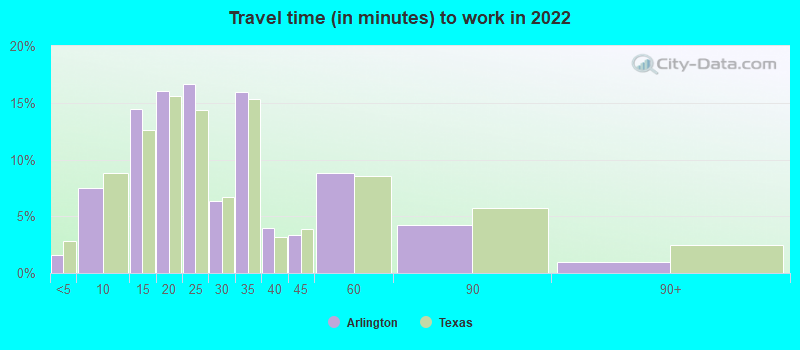
Average travel time to work
Type
San Antonio
Arlington
Average
27 min
26.1 min
Other means
23.4 min
27.6 min
Public transportation
43.5 min
45.1 min
Private vehicle occupancy
Type
San Antonio
Arlington
Average
1.2
1.2
Drove alone
84.6%
88.7%
In 2 person carpool
10.4%
7.8%
In 3 person carpool
3.3%
2.2%
In 4 person carpool
1%
0.8%
In 5-6 person carpool
0.6%
0.4%
How many people usually rode to work in the car, truck or van.
Real Estate
San Antonio's real estate is generally more affordable than Arlington's, with a broader range of housing options. While you can find a mix of apartments, condos, and houses in both cities, San Antonio offers a more balanced real estate market, making homeownership easier to attain for many residents.
Neighborhoods
San Antonio offers a wide variety of neighborhoods, from historic areas like King William to hip regions like Alamo Heights. Arlington's neighborhoods offer a more suburban vibe, with areas like North Arlington being popular for their convenient location and wealth of amenities.
Houses and residents
Type
San Antonio
Arlington
Houses
603,670
156,653
Average household size (people)
2.7
2.7
Median year apartment built
1987
1983
Median year house/condo built
1981
1984
Length of stay in the house since moving in
14.3 years
13 years
Houses occupied
549,245 (91%)
146,888 (93.8%)
Houses occupied by owners
290,123 (52.8%)
78,883 (53.7%)
Houses occupied by renters
259,122 (47.2%)
68,005 (46.3%)
Median rent asked for vacant for-rent units
$1,143
$1,609
Median monthly housing costs
$1,101
$1,220
Median price asked for vacant for-sale houses and condos
$189,213
$199,415
Estimated median house or condo value
$197,600
$254,700
Median numbers of rooms
5.1
5.4
Median number of rooms in apartments
4
4.1
Median number of rooms in houses and condos
6.2
6.5
Median house price - detached houses
$238,319
$265,594
Median house price - in 2-unit structures
$407,491
$415,006
Median house price - in 3-to-4-unit structures
$120,363
$224,044
Median house price - in 5 or more unit structures
$163,867
$131,545
Median house price - mobile homes
$105,850
$92,300
Median house price - occupied boats, rvs, vans etc.
$20,297
$23,762
Median house price - Townhouses or other attached units
$188,542
$171,140
Median house price - All housing units
$234,615
$259,527
Median house age
37
37
Renting percentage
43.5%
42.6%
Housing density (houses/condos per square mile)
1,481.2
1,634.9
House value disparities
33.6%
25%
Household income disparities
44.7%
43.9%
Median household income for houses/condes with a mortgage
$87,382
$97,883
Median household income for apartments without a mortgage
$60,785
$67,452
Housing units without a mortgage
5,815 (3.5%)
948 (2%)
Housing units with both a second mortgage and home equity loan
6,350 (3.8%)
1,684 (3.6%)
Housing units with a mortgage
160,674 (96.5%)
46,456 (98%)
Housing units with a home equity loan
129 (0.1%)
0 (0%)
Housing units with a second mortgage
7,761 (4.7%)
1,967 (4.1%)
House/condo owner moved in on average (years ago)
13
13
House/condo renter moved in on average (years ago)
1
1
Housing units lacking complete kitchen facilities
2.1%
1.7%
Housing units lacking complete plumbing facilities
1.3%
1%
Housing units in structures
Housing units in structures
San Antonio
Arlington
One, detached
60.4%
60.2%
One, attached
2.7%
10.8%
Two
2.2%
1.5%
3 or 4
4.9%
4.3%
5 to 9
7.8%
5.7%
10 to 19
8.5%
7.7%
20 to 49
5.4%
3.3%
50 or more
6.6%
5.2%
Mobile homes
1.5%
1.3%
Boats, RVs, vans, etc.
0.0%
0.1%
Median real estate property taxes paid for housing units
Self-employed workers in own not incorporated business
46,328
10,953
State government workers
29,486
6,771
Unpaid family workers
657
396
Industries and Occupations
San Antonio supports a broad range of industries, from healthcare and biosciences to cybersecurity and aerospace. Arlington's economic offerings are more niche, with entertainment, tourism, and manufacturing sectors leading the city's economy. Both cities offer ample employment opportunities for both high-skilled and low-skilled workers.
Both cities have strong healthcare sectors with high-quality facilities. San Antonio’s healthcare system is strengthened by its military health facilities and a large network of civilian hospitals. Meanwhile, Arlington benefits from its central location between Dallas and Fort Worth, with access to both cities' prestigious healthcare systems.
Health (county statistics)
Type
San Antonio
Arlington
General health status score of residents in this county from 1 (poor) to 5 (excellent)
San Antonio, being one of the oldest cities in Texas, has a more historical city structure, with infrastructure connecting the city to its past. In contrast, Arlington is more modern and suburban, with new developments often taking the place of older ones. Both cities are investing in their infrastructure to accommodate growth and improve their economic competitiveness.
Infrastructure
Type
San Antonio
Arlington
Hospitals
130
39
TV stations
30
25
Arenas or stadiums
2
1
Bank branches located here
333
74
Bank institutions located here
41
23
Main business address for public companies
23
2
Drinking water stations with no reported violations in the past
7
0
Drinking water stations with reported violations in the past
HMDA - Conventional home purchase loans - Applications denied
Year
San Antonio
Arlington
1999
6,847
1,768
2000
2,930
1,198
2001
2,383
1,140
2002
2,313
847
2003
3,759
1,216
2004
5,180
1,504
2005
6,554
2,158
2006
6,983
2,107
2007
4,562
1,390
2008
1,781
558
2009
847
235
Culture and Food
San Antonio's mix of Mexican and Texan cultures creates a vibrant food scene highlighted by Tex-Mex cuisine. The city is also popular for its river walk and historic sites like The Alamo. Arlington, while not as culturally distinct as San Antonio, offers strong recreational opportunities, including the Six Flags Over Texas theme park and Lake Arlington.
Sports Teams
Arlington is home to the Texas Rangers and Dallas Cowboys, making it a premier destination for professional sports lovers. While San Antonio doesn't have an NFL or MLB team, it does host the NBA's San Antonio Spurs and is passionate about its college basketball, hosting the Annual NCAA Men's Final Four tournament regularly.


 San Antonio, TX
 Arlington, TX