San Antonio, Texas and Bakersfield, California each offer unique attributes to their residents and visitors. From their contrasting climates to distinct local cultures, characterizing each of these popular American cities. While both cities have much to offer in terms of lifestyle, amenities, and economic opportunities, it's crucial to analyze their unique aspects to get a full understanding. This insightful comparison will highlight the key factors that may influence your decision should you wish to relocate or simply visit.
Distance between
San Antonio, TX and
Bakersfield, CA : 1,261.7 miles
San Antonio's population is larger by 256%. Its population has grown by 307,207 people (26.8%) since 2000. The population of Bakersfield has grown by 160,558 people (65.0%) during that time.
Comparatively, San Antonio has a higher crime rate than Bakersfield. Violent crimes are generally higher in San Antonio, which is something to consider. Additionally, the property crime rate in San Antonio also exceeds that of Bakersfield. Both cities have been making efforts to improve their safety levels, implementing various crime prevention programs.
City-data.com crime index counts serious crimes and violent crime more heavily. It adjusts for the number of visitors and daily workers commuting into cities. (higher means more crime, U.S. average = 301.1)
City-data.com crime index counts serious crimes and violent crime more heavily. It adjusts for the number of visitors and daily workers commuting into cities. (higher means more crime, U.S. average = 301.1)
Sex Offenders
According to our data, there are 3,771 registered sex offenders living in San Antonio and 1,108 registered sex offenders living in . The ratio of residents to sex offenders in San Antonio is 396 to 1; the ratio in Bakersfield is 340 to 1. The number of registered sex offenders compared to the number of residents in San Antonio is near to than in Bakersfield.
Cost of Living
Bakersfield has a higher cost of living compared to San Antonio. Housing is more affordable in San Antonio, and grocery expenses, health care, and utilities are also generally cheaper. However, the income levels in Bakersfield are typically higher, somewhat offsetting the cost of living difference.
Income Tax
One significant advantage San Antonio holds over Bakersfield is that Texas has no state income tax, whereas California does, with rates ranging from 1% to 13.3%.
Property Tax
Property taxes in San Antonio are higher than in Bakersfield. However, California has property tax rates that are among the highest in the country, which may offset this difference.
Sales Tax
Sales tax in San Antonio, Texas, is 8.25%, while Bakersfield, California, has a rate of 7.25%. However, parts of Bakersfield do have additional district taxes that can increase the overall rate.
Income
Type
San Antonio
Bakersfield
Estimated median household income
$54,923
$66,666
Estimated per capita income
$28,860
$29,363
Cost of living index (U.S. average is 100)
87.7
92.6
If you make $50,000 in San Antonio, you will have to make $52,794 in Bakersfield to maintain the same standard of living.
Geographical Conditions
San Antonio lies on the Balcones Escarpment and has several hills and valleys. Bakersfield is within the San Joaquin Valley and close to the southern end of the Sierra Nevada.
San Antonio is the home of numerous renowned colleges and universities such as the University of Texas at San Antonio. Bakersfield also has notable higher education institutions, including California State University, Bakersfield. The school district in Bakersfield is larger and more diverse, whereas San Antonio's is more fragmented with a larger proportion of charter schools.
San Antonio's economy is strongly based on military, health care, government services, financial services, oil and gas, and tourism. Bakersfield's economy largely revolves around agriculture, oil production, and manufacturing. Unemployment rates tend to be lower in San Antonio while average incomes are higher in Bakersfield.
Biggest Employers
In San Antonio, major employers include the military, USAA, HEB, and numerous hospitals. In Bakersfield, major employers include Grimmway Farms, Kern Schools Federal Credit Union, and the County of Kern.
There were 6,567 building permits issued in San Antonio in 2012 (4973 more than in 2011) compared to 1,121 building permits issued in Bakersfield in 2012 (699 more than in 2011).
In San Antonio (Bexar County), 51.6% voted for Democrats and 47.1% for Republicans in 2012 Presidential Election. In Bakersfield (Kern County), 40.3% voted for Democrats and 57.0% for Republicans.
Elections
Type
Democrats
Republicans
Other
Year
San Antonio
Bakersfield
San Antonio
Bakersfield
San Antonio
Bakersfield
2020
58.3%
43.7%
40.1%
53.9%
1.5%
2.4%
2016
54.2%
40.4%
40.8%
53.1%
5.0%
6.5%
2012
51.6%
40.3%
47.1%
57.0%
1.4%
2.7%
2008
52.3%
40.1%
46.7%
57.9%
1.0%
1.9%
2004
44.5%
32.7%
55.0%
67.0%
0.6%
0.3%
2000
44.9%
36.3%
52.3%
60.8%
2.7%
2.9%
1996
49.7%
36.6%
44.6%
53.8%
5.7%
9.7%
Breakdown of population affiliated with a religious congregation
Type
Adherents
Congregations
Religion
San Antonio
Bakersfield
San Antonio
Bakersfield
CATHOLIC CHURCH
30.8%
29.3%
8.6%
4.9%
SOUTHERN BAPTIST CONVENTION
6.8%
3.2%
23.5%
12.0%
MUSLIM ESTIMATE
1.2%
0.5%
0.8%
0.7%
LUTHERAN CHURCH
0.7%
0.4%
1.0%
2.0%
EPISCOPAL CHURCH
0.6%
0.0%
1.6%
0.7%
EVANGELICAL LUTHERAN CHURCH IN AMERICA
0.6%
0.0%
2.2%
0.3%
SEVENTH DAY ADVENTIST CHURCH
0.2%
0.6%
1.3%
2.9%
Weather
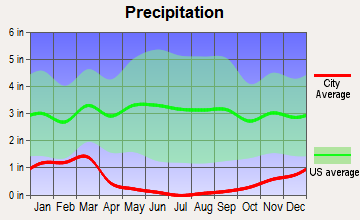
Bakersfield, situated in California, enjoys a Mediterranean climate characterized by hot, dry summers and mild, wet winters. San Antonio, being in southern Texas, experiences a humid subtropical climate, with sweltering summers and mild to cool winters. Bakersfield's air quality has been a concern due to pollution, while San Antonio’s air quality is comparatively better.
Weather and climate
Type
San Antonio
Bakersfield
Temperature - Average
68.7°F
64.9°F
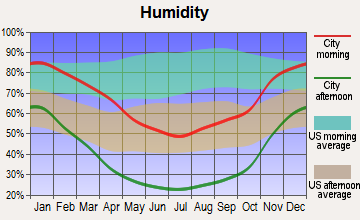
Humidity - Average morning or afternoon humidity
74.9%
53.5%
Humidity - Differences between morning and afternoon humidity
37%
59%
Humidity - Maximum monthly morning or afternoon humidity
87%
80%
Humidity - Minimum monthly morning or afternoon humidity
50%
21%
Precipitation - Yearly average
32.2 in
6.5 in
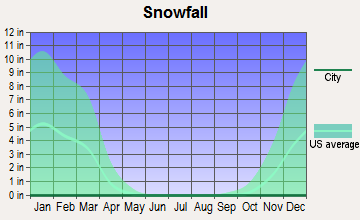
Snowfall - Yearly average
1.2 in
0 in
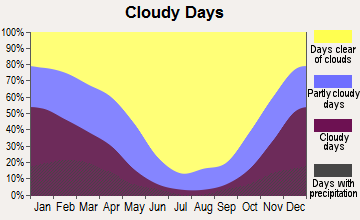
Clouds - Number of days clear of clouds
17.5%
31.8%
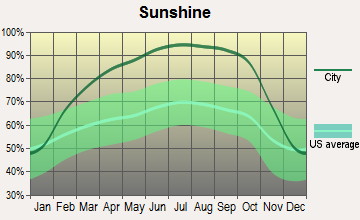
Sunshine amount - Average
62.4%
80.8%
Sunshine amount - Differences during a year
24%
31.1%
Sunshine amount - Maximum monthly
72%
89.5%
Sunshine amount - Minimum monthly
48%
58.4%
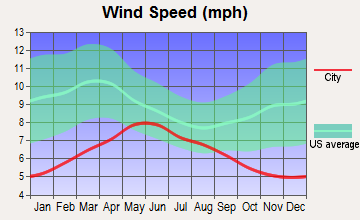
Wind speed - Average
8.9 mph
6.8 mph
Average climate in San Antonio, Texas
Average climate in Bakersfield, California
Air pollution
Type
AQI
CO
NO2
OZONE
PB
PM10
PM25
SO2
Year
San Antonio
Bakersfield
San Antonio
Bakersfield
San Antonio
Bakersfield
San Antonio
Bakersfield
Bakersfield
San Antonio
Bakersfield
San Antonio
Bakersfield
San Antonio
2018
83
135
N/A
0.28
4.9
12.3
25.6
32.3
0.004
N/A
N/A
53.7
8.0
15.7
0.2
N/A
2017
85
141
N/A
0.29
5.1
12.7
26.9
32.9
0.004
N/A
N/A
68.2
8.4
15.8
1.7
N/A
2016
79
127
N/A
0.27
5.2
11.7
25.7
31.0
0.004
N/A
N/A
N/A
8.2
14.5
0.8
N/A
2015
76
144
N/A
0.29
4.7
11.8
25.4
32.2
0.003
N/A
N/A
N/A
9.2
16.2
0.7
N/A
2014
84
141
N/A
0.28
5.5
13.3
27.3
31.5
N/A
N/A
N/A
53.0
9.5
17.9
0.6
N/A
2013
79
134
N/A
0.30
4.1
14.3
28.2
31.0
0.003
N/A
N/A
N/A
9.0
21.7
0.7
N/A
2012
77
145
N/A
N/A
4.5
14.6
27.5
32.4
0.004
N/A
18.1
N/A
9.2
17.2
N/A
N/A
2011
85
126
N/A
N/A
4.6
15.0
29.2
29.3
0.004
N/A
18.9
43.9
9.9
17.8
N/A
N/A
2010
75
147
0.21
N/A
7.2
14.4
25.8
29.3
0.003
N/A
17.1
39.2
9.2
17.2
N/A
N/A
2009
74
170
0.23
0.37
8.3
16.6
25.7
28.0
0.005
N/A
19.5
41.5
9.8
20.8
0.4
N/A
2008
84
171
0.26
0.48
9.3
17.4
26.8
27.8
N/A
N/A
19.8
57.0
10.1
22.7
0.5
N/A
2007
83
167
0.49
0.55
9.3
18.5
26.3
26.2
0.007
N/A
23.4
43.0
10.3
23.0
N/A
N/A
2006
86
157
0.51
0.56
9.7
19.2
32.7
29.6
N/A
N/A
24.8
N/A
9.8
18.0
N/A
N/A
2005
86
165
0.53
0.53
10.7
19.3
30.8
28.2
N/A
N/A
22.3
N/A
10.1
21.5
N/A
N/A
2004
76
163
0.48
0.51
10.4
19.9
29.6
27.1
N/A
N/A
22.4
N/A
N/A
21.3
N/A
N/A
2003
77
170
0.57
0.56
10.3
21.2
28.5
29.1
N/A
N/A
26.7
N/A
N/A
24.4
N/A
N/A
2002
88
170
0.52
0.60
11.2
22.5
30.3
26.9
0.006
N/A
N/A
N/A
N/A
29.5
N/A
N/A
2001
78
150
0.57
0.73
11.9
18.2
29.3
29.6
0.006
N/A
N/A
39.6
N/A
N/A
N/A
N/A
2000
82
130
0.52
0.77
11.7
23.4
29.6
28.8
0.006
N/A
N/A
39.6
N/A
N/A
N/A
N/A
Natural disasters
Type
San Antonio
Bakersfield
Tornado activity compared to U.S. average
91.5%
2.7%
Earthquake activity compared to U.S. average
73.7%
7,870.5%
Natural disasters compared to U.S. average
21%
29%
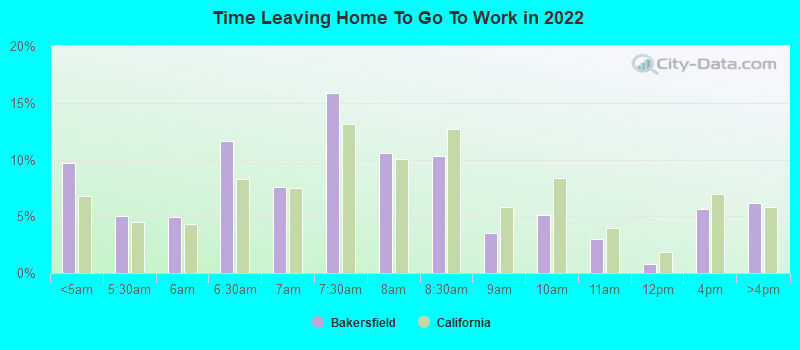
Transportation
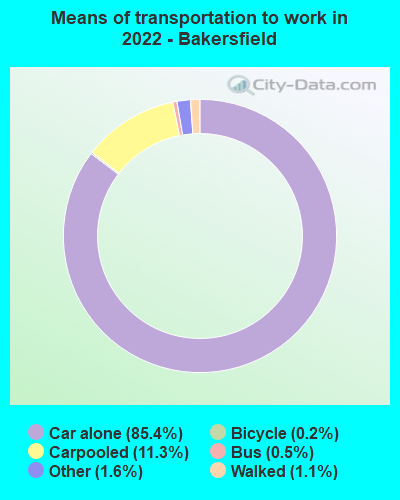
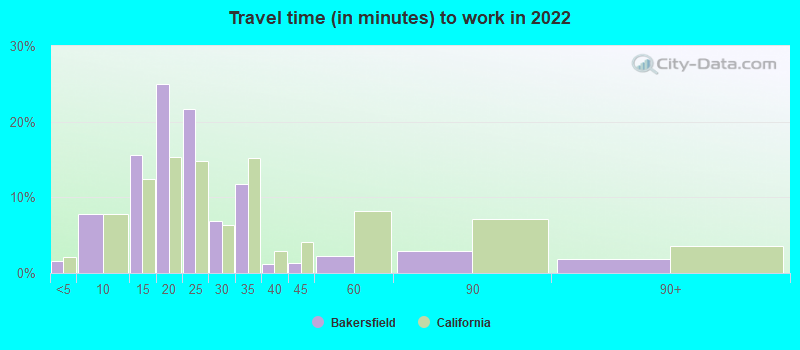
San Antonio is served by VIA Metropolitan Transit offering bus service throughout the city. Bakersfield has the Golden Empire Transit. The average commute time in both cities is comparable, although San Antonio has a higher percentage of commuters who drive.
Transport
Type
San Antonio
Bakersfield
Amtrak stations
1
1
Amtrak stations nearby
1
1
FAA registered aircraft
987
433
FAA registered aircraft manufacturers and dealers
29
12
Means of transportation to work
Type
San Antonio
Bakersfield
Bicycle
0.2%
0.2%
Bus
1.6%
0.3%
Carpooled
12.9%
8.7%
Car alone
81.9%
87.4%
Motorcycle
0.1%
0.3%
Walked
1.6%
0.8%
Average travel time to work
Type
San Antonio
Bakersfield
Average
27 min
21.5 min
Other means
23.4 min
22.2 min
Public transportation
43.5 min
44.6 min
Private vehicle occupancy
Type
San Antonio
Bakersfield
Average
1.2
1.2
Drove alone
84.6%
89.3%
In 2 person carpool
10.4%
6.2%
In 3 person carpool
3.3%
2.9%
In 4 person carpool
1%
1%
In 5-6 person carpool
0.6%
0.5%
How many people usually rode to work in the car, truck or van.
Real Estate
Real estate in Bakersfield is generally more expensive than in San Antonio, reflecting the California real estate market's overall higher prices. However, both cities offer a range of housing options, from downtown apartments to suburban single-family homes.
Neighborhoods
San Antonio has a variety of neighborhoods from historic districts like King William to bustling downtown areas. Bakersfield offers a mix of suburban neighborhoods, upscale gated communities, and rural living options on the outskirts of the city.
Houses and residents
Type
San Antonio
Bakersfield
Houses
603,670
134,270
Average household size (people)
2.7
3.1
Median year apartment built
1987
1984
Median year house/condo built
1981
1994
Length of stay in the house since moving in
14.3 years
11.8 years
Houses occupied
549,245 (91%)
128,007 (95.3%)
Houses occupied by owners
290,123 (52.8%)
78,398 (61.2%)
Houses occupied by renters
259,122 (47.2%)
49,609 (38.8%)
Median rent asked for vacant for-rent units
$1,143
$1,220
Median monthly housing costs
$1,101
$1,384
Median price asked for vacant for-sale houses and condos
$189,213
$366,859
Estimated median house or condo value
$197,600
$318,600
Median numbers of rooms
5.1
5.2
Median number of rooms in apartments
4
4.1
Median number of rooms in houses and condos
6.2
5.9
Median house price - detached houses
$238,319
$371,576
Median house price - in 2-unit structures
$407,491
$254,175
Median house price - in 3-to-4-unit structures
$120,363
$299,855
Median house price - in 5 or more unit structures
$163,867
$221,915
Median house price - mobile homes
$105,850
$92,500
Median house price - Townhouses or other attached units
$188,542
$244,694
Median house price - All housing units
$234,615
$356,236
Median house age
37
32
Renting percentage
43.5%
40.3%
Housing density (houses/condos per square mile)
1,481.2
1,187.2
House value disparities
33.6%
29.3%
Household income disparities
44.7%
44.3%
Median household income for houses/condes with a mortgage
$87,382
$98,668
Median household income for apartments without a mortgage
$60,785
$60,298
Housing units without a mortgage
5,815 (3.5%)
376 (0.7%)
Housing units with both a second mortgage and home equity loan
6,350 (3.8%)
1,793 (3.1%)
Housing units with a mortgage
160,674 (96.5%)
56,648 (99.3%)
Housing units with a home equity loan
129 (0.1%)
0 (0%)
Housing units with a second mortgage
7,761 (4.7%)
2,474 (4.3%)
House/condo owner moved in on average (years ago)
13
9
House/condo renter moved in on average (years ago)
1
2
Housing units lacking complete kitchen facilities
2.1%
2.1%
Housing units lacking complete plumbing facilities
1.3%
0.2%
Housing units in structures
Housing units in structures
San Antonio
Bakersfield
One, detached
60.4%
71.5%
One, attached
2.7%
3.9%
Two
2.2%
1.3%
3 or 4
4.9%
7.8%
5 to 9
7.8%
3.8%
10 to 19
8.5%
2.0%
20 to 49
5.4%
2.2%
50 or more
6.6%
5.1%
Mobile homes
1.5%
2.3%
Median real estate property taxes paid for housing units
Self-employed workers in own not incorporated business
46,328
11,506
State government workers
29,486
10,997
Unpaid family workers
657
161
Industries and Occupations
San Antonio's chief industries include health care, oil and gas, tourism, and military and defense. Bakersfield stands out for its oil and agriculture industries, with many occupations related to these sectors.
Both cities have a robust healthcare system, with San Antonio featuring major health systems and Bakersfield having top-notch hospitals. San Antonio has a large military medical community, while Bakersfield's health care system supports the city's substantial elder and farming population.
San Antonio boasts excellent infrastructure including a busy international airport, major highways, and a medical center with state-of-the-art hospitals. Bakersfield is also well-connected with highways and has a steadily improving infrastructure, particularly regarding its agricultural facilities.
Infrastructure
Type
San Antonio
Bakersfield
Hospitals
130
18
TV stations
30
9
Arenas or stadiums
2
1
Bank branches located here
333
65
Bank institutions located here
41
19
Main business address for public companies
23
2
Drinking water stations with no reported violations in the past
7
7
Drinking water stations with reported violations in the past
HMDA - Conventional home purchase loans - Applications denied
Year
San Antonio
Bakersfield
1999
6,847
392
2000
2,930
393
2001
2,383
297
2002
2,313
372
2003
3,759
1,104
2004
5,180
2,188
2005
6,554
3,038
2006
6,983
3,393
2007
4,562
2,036
2008
1,781
565
2009
847
289
Culture and Food
San Antonio is known for its rich Texas and Mexican culture, resulting in a bustling food scene with renowned Tex-Mex and barbecue. Bakersfield is rooted in Californian culture and cuisine with many farm-to-table restaurants, local wineries, and a significant influence of Mexican food.
Sports Teams
San Antonio is home to NBA's San Antonio Spurs while Bakersfield hosts the AHL's Bakersfield Condors and multiple minor league and college sports teams.


 San Antonio, TX
 Bakersfield, CA