San Antonio, TX and Cleveland, OH, offer unique advantages when it comes to relocation or tourism, attracting a wide range of people for different reasons. While San Antonio is renowned for its warm weather, thriving industries, and rich Hispanic culture, Cleveland stands out with its pronounced sports culture, distinctive neighborhoods, and robust healthcare system. However, each city has its distinct challenges regarding crime, cost of living and infrastructure. This detailed comparison provides insights into factors such as crime and safety, weather, cost of living, education, work, and economy among others.
Distance between
San Antonio, TX and
Cleveland, OH : 1,256.4 miles
San Antonio's population is larger by 295%. Its population has grown by 307,207 people (26.8%) since 2000. The population of Cleveland has decreased by 110,412 people (23.1%) during that time.
The crime rates in both San Antonio and Cleveland are higher than the national average, though the violent crime rate is more prevalent in Cleveland than in San Antonio. It's crucial for potential residents and tourists alike to research which neighborhoods are safest before making a decision. Both cities have implemented various measures to enhance safety, including community policing projects and safety initiatives.
City-data.com crime index counts serious crimes and violent crime more heavily. It adjusts for the number of visitors and daily workers commuting into cities. (higher means more crime, U.S. average = 301.1)
City-data.com crime index counts serious crimes and violent crime more heavily. It adjusts for the number of visitors and daily workers commuting into cities. (higher means more crime, U.S. average = 301.1)
Sex Offenders
According to our data, there are 3,771 registered sex offenders living in San Antonio and 1,976 registered sex offenders living in . The ratio of residents to sex offenders in San Antonio is 396 to 1; the ratio in Cleveland is 195 to 1. The number of registered sex offenders compared to the number of residents is a smaller in San Antonio than in Cleveland.
Cost of Living
San Antonio's cost of living is below the national average, making it more affordable, particularly for housing. On the contrary, Cleveland also has a lower cost of living relative to the national average, but not as low as San Antonio's. Groceries, healthcare, and other living essentials tend to be cheaper in both cities.
Income Tax
While San Antonio residents enjoy the benefit of no state income tax, Cleveland residents must account for both state and city income taxes in their budgeting. This creates a significant difference in the net earnings for individuals who might consider relocation.
Property Tax
San Antonio has a higher property tax rate than Cleveland, which could add to the cost of homeownership in the Texan city. Cleveland's property tax rates are lower, which when combined with affordable housing, makes homeownership more achievable.
Sales Tax
Texas, and by extension San Antonio, does not impose a state income tax, which might attract potential residents. However, its sales tax rate stands at 8.25%. Cleveland, on the other hand, has both city (2.5%) and state income tax (up to 4.797%), but a lower sales tax rate of 8%.
Income
Type
San Antonio
Cleveland
Estimated median household income
$54,923
$35,562
Estimated per capita income
$28,860
$24,093
Cost of living index (U.S. average is 100)
87.7
94.3
If you make $50,000 in San Antonio, you will have to make $53,763 in Cleveland to maintain the same standard of living.
Geographical Conditions
San Antonio is characterized by its flat, coastal plains location, offering no shortage of outdoor activities. Cleveland lies on the shores of Lake Erie, with a more varied landscape that includes rivers, hills, and lakes.
In terms of education, both cities have a variety of opportunities, ranging from public to private schools. Cleveland stands out with several top-rated colleges and the renowned Cleveland Metropolitan School District. San Antonio boasts a larger number of universities and is the home to the University of Texas at San Antonio.
San Antonio's economy is robust, driven largely by sectors such as healthcare, military, and tourism. In comparison, Cleveland's economy is diverse and includes manufacturing, healthcare, and financial services. Both cities offer opportunities for career growth, but with a higher job growth rate, San Antonio may offer a slight edge.
Biggest Employers
San Antonio's biggest employers operate primarily in the healthcare sector with HEB Grocery Store also providing a large number of jobs. In Cleveland, two of the city's prominent healthcare institutions, the Cleveland Clinic and University Hospital, are the leading employers.
There were 6,567 building permits issued in San Antonio in 2012 (4973 more than in 2011) compared to 104 building permits issued in Cleveland in 2012 (18 more than in 2011).
In San Antonio (Bexar County), 51.6% voted for Democrats and 47.1% for Republicans in 2012 Presidential Election. In Cleveland (Cuyahoga County), 69.7% voted for Democrats and 29.7% for Republicans.
Elections
Type
Democrats
Republicans
Other
Year
San Antonio
Cleveland
San Antonio
Cleveland
San Antonio
Cleveland
2020
58.3%
66.5%
40.1%
32.4%
1.5%
1.1%
2016
54.2%
65.5%
40.8%
30.3%
5.0%
4.1%
2012
51.6%
69.7%
47.1%
29.7%
1.4%
0.5%
2008
52.3%
69.1%
46.7%
30.1%
1.0%
0.8%
2004
44.5%
66.6%
55.0%
32.9%
0.6%
0.5%
2000
44.9%
62.9%
52.3%
33.6%
2.7%
3.5%
1996
49.7%
60.8%
44.6%
29.1%
5.7%
10.1%
Breakdown of population affiliated with a religious congregation
Type
Adherents
Congregations
Religion
San Antonio
Cleveland
San Antonio
Cleveland
CATHOLIC CHURCH
30.8%
28.6%
8.6%
11.3%
SOUTHERN BAPTIST CONVENTION
6.8%
0.4%
23.5%
3.0%
MUSLIM ESTIMATE
1.2%
0.3%
0.8%
1.4%
LUTHERAN CHURCH
0.7%
1.4%
1.0%
4.0%
EPISCOPAL CHURCH
0.6%
0.6%
1.6%
2.2%
EVANGELICAL LUTHERAN CHURCH IN AMERICA
0.6%
1.1%
2.2%
3.9%
AMERICAN BAPTIST CHURCHES IN THE USA
0.2%
1.6%
0.3%
3.2%
SEVENTH DAY ADVENTIST CHURCH
0.2%
0.4%
1.3%
1.6%
Weather
San Antonio offers warm, humid weather throughout most of the year with mild, wet winters. Cleveland experiences the typical Midwest seasonal variation, with hot summers and cold, snowy winters, which significantly impacts the lifestyle and activities available throughout the year. Tourists, depending on their weather preferences, may choose the ideal time to visit either city.
Weather and climate
Type
San Antonio
Cleveland
Temperature - Average
68.7°F
50.1°F
Humidity - Average morning or afternoon humidity
74.9%
75.8%
Humidity - Differences between morning and afternoon humidity
37%
27%
Humidity - Maximum monthly morning or afternoon humidity
87%
83%
Humidity - Minimum monthly morning or afternoon humidity
50%
56%
Precipitation - Yearly average
32.2 in
38.5 in
Snowfall - Yearly average
1.2 in
115.9 in
Clouds - Number of days clear of clouds
17.5%
11.2%
Sunshine amount - Average
62.4%
51.8%
Sunshine amount - Differences during a year
24%
44%
Sunshine amount - Maximum monthly
72%
66%
Sunshine amount - Minimum monthly
48%
22%
Wind speed - Average
8.9 mph
10.4 mph
Average climate in San Antonio, Texas
Average climate in Cleveland, Ohio
Air pollution
Type
AQI
CO
NO2
OZONE
PM10
PM25
SO2
Year
San Antonio
Cleveland
San Antonio
Cleveland
San Antonio
Cleveland
San Antonio
Cleveland
San Antonio
Cleveland
San Antonio
Cleveland
San Antonio
Cleveland
2018
83
85
N/A
0.26
4.9
11.3
25.6
26.9
N/A
22.7
8.0
9.3
0.2
0.6
2017
85
82
N/A
0.27
5.1
11.4
26.9
27.6
N/A
23.2
8.4
8.2
1.7
0.5
2016
79
81
N/A
0.27
5.2
11.1
25.7
27.1
N/A
23.4
8.2
9.9
0.8
1.0
2015
76
76
N/A
0.27
4.7
12.9
25.4
25.1
N/A
31.5
9.2
8.0
0.7
1.9
2014
84
83
N/A
0.25
5.5
12.3
27.3
23.7
N/A
28.4
9.5
10.6
0.6
1.7
2013
79
88
N/A
0.24
4.1
12.9
28.2
23.8
N/A
27.3
9.0
12.0
0.7
1.9
2012
77
119
N/A
0.28
4.5
13.7
27.5
26.5
18.1
32.0
9.2
15.2
N/A
2.5
2011
85
110
N/A
0.29
4.6
15.3
29.2
25.8
18.9
29.7
9.9
16.1
N/A
3.4
2010
75
113
0.21
0.35
7.2
15.8
25.8
27.0
17.1
24.2
9.2
18.7
N/A
3.6
2009
74
67
0.23
0.37
8.3
17.1
25.7
26.0
19.5
21.5
9.8
N/A
0.4
3.7
2008
84
87
0.26
0.29
9.3
15.2
26.8
32.9
19.8
27.1
10.1
N/A
0.5
4.2
2007
83
94
0.49
0.29
9.3
18.1
26.3
32.9
23.4
30.3
10.3
N/A
N/A
5.2
2006
86
75
0.51
0.25
9.7
16.2
32.7
27.7
24.8
27.3
9.8
N/A
N/A
5.0
2005
86
98
0.53
0.27
10.7
19.2
30.8
28.6
22.3
31.7
10.1
N/A
N/A
5.7
2004
76
77
0.48
0.47
10.4
19.5
29.6
20.1
22.4
29.2
N/A
N/A
N/A
3.8
2003
77
81
0.57
0.49
10.3
19.6
28.5
25.8
26.7
28.3
N/A
N/A
N/A
5.7
2002
88
95
0.52
0.40
11.2
19.8
30.3
28.6
N/A
32.5
N/A
N/A
N/A
5.1
2001
78
91
0.57
0.43
11.9
21.1
29.3
28.4
N/A
35.9
N/A
N/A
N/A
5.9
2000
82
79
0.52
0.48
11.7
20.5
29.6
25.2
N/A
35.9
N/A
N/A
N/A
5.8
Natural disasters
Type
San Antonio
Cleveland
Tornado activity compared to U.S. average
91.5%
93%
Earthquake activity compared to U.S. average
73.7%
50.2%
Natural disasters compared to U.S. average
21%
16%
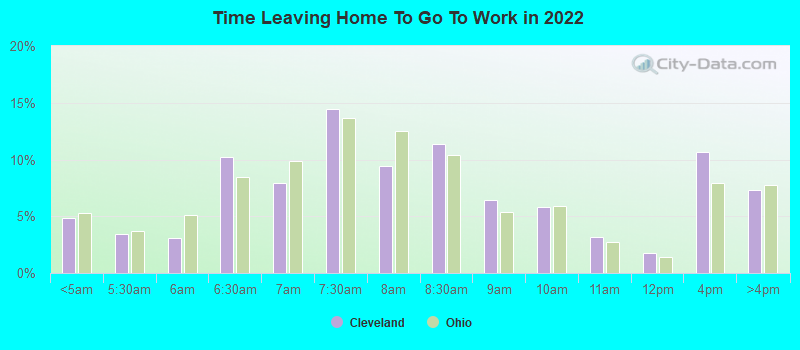
Transportation
San Antonio relies more on car commuting, with public transit options limited relative to Cleveland. Cleveland has a more extensive public transit system, and commuting times are generally shorter. Both cities have international airports serving domestic and international travelers.
Transport
Type
San Antonio
Cleveland
Amtrak stations
1
1
Amtrak stations nearby
1
1
FAA registered aircraft
987
307
FAA registered aircraft manufacturers and dealers
29
19
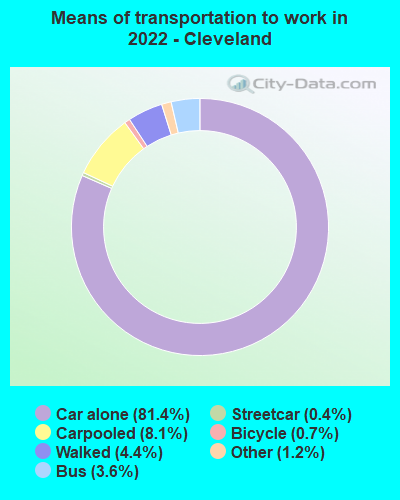
Means of transportation to work
Type
San Antonio
Cleveland
Bicycle
0.2%
0.2%
Bus
1.6%
3.5%
Carpooled
12.9%
7.7%
Car alone
81.9%
83.1%
Motorcycle
0.1%
0.1%
Railroad
0%
0.1%
Streetcar
0%
0.4%
Taxicab
0.1%
0.1%
Walked
1.6%
3.9%
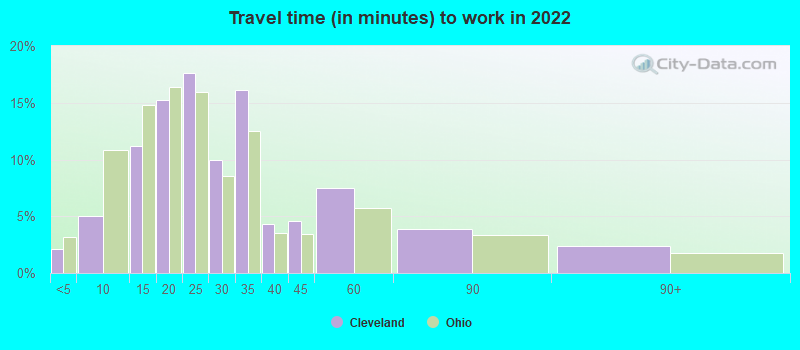
Average travel time to work
Type
San Antonio
Cleveland
Average
27 min
28.9 min
Other means
23.4 min
23.2 min
Public transportation
43.5 min
42.9 min
Private vehicle occupancy
Type
San Antonio
Cleveland
Average
1.2
1.2
Drove alone
84.6%
87.9%
In 2 person carpool
10.4%
10.3%
In 3 person carpool
3.3%
1%
In 4 person carpool
1%
0.4%
In 5-6 person carpool
0.6%
0.1%
In 7+ person carpool
0.1%
0.3%
How many people usually rode to work in the car, truck or van.
Real Estate
In terms of real estate, San Antonio's market is hotter, with home prices rising steadily due to the city's growth. However, home prices remain below the national average, making it more affordable. Contrarily, Cleveland's real estate market is more stable, with a slower growth rate but very affordable housing options.
Neighborhoods
San Antonio boasts a mix of urban and suburban neighborhoods, each offering its distinct culture and charm. Cleveland also features a diverse selection of neighborhoods, with downtown Cleveland offering a vibrant urban lifestyle while outer neighborhoods provide a more suburban feel.
Houses and residents
Type
San Antonio
Cleveland
Houses
603,670
202,735
Average household size (people)
2.7
2.3
Median year apartment built
1987
1946
Length of stay in the house since moving in
14.3 years
17.5 years
Houses occupied
549,245 (91%)
171,321 (84.5%)
Houses occupied by owners
290,123 (52.8%)
67,039 (39.1%)
Houses occupied by renters
259,122 (47.2%)
104,282 (60.9%)
Median rent asked for vacant for-rent units
$1,143
$1,284
Median monthly housing costs
$1,101
$754
Median price asked for vacant for-sale houses and condos
$189,213
$86,306
Estimated median house or condo value
$197,600
$83,400
Median numbers of rooms
5.1
5.2
Median number of rooms in apartments
4
4.4
Median number of rooms in houses and condos
6.2
6.3
Median house price - detached houses
$238,319
$104,861
Median house price - in 2-unit structures
$407,491
$81,957
Median house price - in 3-to-4-unit structures
$120,363
$250,787
Median house price - in 5 or more unit structures
$163,867
$156,467
Median house price - mobile homes
$105,850
$40,340
Median house price - Townhouses or other attached units
$188,542
$125,938
Median house price - All housing units
$234,615
$105,403
Median house age
37
80
Renting percentage
43.5%
55.9%
Housing density (houses/condos per square mile)
1,481.2
2,613.2
House value disparities
33.6%
41.6%
Household income disparities
44.7%
48.5%
Median household income for houses/condes with a mortgage
$87,382
$61,885
Median household income for apartments without a mortgage
$60,785
$42,551
Housing units without a mortgage
5,815 (3.5%)
2,325 (6.3%)
Housing units with both a second mortgage and home equity loan
6,350 (3.8%)
2,348 (6.4%)
Housing units with a mortgage
160,674 (96.5%)
34,401 (93.7%)
Housing units with a home equity loan
129 (0.1%)
166 (0.5%)
Housing units with a second mortgage
7,761 (4.7%)
3,335 (9.1%)
House/condo owner moved in on average (years ago)
13
19
House/condo renter moved in on average (years ago)
1
3
Housing units lacking complete kitchen facilities
2.1%
8.8%
Housing units lacking complete plumbing facilities
1.3%
5.1%
Housing units in structures
Housing units in structures
San Antonio
Cleveland
One, detached
60.4%
48.7%
One, attached
2.7%
5.6%
Two
2.2%
14.7%
3 or 4
4.9%
5.2%
5 to 9
7.8%
5.0%
10 to 19
8.5%
3.8%
20 to 49
5.4%
3.3%
50 or more
6.6%
13.1%
Mobile homes
1.5%
0.4%
Boats, RVs, vans, etc.
0.0%
0.1%
Median real estate property taxes paid for housing units
Self-employed workers in own not incorporated business
46,328
7,246
State government workers
29,486
2,212
Unpaid family workers
657
328
Industries and Occupations
Most of San Antonio's population works in healthcare, social assistance, and retail trade. The most common job groups involve management, business, science, and arts. In Cleveland, healthcare, manufacturing, and educational services dominate, with most people engaged in sales, office, and administrative support fields.
In terms of healthcare, Cleveland excels with the Cleveland Clinic, a top-rated hospital in the nation. San Antonio's healthcare scene is robust too, with numerous hospitals and healthcare facilities, making both cities desirable healthcare destinations.
Health (county statistics)
Type
San Antonio
Cleveland
General health status score of residents in this county from 1 (poor) to 5 (excellent)
San Antonio's infrastructure is consistent with its status as one of the fastest-growing cities, with substantial roadways and modern facilities. Cleveland, while not growing as fast, has a well-established infrastructure that includes impressive civil and industrial structures.
Infrastructure
Type
San Antonio
Cleveland
Hospitals
130
30
TV stations
30
16
Arenas or stadiums
2
4
Bank branches located here
333
116
Bank institutions located here
41
17
Main business address for public companies
23
31
Drinking water stations with no reported violations in the past
7
1
Drinking water stations with reported violations in the past
HMDA - Conventional home purchase loans - Applications denied
Year
San Antonio
Cleveland
1999
6,847
1,871
2000
2,930
2,587
2001
2,383
2,077
2002
2,313
1,561
2003
3,759
1,242
2004
5,180
1,561
2005
6,554
3,297
2006
6,983
3,951
2007
4,562
2,211
2008
1,781
482
2009
847
184
Culture and Food
Culturally, San Antonio is rich in Hispanic tradition, reflected in its architecture, festivals, and food—specifically Tex-Mex cuisine. Cleveland, on the other hand, is known as a melting pot of cultures with a diverse food scene including Polish, Italian, and Irish influences.
Sports Teams
San Antonio is home to the NBA's San Antonio Spurs, while Cleveland houses teams in three major leagues: the NBA's Cavaliers, MLB's Indians, and NFL's Browns. This difference makes Cleveland a more diversified sports city, and can tip the scales for sports enthusiasts.


 San Antonio, TX
 Cleveland, OH