San Antonio, Texas, and Fresno, California, both offer contrasting living experiences in the United States. Based on factors such as crime/safety, weather, cost of living, education, work and economy, infrastructure, industries and occupations, biggest employers, real estate, neighborhoods, transportation and commuting, taxes, food culture, sports, geographical conditions, and health care, both cities have unique nuances that attract different people, whether as residents or tourists.
Distance between
San Antonio, TX and
Fresno, CA : 1,327.7 miles
San Antonio's population is larger by 167%. Its population has grown by 307,207 people (26.8%) since 2000. The population of Fresno has grown by 116,858 people (27.3%) during that time.
Comparatively, Fresno reports a higher crime rate than San Antonio. Both cities do struggle with crime, but efforts are made to improve safety. The overall crime rate in Fresno seems to be significantly higher than the national average, whereas San Antonio's crime rate is slightly higher than the national average but lower than Fresno's. In both cities, police forces are working to improve public safety, and specific neighborhoods are safer than others.
City-data.com crime index counts serious crimes and violent crime more heavily. It adjusts for the number of visitors and daily workers commuting into cities. (higher means more crime, U.S. average = 301.1)
City-data.com crime index counts serious crimes and violent crime more heavily. It adjusts for the number of visitors and daily workers commuting into cities. (higher means more crime, U.S. average = 301.1)
Sex Offenders
According to our data, there are 3,771 registered sex offenders living in San Antonio and 1,478 registered sex offenders living in . The ratio of residents to sex offenders in San Antonio is 396 to 1; the ratio in Fresno is 353 to 1. The number of registered sex offenders compared to the number of residents in San Antonio is near to than in Fresno.
Cost of Living
San Antonio has a lower cost of living compared to Fresno. Everything from housing to groceries to health care tends to be less expensive in San Antonio. Fresno, influenced by the generally high cost of living in California, is additionally subjected to state-wide factors such as high housing costs and taxes.
Income Tax
Texas does not impose a state income tax, which adds significant savings for residents of San Antonio. Fresno residents, on the other hand, are subjected to California’s tiered income tax system which can rise up to 13.3%.
Property Tax
The average property tax rate is higher in Texas so San Antonio residents can expect to pay more in property taxes than those living in Fresno. However, this is somewhat offset by the considerably lower housing prices in Texas.
Sales Tax
California’s state sales tax (7.25%) combined with Fresno’s city sales tax (1.975%) ends up being higher than Texas' state sales tax (6.25%) and San Antonio's city sales tax (1.25%). Residents in Fresno bear a higher sales tax than those in San Antonio.
Income
Type
San Antonio
Fresno
Estimated median household income
$54,923
$61,250
Estimated per capita income
$28,860
$28,499
Cost of living index (U.S. average is 100)
87.7
96.3
If you make $50,000 in San Antonio, you will have to make $54,903 in Fresno to maintain the same standard of living.
Geographical Conditions
San Antonio has a varied topography, with lush landscapes and the San Antonio River flowing through the city. Fresno, in contrast, is situated in the wide, flat San Joaquin Valley and is known for the stunning Sierra Nevada mountain views in the distance.
In terms of education, both cities offer several choices for primary, secondary, and higher education. San Antonio boasts a larger number of post-secondary institutions, like The University of Texas at San Antonio. Fresno's school district is the fourth largest in California and Fresno State University is known for its research programs.
Both cities have diverse economies but differ in their leading industries. San Antonio's economy is heavily centered on military, health care, government-civil service, financial services, and tourism, while Fresno's economy is primarily based on agriculture, with some emphasis on medical health and education.
Biggest Employers
The biggest employers in San Antonio are the military, USAA, H-E-B supermarkets, and the health care sector. Fresno’s largest employers are within the agricultural sector, health care, and school districts like Fresno Unified School District.
There were 6,567 building permits issued in San Antonio in 2012 (4973 more than in 2011) compared to 1,911 building permits issued in Fresno in 2012 (1205 more than in 2011).
In San Antonio (Bexar County), 51.6% voted for Democrats and 47.1% for Republicans in 2012 Presidential Election. In Fresno (Fresno County), 49.8% voted for Democrats and 48.0% for Republicans.
Elections
Type
Democrats
Republicans
Other
Year
San Antonio
Fresno
San Antonio
Fresno
San Antonio
Fresno
2020
58.3%
53.0%
40.1%
45.2%
1.5%
1.8%
2016
54.2%
49.2%
40.8%
43.2%
5.0%
7.5%
2012
51.6%
49.8%
47.1%
48.0%
1.4%
2.2%
2008
52.3%
50.2%
46.7%
48.1%
1.0%
1.8%
2004
44.5%
42.0%
55.0%
57.8%
0.6%
0.3%
2000
44.9%
43.2%
52.3%
53.3%
2.7%
3.5%
1996
49.7%
45.3%
44.6%
47.4%
5.7%
7.3%
Breakdown of population affiliated with a religious congregation
Type
Adherents
Congregations
Religion
San Antonio
Fresno
San Antonio
Fresno
CATHOLIC CHURCH
30.8%
31.0%
8.6%
6.1%
SOUTHERN BAPTIST CONVENTION
6.8%
1.6%
23.5%
8.1%
MUSLIM ESTIMATE
1.2%
0.3%
0.8%
0.6%
LUTHERAN CHURCH
0.7%
0.1%
1.0%
0.7%
EPISCOPAL CHURCH
0.6%
0.0%
1.6%
0.1%
EVANGELICAL LUTHERAN CHURCH IN AMERICA
0.6%
0.5%
2.2%
2.0%
AMERICAN BAPTIST CHURCHES IN THE USA
0.2%
0.6%
0.3%
2.4%
SEVENTH DAY ADVENTIST CHURCH
0.2%
0.7%
1.3%
2.6%
Weather
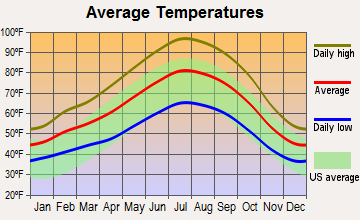
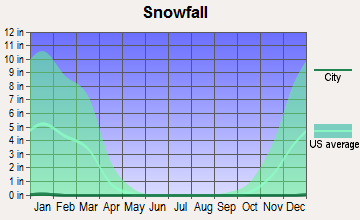
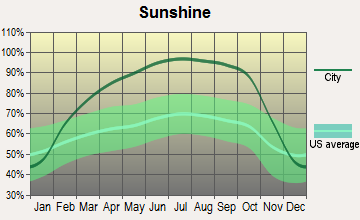
In terms of weather, Fresno generally has a Mediterranean climate with hot, dry summers and mild, wet winters. San Antonio enjoys a humid subtropical climate with long, hot summers and short, mild winters. Both cities are bright and sunny all round, but Fresno can reach higher temperatures during summer.
Weather and climate
Type
San Antonio
Fresno
Temperature - Average
68.7°F
63°F
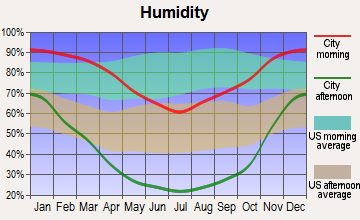
Humidity - Average morning or afternoon humidity
74.9%
60.9%
Humidity - Differences between morning and afternoon humidity
37%
67%
Humidity - Maximum monthly morning or afternoon humidity
87%
88%
Humidity - Minimum monthly morning or afternoon humidity
50%
21%
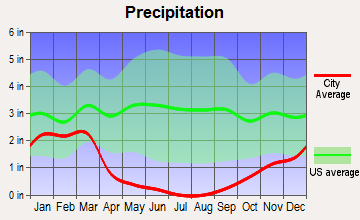
Precipitation - Yearly average
32.2 in
11.6 in
Snowfall - Yearly average
1.2 in
0 in
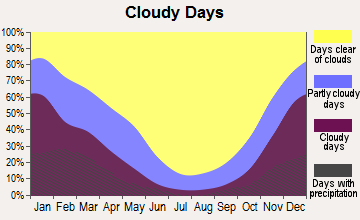
Clouds - Number of days clear of clouds
17.5%
32.4%
Sunshine amount - Average
62.4%
82.8%
Sunshine amount - Differences during a year
24%
52%
Sunshine amount - Maximum monthly
72%
96%
Sunshine amount - Minimum monthly
48%
44%
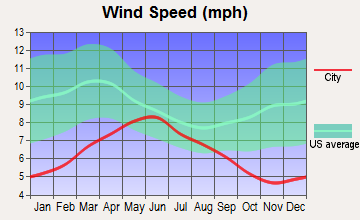
Wind speed - Average
8.9 mph
6.5 mph
Average climate in San Antonio, Texas
Average climate in Fresno, California
Air pollution
Type
AQI
CO
NO2
OZONE
PB
PM10
PM25
SO2
Year
San Antonio
Fresno
San Antonio
Fresno
San Antonio
Fresno
San Antonio
Fresno
Fresno
San Antonio
Fresno
San Antonio
Fresno
San Antonio
Fresno
2018
83
128
N/A
0.35
4.9
9.7
25.6
31.7
N/A
N/A
N/A
39.7
8.0
14.8
0.2
0.6
2017
85
132
N/A
0.35
5.1
9.2
26.9
33.2
N/A
N/A
N/A
38.3
8.4
14.3
1.7
0.6
2016
79
128
N/A
0.35
5.2
8.4
25.7
31.4
N/A
N/A
N/A
34.7
8.2
13.5
0.8
0.5
2015
76
134
N/A
0.32
4.7
8.7
25.4
31.1
N/A
N/A
N/A
34.2
9.2
13.9
0.7
0.5
2014
84
139
N/A
0.33
5.5
10.1
27.3
32.4
0.004
N/A
N/A
39.3
9.5
16.4
0.6
0.5
2013
79
136
N/A
0.37
4.1
11.1
28.2
31.0
0.005
N/A
N/A
43.3
9.0
19.1
0.7
0.6
2012
77
140
N/A
0.36
4.5
9.7
27.5
31.9
0.004
N/A
18.1
36.1
9.2
14.2
N/A
0.6
2011
85
139
N/A
0.34
4.6
8.7
29.2
33.5
N/A
N/A
18.9
30.2
9.9
21.1
N/A
0.8
2010
75
121
0.21
0.27
7.2
6.9
25.8
31.1
N/A
N/A
17.1
N/A
9.2
N/A
N/A
0.7
2009
74
107
0.23
0.31
8.3
7.3
25.7
29.6
N/A
N/A
19.5
N/A
9.8
N/A
0.4
1.6
2008
84
130
0.26
0.33
9.3
9.3
26.8
31.1
N/A
N/A
19.8
N/A
10.1
22.2
0.5
1.0
2007
83
146
0.49
0.34
9.3
10.0
26.3
28.4
N/A
N/A
23.4
N/A
10.3
26.0
N/A
0.7
2006
86
104
0.51
0.36
9.7
11.3
32.7
29.7
0.006
N/A
24.8
N/A
9.8
N/A
N/A
N/A
2005
86
101
0.53
0.33
10.7
10.7
30.8
28.1
N/A
N/A
22.3
N/A
10.1
N/A
N/A
N/A
2004
76
103
0.48
0.34
10.4
11.5
29.6
30.8
N/A
N/A
22.4
N/A
N/A
N/A
N/A
N/A
2003
77
115
0.57
0.44
10.3
15.0
28.5
31.2
N/A
N/A
26.7
N/A
N/A
N/A
N/A
1.2
2002
88
139
0.52
0.43
11.2
15.2
30.3
44.8
N/A
N/A
N/A
N/A
N/A
N/A
N/A
N/A
2001
78
143
0.57
0.42
11.9
15.1
29.3
47.3
N/A
N/A
N/A
N/A
N/A
N/A
N/A
N/A
2000
82
136
0.52
0.51
11.7
15.4
29.6
41.0
N/A
N/A
N/A
N/A
N/A
N/A
N/A
N/A
Natural disasters
Type
San Antonio
Fresno
Tornado activity compared to U.S. average
91.5%
9.9%
Earthquake activity compared to U.S. average
73.7%
8,613%
Natural disasters compared to U.S. average
21%
12%
Transportation
San Antonio offers public transportation options such as buses and a comprehensive road network. In Fresno, the Fresno Area Express (FAX) provides public bus, while an extensive freeway system allows for comfortable commuting.
Transport
Type
San Antonio
Fresno
Amtrak stations
1
1
Amtrak stations nearby
1
2
FAA registered aircraft
987
408
FAA registered aircraft manufacturers and dealers
29
36
Means of transportation to work
Type
San Antonio
Fresno
Bicycle
0.2%
0.8%
Bus
1.6%
1.3%
Carpooled
12.9%
10.7%
Car alone
81.9%
84.4%
Motorcycle
0.1%
0.2%
Walked
1.6%
1.4%
Average travel time to work
Type
San Antonio
Fresno
Average
27 min
23.7 min
Other means
23.4 min
21.5 min
Public transportation
43.5 min
45.3 min
Private vehicle occupancy
Type
San Antonio
Fresno
Average
1.2
1.2
Drove alone
84.6%
88.3%
In 2 person carpool
10.4%
8.5%
In 3 person carpool
3.3%
1.8%
In 4 person carpool
1%
0.8%
In 5-6 person carpool
0.6%
0.5%
In 7+ person carpool
0.1%
0.1%
How many people usually rode to work in the car, truck or van.
Real Estate
Real estate in San Antonio is notably cheaper than in Fresno due to the lower cost of living. The more affordable housing provides a greater opportunity for home ownership in San Antonio than in Fresno.
Neighborhoods
San Antonio is famous for its historic neighborhoods like King William District and Alamo Heights. Fresno offers the Tower District and the Old Fig Garden, both known for their charm, locally owned businesses, and community events.
Houses and residents
Type
San Antonio
Fresno
Houses
603,670
188,756
Average household size (people)
2.7
3.1
Median year apartment built
1987
1977
Median year house/condo built
1981
1983
Length of stay in the house since moving in
14.3 years
12.6 years
Houses occupied
549,245 (91%)
181,841 (96.3%)
Houses occupied by owners
290,123 (52.8%)
91,233 (50.2%)
Houses occupied by renters
259,122 (47.2%)
90,608 (49.8%)
Median rent asked for vacant for-rent units
$1,143
$958.34
Median monthly housing costs
$1,101
$1,209
Median price asked for vacant for-sale houses and condos
$189,213
$285,919
Estimated median house or condo value
$197,600
$321,300
Median numbers of rooms
5.1
5
Median number of rooms in apartments
4
4
Median number of rooms in houses and condos
6.2
5.9
Median house price - detached houses
$238,319
$375,492
Median house price - in 2-unit structures
$407,491
$184,112
Median house price - in 3-to-4-unit structures
$120,363
$196,355
Median house price - in 5 or more unit structures
$163,867
$287,684
Median house price - mobile homes
$105,850
$100,122
Median house price - Townhouses or other attached units
$188,542
$260,277
Median house price - All housing units
$234,615
$358,028
Median house age
37
42
Renting percentage
43.5%
50.9%
Housing density (houses/condos per square mile)
1,481.2
1,808.6
House value disparities
33.6%
29.4%
Household income disparities
44.7%
46.4%
Median household income for houses/condes with a mortgage
$87,382
$97,354
Median household income for apartments without a mortgage
$60,785
$73,445
Housing units without a mortgage
5,815 (3.5%)
1,037 (1.7%)
Housing units with both a second mortgage and home equity loan
6,350 (3.8%)
2,880 (4.8%)
Housing units with a mortgage
160,674 (96.5%)
59,354 (98.3%)
Housing units with a home equity loan
129 (0.1%)
68 (0.1%)
Housing units with a second mortgage
7,761 (4.7%)
4,120 (6.8%)
House/condo owner moved in on average (years ago)
13
10
House/condo renter moved in on average (years ago)
1
3
Housing units lacking complete kitchen facilities
2.1%
1.5%
Housing units lacking complete plumbing facilities
1.3%
0.4%
Housing units in structures
Housing units in structures
San Antonio
Fresno
One, detached
60.4%
59.0%
One, attached
2.7%
3.2%
Two
2.2%
3.0%
3 or 4
4.9%
7.8%
5 to 9
7.8%
9.6%
10 to 19
8.5%
3.6%
20 to 49
5.4%
3.4%
50 or more
6.6%
7.5%
Mobile homes
1.5%
2.6%
Boats, RVs, vans, etc.
0.0%
0.1%
Median real estate property taxes paid for housing units
Self-employed workers in own not incorporated business
46,328
14,428
State government workers
29,486
9,836
Unpaid family workers
657
890
Industries and Occupations
San Antonio's major industries include medical, education, bioscience, renewable energy, military, and tourism, providing immense opportunities for job seekers. Fresno, as the heart of California's agricultural San Joaquin Valley, is predominantly an agricultural town, with an increasing presence in the manufacturing, healthcare, and retail sectors contributing to its job market.
San Antonio features highly ranked health systems like the Baptist Health System, and the UT Health San Antonio. Fresno also has a robust health sector, with notable institutions such as Community Medical Centers and Saint Agnes Medical Center.
The infrastructure in both cities is well-developed, providing residents and tourists with all necessary amenities. However, San Antonio benefits from more extensive development due to its larger size and larger economy, compared to Fresno.
Infrastructure
Type
San Antonio
Fresno
Hospitals
130
32
TV stations
30
4
Arenas or stadiums
2
2
Bank branches located here
333
98
Bank institutions located here
41
25
Main business address for public companies
23
1
Drinking water stations with no reported violations in the past
7
5
Drinking water stations with reported violations in the past
HMDA - Conventional home purchase loans - Applications denied
Year
San Antonio
Fresno
1999
6,847
717
2000
2,930
484
2001
2,383
462
2002
2,313
569
2003
3,759
1,510
2004
5,180
2,462
2005
6,554
3,394
2006
6,983
3,441
2007
4,562
2,138
2008
1,781
760
2009
847
354
Culture and Food
San Antonio offers a rich blend of Mexican and Texan cultures, reflected in its food scene. The city is famous for its Tex-Mex cuisine. Fresno, on the other hand, boasts a diverse food scene influenced by its agricultural production and demographics, offering a variety of food choices, including Mexican, Armenian, and farm-to-table options.
Sports Teams
San Antonio is home to the NBA's San Antonio Spurs. On the other hand, Fresno does not house any major league sports team but is home to the Fresno Grizzlies, the AAA affiliate of the Colorado Rockies.


 San Antonio, TX
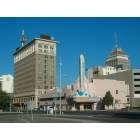
 Fresno, CA