San Antonio, TX vs Honolulu, HI - Advanced U.S. city comparison tool

San Antonio, TX vs Honolulu, HI

Comparing San Antonio, Texas, and Honolulu, Hawaii, offers a stark contrast between mainland and island living. Each city offers its unique characteristics, from the cost of living, climate, and crime rates to individual tax structures and work opportunities. Whichever city you choose depends largely on your lifestyle preferences and needs. Let's discuss the distinctions between these two U.S destinations.
 
 
Distance between San Antonio, TX and Honolulu, HI : 3,706.8 miles

San Antonio's population is larger by 288%. Its population has grown by 307,207 people (26.8%) since 2000. The population of Honolulu has grown by 3,044 people (0.8%) during that time.

Population
Type San Antonio Honolulu
Population 1,451,853 374,701
Female / male percentage 50.7% / 49.3%
50.7%
49.3%
50.9% / 49.1%
50.9%
49.1%
Racial makeup - percentage
Ethnicity San AntonioHonolulu
Hispanic 66.4% 4.4%
White Non-Hispanic 22.1% 18.7%
Black 5.8% 1.5%
Asian 2.7% 55.3%
Two or more 2.3% 13.1%
American Indian 0.1% 0.1%
Pacific Islander 0.1% 6.7%
Racial makeup - absolute values
Ethnicity San AntonioHonolulu
Hispanic 963,897 16,229
White Non-Hispanic 321,468 69,503
Black 84,366 5,706
Asian 39,158 205,563
Two or more 33,711 48,773
Pacific Islander 2,089 24,739
American Indian 1,614 500

Crime and Safety

On the whole, Honolulu is safer than San Antonio. San Antonio has a higher crime rate than the national average, with property crime being particularly prevalent. Honolulu, while having its share of crime, generally reports lower rates. Both cities have initiated programs to improve safety and continue to evolve their strategies.

Crime by year per 100,000 residents
Type City-data.com crime indexRobberies per 100,000Murders per 100,000Rapes per 100,000Assaults per 100,000Burglaries per 100,000Theft per 100,000Auto theft per 100,000Arson per 100,000
Year San AntonioHonoluluSan AntonioHonoluluSan AntonioHonoluluSan AntonioHonoluluSan AntonioHonoluluSan AntonioHonoluluSan AntonioHonoluluSan AntonioHonoluluSan AntonioHonolulu
2020 398.9 216.3 137.5 76.8 8.3 2.3 75.5 35.7 514.2 134.6 503.4 346.0 2,679.8 1,858.8 443.7 433.7 15.0 33.0
2019 437.8 243.9 126.0 98.2 6.7 2.6 104.5 40.6 471.1 135.7 524.1 402.9 3,301.1 2,238.0 499.0 399.1 11.6 27.9
2018 395.1 235.0 114.8 82.2 7.0 2.5 87.4 40.1 417.5 131.8 592.3 368.3 3,005.9 2,166.0 395.6 429.1 12.1 26.3
2017 456.4 217.2 151.1 91.7 8.2 3.2 83.5 28.8 464.7 122.7 770.8 336.3 3,622.6 2,073.9 451.4 364.1 13.6 33.0
2016 475.4 230.0 148.9 83.1 9.9 1.6 79.4 36.6 479.3 116.4 816.4 374.1 3,891.4 2,237.6 482.6 421.0 16.9 26.4
2015 427.5 232.3 135.7 89.7 6.4 1.5 71.7 31.8 373.4 120.9 794.8 428.7 3,812.8 2,294.6 422.0 387.4 17.8 23.1
2014 441.2 75.3 124.4 25.6 7.2 0.7 75.4 8.0 332.3 37.5 864.1 153.5 4,053.9 763.4 499.8 137.3 20.9 7.1
2013 458.7 114.5 156.6 36.8 5.1 1.0 47.4 12.3 421.6 65.2 1,060.9 244.2 4,184.2 1,174.8 469.9 181.0 22.5 10.4
2012 441.7 215.9 135.1 93.7 6.4 1.1 39.8 16.9 321.8 127.7 1,135.3 483.0 4,393.3 2,252.1 461.3 282.2 17.8 21.5
2011 440.6 230.3 131.7 85.2 6.6 1.5 36.3 21.1 344.7 138.3 1,131.4 557.7 4,400.4 2,282.1 434.8 337.5 15.4 23.7
2010 499.1 247.5 177.8 93.5 6.0 2.0 35.2 22.9 416.5 149.0 1,303.4 604.2 4,926.5 2,308.5 426.2 409.2 24.6 36.6
2009 497.5 267.8 195.3 95.8 7.2 1.5 45.7 26.8 322.7 155.5 1,322.0 661.3 4,926.3 2,606.8 422.4 411.1 30.3 45.5
2008 552.6 262.8 203.0 102.4 8.6 2.0 31.4 22.4 474.8 157.3 1,399.3 702.8 5,228.6 2,369.2 592.4 434.5 38.6 40.3
2007 489.6 292.0 185.7 104.1 9.3 2.1 48.2 24.9 313.2 157.3 1,271.9 637.7 4,607.0 2,923.4 510.6 545.0 34.9 44.9
2006 479.7 302.5 179.6 104.7 9.2 1.9 39.8 25.1 388.7 169.1 1,132.2 600.6 4,440.5 2,907.9 512.0 689.0 37.5 64.4
2005 391.3 170.1 171.4 92.6 6.8 1.7 47.2 25.8 411.8 162.9 1,143.2 683.4 4,826.5 3,233.4 475.3 748.2 33.7 60.2
2004 400.6 177.6 172.2 90.2 7.6 2.9 54.8 24.5 400.6 158.9 1,191.8 798.6 4,928.1 3,255.3 458.8 812.8 38.5 47.1
2003 399.0 193.5 169.9 109.2 7.0 1.7 44.3 29.4 376.8 147.6 1,205.4 880.0 5,126.9 3,544.2 511.4 911.6 44.5 43.0

City-data.com crime index counts serious crimes and violent crime more heavily. It adjusts for the number of visitors and daily workers commuting into cities. (higher means more crime, U.S. average = 301.1)


Crime per year
Type City-data.com crime indexRobberiesMurdersRapesAssaultsBurglariesTheftAuto theftArson
Year San AntonioHonoluluSan AntonioHonoluluSan AntonioHonoluluSan AntonioHonoluluSan AntonioHonoluluSan AntonioHonoluluSan AntonioHonoluluSan AntonioHonoluluSan AntonioHonolulu
2019 437.8 243.9 1,965 957 105 25 1,630 396 7,346 1,323 8,172 3,928 51,469 21,818 7,781 3,891 181 272
2018 395.1 235.0 1,767 807 107 25 1,346 394 6,427 1,294 9,118 3,617 46,271 21,271 6,089 4,214 186 258
2017 456.4 217.2 2,298 908 124 32 1,270 285 7,067 1,215 11,722 3,331 55,090 20,540 6,864 3,606 207 327
2016 475.4 230.0 2,232 827 149 16 1,190 364 7,183 1,159 12,235 3,724 58,318 22,277 7,233 4,191 254 263
2015 427.5 232.3 1,986 896 94 15 1,049 318 5,465 1,208 11,632 4,284 55,803 22,930 6,176 3,871 261 231
2014 441.2 75.3 1,777 254 103 7 1,077 80 4,747 373 12,344 1,526 57,908 7,588 7,140 1,365 298 71
2013 458.7 114.5 2,192 362 72 10 663 121 5,901 642 14,850 2,405 58,567 11,568 6,577 1,782 315 102
2012 441.7 215.9 1,864 914 89 11 549 165 4,441 1,246 15,668 4,713 60,633 21,978 6,367 2,754 245 210
2011 440.6 230.3 1,785 821 89 14 492 203 4,672 1,332 15,334 5,373 59,641 21,987 5,893 3,252 209 228
2010 499.1 247.5 2,360 891 79 19 467 218 5,528 1,420 17,301 5,760 65,395 22,007 5,657 3,901 327 349
2009 497.5 267.8 2,683 869 99 14 628 243 4,434 1,411 18,164 5,999 67,684 23,647 5,803 3,729 416 413
2008 552.6 262.8 2,743 928 116 18 424 203 6,416 1,426 18,908 6,370 70,651 21,473 8,005 3,938 521 365
2007 489.6 292.0 2,445 943 122 19 635 226 4,125 1,425 16,750 5,777 60,669 26,483 6,724 4,937 459 407
2006 479.7 302.5 2,321 956 119 17 514 229 5,023 1,543 14,629 5,482 57,377 26,540 6,615 6,288 484 588
2005 391.3 170.1 2,154 841 86 15 593 234 5,174 1,480 14,365 6,209 60,649 29,376 5,973 6,798 424 547
2004 400.6 177.6 2,127 818 94 26 677 222 4,948 1,441 14,720 7,240 60,868 29,512 5,667 7,369 476 427
2003 399.0 193.5 2,060 989 85 15 537 266 4,570 1,336 14,619 7,967 62,179 32,086 6,202 8,253 540 389

City-data.com crime index counts serious crimes and violent crime more heavily. It adjusts for the number of visitors and daily workers commuting into cities. (higher means more crime, U.S. average = 301.1)

Sex Offenders

According to our data, there are 3,771 registered sex offenders living in San Antonio and 680 registered sex offenders living in .
The ratio of residents to sex offenders in San Antonio is 396 to 1; the ratio in Honolulu is 551 to 1.
The number of registered sex offenders compared to the number of residents is larger in San Antonio than in Honolulu.

Cost of Living

Honolulu's cost of living is significantly higher than that of San Antonio. While San Antonio is one of the most cost-effective large cities in the U.S., honolulu stands as one of the most expensive, largely due to housing and groceries cost, rooted in the island's isolation.

Income Tax

Texas doesn’t have a state income tax, while Hawaii does. This can be a deciding factor for many when considering living or working in either city.

Property Tax

Both states have property taxes, but property tax rates are lower in Honolulu compared to San Antonio. This could balance out somewhat against the higher cost of real estate in Honolulu.

Sales Tax

The tax landscape differs considerably between the two cities. Texas has a higher sales tax, but Honolulu's General Excise Tax (GET) applies to many transactions, making everyday cost higher.
Income
Type San Antonio Honolulu
Estimated median household income $54,923 $78,820
Estimated per capita income $28,860 $43,518
Cost of living index (U.S. average is 100) 87.7 158.6

If you make $50,000 in San Antonio, you will have to make $90,422 in Honolulu to maintain the same standard of living.

Geographical Conditions

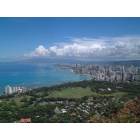
San Antonio is a flat city with the beautiful San Antonio river meandering through, and the scenic Texas Hill Country nearby. Honolulu is surrounded by stunning natural beauty, including mountains, beaches, and the vast Pacific Ocean.
Geographical information
Type San Antonio Honolulu
Land area 407.6 sq. miles 85.7 sq. miles
Population density 3,562.3 people per sq. mile 4,372.1 people per sq. mile
Relative area comparison
San Antonio, TX Honolulu, HI
First ancestry reported - percentage
Ancestry San AntonioHonolulu
German 2.9% 4.6%
Irish 1.7% 3.4%
English 1.6% 3.8%
Italian 0.6% 1.5%
Polish 0.4% 0.7%
French 0.3% 1.3%
Scottish 0.3% 0.9%
Scotch-Irish 0.3% 0.7%
Arab 0.1% 0.2%
Russian 0.1% 0.4%
Swedish 0.1% 0.7%
Norwegian 0.1% 0.7%
Portuguese 0.1% 2.2%
French Canadian 0.1% 0.2%
Dutch 0.1% 0.5%
Welsh 0.1% 0.3%
Danish 0.0% 0.2%
United States 0.0% 1.2%
Population origin - absolute values
Ancestry San AntonioHonolulu
German 27,787 17,238
Irish 15,975 12,637
English 15,429 14,124
Italian 6,027 5,697
Polish 3,706 2,616
French 3,128 4,946
Scottish 2,905 3,222
Scotch-Irish 2,557 2,612
Norwegian 1,176 2,561
Dutch 1,089 1,770
Arab 982 769
Russian 950 1,368
Czech 873 637
Swedish 740 2,651
French Canadian 690 860
Portuguese 638 8,033
Welsh 596 1,280
Hungarian 443 579
Greek 434 524
Danish 343 742
Foreign born residents - absolute values
Type Count
Region San AntonioHonolulu
All 211,380 93,895
Africa 5,275 450
Asia 37,127 80,590
Europe 7,886 4,091
Latin America 155,191 1,969
North America 1,425 1,281
Oceania 528 5,514
Foreign born residents - percentage
Type Percentage
Region San AntonioHonolulu
All 14.5% 25.3%
Africa 0.4% 0.1%
Asia 2.5% 21.7%
Europe 0.5% 1.1%
Latin America 10.6% 0.5%
North America 0.1% 0.3%
Oceania 0.0% 1.5%

Education

In San Antonio, there are numerous educational opportunities with over 30 colleges and universities including the University of Texas at San Antonio. Honolulu is home to the University of Hawaii at Manoa, a research university known for its programs in tropical agriculture, tropical medicine, and oceanography. Both cities provide ample educational opportunities to their residents.
School enrollment
Type San Antonio Honolulu
Nursery, preschool 21,297 (5.7%) 4,644 (5.1%)
Kindergarten 19,263 (5.2%) 4,262 (4.7%)
Grade 1 to 4 80,911 (21.7%) 16,555 (18.1%)
Grade 5 to 8 77,401 (20.8%) 16,085 (17.6%)
Grade 9 to 12 81,405 (21.9%) 17,604 (19.2%)
College undergrad 73,408 (19.7%) 25,671 (28.1%)
Graduate or professional 18,390 (4.9%) 6,694 (7.3%)
Students in private schools - absolute values
Type Count
Grade San AntonioHonolulu
Grades 1 to 8 (elementary and middle school) 15,798 6,743
Grades 9 to 12 (high school) 6,486 4,550
Undergraduate colleges 16,895 6,761
Students in private schools - percentage
Type Percentage
Grade San AntonioHonolulu
Grades 1 to 8 (elementary and middle school) 10.0% 20.7%
Grades 9 to 12 (high school) 8.0% 25.8%
Undergraduate colleges 23.0% 26.3%
Educational attainment
Type San Antonio Honolulu
Less than high school 16.6% 16.6%
High school or equiv. 25.3% 26%
Less than 1 year of college 7.3% 5.2%
1 or more years of college 14.7% 14.3%
Associate degree 7.9% 6.8%
Bachelor's degree 17.4% 20.4%
Master's degree 7.3% 6.5%
Profess. school degree 2.2% 2.8%
Doctorate degree 1.4% 1.4%
Education level (25-year-olds and older)
Type San Antonio Honolulu
Bachelor's degree or higher 28.3% 31.1%
Graduate or professional degree 10.9% 10.7%
High school or higher 83.4% 83.4%

Work and Economy

Both cities boast robust economies. San Antonio has a strong military presence and a growing tech scene, while Honolulu's economy heavily revolves around tourism and the government sector.

Biggest Employers

The largest employers in San Antonio include the Department of Defense, H-E-B, and USAA. In Honolulu, the government, the tourism industry, and the naval base are among the city's biggest employers.
Employment and residency - absolute values
Kind San AntonioHonolulu
Work and live in this city 428,926 147,888
Work and live in this county 643,655 N/A
Workers who work outside the city they live in 715,720 223,769
Workers who work outside the county they live in 33,919 N/A
Working at home 102,316 N/A
Not working at home 575,258 N/A
Daytime population change due to commuting 67,989 93,305
Employment and residency - percentage
Kind San AntonioHonolulu
Work and live in this city 87.3% 85.5%
Work and live in this county 95.0% N/A
Workers who work outside the city they live in 12.7% 14.5%
Workers who work outside the county they live in 5.0% N/A
Working at home 15.1% N/A
Not working at home 84.9% N/A
Daytime population change due to commuting 5.9% 25.1%

In San Antonio (Bexar County), 51.6% voted for Democrats and 47.1% for Republicans in 2012 Presidential Election. In Honolulu (Honolulu County), 68.9% voted for Democrats and 29.8% for Republicans.

Elections
Type DemocratsRepublicansOther
Year San AntonioHonoluluSan AntonioHonoluluSan AntonioHonolulu
2020 58.3% 62.7% 40.1% 35.8% 1.5% 1.5%
2016 54.2% 61.5% 40.8% 31.6% 5.0% 6.9%
2012 51.6% 68.9% 47.1% 29.8% 1.4% 1.3%
2008 52.3% 70.1% 46.7% 28.8% 1.0% 1.1%
2004 44.5% 51.1% 55.0% 48.3% 0.6% 0.6%
2000 44.9% 54.6% 52.3% 39.6% 2.7% 5.7%
1996 49.7% 56.3% 44.6% 33.6% 5.7% 10.1%
Breakdown of population affiliated with a religious congregation
Type AdherentsCongregations
Religion San AntonioHonoluluSan AntonioHonolulu
CATHOLIC CHURCH 30.8% 18.2% 8.6% 5.2%
SOUTHERN BAPTIST CONVENTION 6.8% 1.5% 23.5% 9.7%
MUSLIM ESTIMATE 1.2% 0.0% 0.8% 0.1%
LUTHERAN CHURCH 0.7% 0.1% 1.0% 0.8%
EPISCOPAL CHURCH 0.6% 0.5% 1.6% 2.7%
EVANGELICAL LUTHERAN CHURCH IN AMERICA 0.6% 0.2% 2.2% 1.1%
SEVENTH DAY ADVENTIST CHURCH 0.2% 0.5% 1.3% 2.6%

Weather

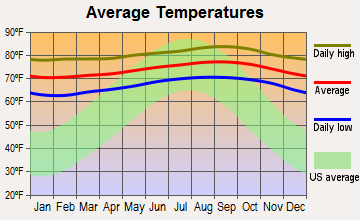
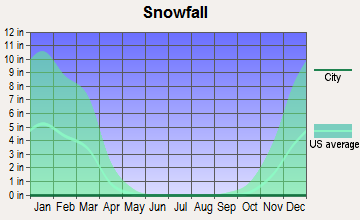
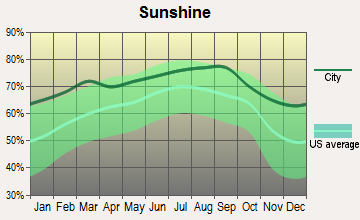
Weather factors in significantly when comparing these two locations. San Antonio offers a humid subtropical climate, with hot summers and mild winters. Its weather can vary dramatically, with temperatures reaching triple digits during summer and dipping to the 40s in winter. In contrast, Honolulu enjoys a tropical climate with pleasant weather year-round, offering consistently warm temperatures and ample sunshine.
Weather and climate
Type San Antonio Honolulu
Temperature - Average 68.7°F 73.9°F
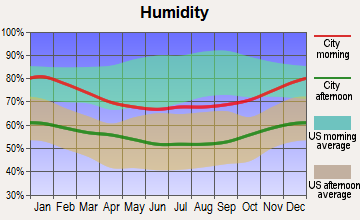
Humidity - Average morning or afternoon humidity 74.9% 70.5%
Humidity - Differences between morning and afternoon humidity 37% 27%
Humidity - Maximum monthly morning or afternoon humidity 87% 79%
Humidity - Minimum monthly morning or afternoon humidity 50% 52%
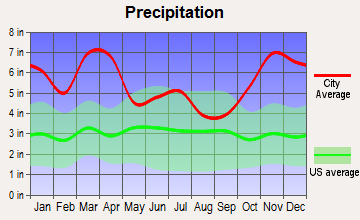
Precipitation - Yearly average 32.2 in 66.2 in
Snowfall - Yearly average 1.2 in 0 in
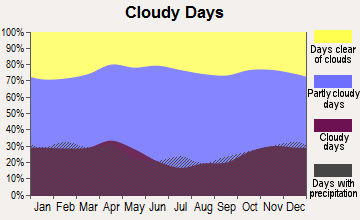
Clouds - Number of days clear of clouds 17.5% 14.9%
Sunshine amount - Average 62.4% 71%
Sunshine amount - Differences during a year 24% 19%
Sunshine amount - Maximum monthly 72% 75%
Sunshine amount - Minimum monthly 48% 56%
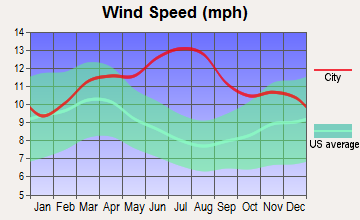
Wind speed - Average 8.9 mph 11.1 mph

Average climate in San Antonio, Texas

Chicago, Illinois average temperatures Chicago, Illinois average precipitation Chicago, Illinois humidity Chicago, Illinois wind speed Chicago, Illinois snowfall Chicago, Illinois sunshine Chicago, Illinois clear and cloudy days
 

Average climate in Honolulu, Hawaii

Chicago, Illinois average temperatures Chicago, Illinois average precipitation Chicago, Illinois humidity Chicago, Illinois wind speed Chicago, Illinois snowfall Chicago, Illinois sunshine Chicago, Illinois clear and cloudy days
 

Air pollution
Type AQICONO2OZONEPBPM10PM25SO2
Year San AntonioHonoluluSan AntonioHonoluluSan AntonioHonoluluSan AntonioHonoluluHonolulu San AntonioHonoluluSan AntonioHonoluluSan AntonioHonolulu
2018 83 43 N/A 0.45 4.9 3.9 25.6 25.8 N/A N/A N/A 12.7 8.0 3.8 0.2 0.1
2017 85 46 N/A 0.50 5.1 4.4 26.9 24.8 N/A N/A N/A 11.7 8.4 3.4 1.7 0.4
2016 79 46 N/A 0.59 5.2 3.9 25.7 24.8 N/A N/A N/A 13.5 8.2 3.5 0.8 0.3
2015 76 53 N/A 0.54 4.7 3.5 25.4 24.0 N/A N/A N/A 11.4 9.2 4.8 0.7 0.4
2014 84 45 N/A 0.41 5.5 3.4 27.3 21.6 N/A N/A N/A 13.1 9.5 4.6 0.6 1.2
2013 79 53 N/A 0.41 4.1 3.0 28.2 26.4 N/A N/A N/A 11.8 9.0 5.8 0.7 1.1
2012 77 58 N/A 0.31 4.5 2.9 27.5 24.7 N/A N/A 18.1 12.2 9.2 5.7 N/A 0.6
2011 85 57 N/A 0.39 4.6 2.9 29.2 28.4 N/A N/A 18.9 12.7 9.9 7.0 N/A 0.6
2010 75 68 0.21 0.38 7.2 3.4 25.8 N/A 0.002 N/A 17.1 N/A 9.2 7.0 N/A 1.1
2009 74 58 0.23 0.42 8.3 4.3 25.7 N/A 0.003 N/A 19.5 N/A 9.8 6.2 0.4 0.7
2008 84 19 0.26 0.45 9.3 4.2 26.8 N/A 0.002 N/A 19.8 N/A 10.1 N/A 0.5 0.6
2007 83 23 0.49 0.52 9.3 4.7 26.3 N/A 0.001 N/A 23.4 N/A 10.3 N/A N/A 0.5
2006 86 21 0.51 0.24 9.7 4.9 32.7 N/A 0.003 N/A 24.8 N/A 9.8 N/A N/A 1.0
2005 86 19 0.53 0.42 10.7 5.0 30.8 N/A 0.001 N/A 22.3 N/A 10.1 N/A N/A 0.7
2004 76 18 0.48 0.60 10.4 4.8 29.6 N/A 0.001 N/A 22.4 N/A N/A N/A N/A 0.5
2003 77 21 0.57 0.62 10.3 4.7 28.5 N/A 0.002 N/A 26.7 N/A N/A N/A N/A 0.5
2002 88 19 0.52 0.64 11.2 4.9 30.3 N/A N/A N/A N/A N/A N/A N/A N/A 0.9
2001 78 21 0.57 0.62 11.9 4.5 29.3 N/A N/A N/A N/A N/A N/A N/A N/A 0.6
2000 82 21 0.52 0.68 11.7 4.9 29.6 N/A N/A N/A N/A N/A N/A N/A N/A 0.4
Natural disasters
Type San Antonio Honolulu
Tornado activity compared to U.S. average 91.5% 3.7%
Earthquake activity compared to U.S. average 73.7% 1,260.2%
Natural disasters compared to U.S. average 21% 16%

Transportation

San Antonio's public transit primarily consists of buses, while Honolulu offers TheBus, a widely used public transit system. Needless to say, owning a car may be more feasible in San Antonio than in Honolulu due to wider streets and lower gas prices.
Transport
Type San Antonio Honolulu
Amtrak stations 1 0
Amtrak stations nearby 1 0
FAA registered aircraft 987 343
FAA registered aircraft manufacturers and dealers 29 7
Means of transportation to work
Type San Antonio Honolulu
Bicycle 0.2% 1.2%
Bus 1.6% 11.3%
Carpooled 12.9% 18.1%
Car alone 81.9% 57.7%
Motorcycle 0.1% 0.9%
Taxicab 0.1% 0.3%
Walked 1.6% 6.6%
Means of transportation to work
Average travel time to work
Type San Antonio Honolulu
Average 27 min 24 min
Travel time to work
Time leaving to work
Travel time to work
Time leaving to work

Real Estate

San Antonio real estate is noticeably more affordable than that in Honolulu. The median home cost in San Antonio is significantly less, which along with lower overall living costs, could help extend your lifestyle budget.

Neighborhoods

There's a neighborhood for every lifestyle in both cities. Whether you prefer the cultural charm of San Antonio's King William Historic District or Honolulu's serene Kailua neighborhood, both cities offer diverse living experiences.
Houses and residents
Type San Antonio Honolulu
Houses 603,670 158,659
Average household size (people) 2.7 2.6
Houses occupied 549,245 (91%) 140,328 (88.4%)
Houses occupied by owners 290,123 (52.8%) 65,860 (46.9%)
Houses occupied by renters 259,122 (47.2%) 74,468 (53.1%)
Median rent asked for vacant for-rent units $1,143 $1,820
Median price asked for vacant for-sale houses and condos $189,213 $674,769
Estimated median house or condo value $197,600 $903,138
Median number of rooms in apartments 4 2.7
Median number of rooms in houses and condos 6.2 4.4
Housing density (houses/condos per square mile) 1,481.2 1,851.3
Household income disparities 44.7% 44.4%
Housing units without a mortgage 5,815 (3.5%) 16,363 (40.7%)
Housing units with both a second mortgage and home equity loan 6,350 (3.8%) 182 (0.5%)
Housing units with a mortgage 160,674 (96.5%) 23,799 (59.3%)
Housing units with a home equity loan 129 (0.1%) 4,350 (10.8%)
Housing units with a second mortgage 7,761 (4.7%) 2,936 (7.3%)
Housing units lacking complete kitchen facilities 2.1% 1.9%
Housing units lacking complete plumbing facilities 1.3% 0.8%
Housing units in structures
Housing units in structures San AntonioHonolulu
One, detached 60.4% 31.9%
One, attached 2.7% 7.3%
Two 2.2% 2.4%
3 or 4 4.9% 4.3%
5 to 9 7.8% 6.1%
10 to 19 8.5% 6.8%
20 to 49 5.4% 9.4%
50 or more 6.6% 31.6%
Mobile homes 1.5% 0.1%
Boats, RVs, vans, etc. 0.0% 0.1%
Marital status
Type San Antonio Honolulu
Divorced 11.6% 9.7%
Never married 37.4% 31.6%
Now married 43.6% 49.7%
Separated 2.6% 1.7%
Widowed 4.8% 7.2%
Class of workers - percentage
Class of Workers San AntonioHonolulu
Employee of private company 68.4% 61.6%
Local government workers 7.5% 2.8%
Private not-for-profit wage and salary workers 6.9% 7.2%
Self-employed workers in own not incorporated business 6.8% 7.4%
State government workers 4.3% 11.3%
Federal government workers 3.2% 5.3%
Self-employed in own incorporated business 2.7% 4.0%
Unpaid family workers 0.1% 0.4%
Class of workers - absolute values
Class of Workers San AntonioHonolulu
Employee of private company 464,438 104,762
Federal government workers 21,964 9,041
Local government workers 50,959 4,720
Private not-for-profit wage and salary workers 46,650 12,222
Self-employed in own incorporated business 18,647 6,767
Self-employed workers in own not incorporated business 46,328 12,632
State government workers 29,486 19,181
Unpaid family workers 657 657

Industries and Occupations

San Antonio's leading industries include healthcare, biosciences, renewable energy, and IT. Honolulu, on the other hand, is heavily tourism-oriented, with hospitality, retail, and health care employing much of the local populace.
Food environment data per 10,000 residents
Food environment statistics San AntonioHonolulu
Number of convenience stores (no gas) 3.1 1.6
Number of convenience stores (with gas) 1.1 1.4
Number of full-service restaurants 6.8 8.2
Number of grocery stores 1.0 2.2
Number of supercenters and club stores 0.1 0.1
Food environment - absolute values
Food environment statistics San AntonioHonolulu
Number of convenience stores (no gas) 487 141
Number of convenience stores (with gas) 181 126
Number of full-service restaurants 1,073 734
Number of grocery stores 162 195
Number of supercenters and club stores 19 9
Obesity and diabetes
Food environment statistics rate San AntonioHonolulu
Adult diabetes rate 8.3% 8.3%
Adult obesity rate 26.3% 20.5%
Low-income preschool obesity rate 16.8% 8.9%

Health Care

Both cities offer robust healthcare systems. San Antonio boasts top-tier healthcare facilities such as Methodist Hospital and University Hospital. Honolulu houses the Queen's Health Systems and Kaiser Permanente, ensuring local residents have access to quality healthcare.
Health (county statistics)
Type San Antonio Honolulu
General health status score of residents in this county from 1 (poor) to 5 (excellent) 3.4 3.5
Average weight of females (lbs) 162.7 lbs 146.2 lbs
Average weight of males (lbs) 199.1 lbs 182 lbs
Residents visited a dentist within the past year 65.4% 75.1%
Residents exercised in the past month 71.2% 80%
Adult residents drank alcohol in the past 30 days 53.6% 69.9%
Residents smoked 100+ cigarettes in their lives 37.5% 41%

Fatal vehicle accidents per 100,000 residents
Type Total count per 100,000Drunk per 100,000Fatal count per 100,000Pedestrian count per 100,000Person count per 100,000Vehicle count per 100,000
Year San AntonioHonoluluSan AntonioHonoluluSan AntonioHonoluluSan AntonioHonoluluSan AntonioHonoluluSan AntonioHonolulu
2021 12.8 5.3 0.0 0.0 13.8 5.3 5.0 2.7 26.2 9.1 19.8 7.2
2020 10.2 2.1 3.3 0.3 10.9 2.1 4.4 1.6 22.8 2.9 16.5 2.4
2019 9.9 4.3 2.9 1.1 10.0 4.8 4.3 3.5 22.2 10.1 14.9 6.4
2018 9.5 6.7 2.4 1.3 9.7 6.7 3.5 4.5 21.7 13.1 14.9 9.9
2017 9.6 4.5 2.9 1.9 9.8 4.5 3.3 1.1 23.1 8.5 14.6 6.9
2016 12.4 5.9 3.0 0.8 13.4 5.9 5.1 2.1 26.4 11.2 18.9 8.8
2015 9.9 5.6 3.2 0.8 10.6 5.6 3.6 4.3 21.4 10.1 15.0 8.3
2014 9.7 5.6 3.1 1.6 10.5 5.6 4.0 3.7 20.5 6.1 14.1 5.9
2013 10.9 5.6 4.0 2.1 12.0 6.1 4.1 1.6 24.6 9.9 15.8 7.2
2012 9.0 4.0 2.7 0.8 10.0 4.0 3.4 0.8 19.9 8.3 14.4 5.9
2011 8.6 5.9 3.9 1.1 8.9 5.9 2.4 2.9 18.7 12.0 12.6 8.8
2010 8.4 6.4 4.3 1.9 9.2 6.4 2.6 3.7 18.6 10.4 12.7 8.3
2009 8.9 3.7 3.9 1.6 9.3 4.3 2.5 1.3 21.8 8.5 14.3 5.3
2008 8.3 4.6 4.2 1.6 8.8 4.8 1.9 2.1 22.0 10.4 13.5 6.2
2007 7.8 5.9 3.2 1.6 9.0 6.2 1.7 4.8 19.9 12.3 11.9 7.5
2006 9.0 8.0 1.7 2.1 9.6 8.3 2.5 3.5 23.8 20.5 13.7 12.0
2005 10.1 7.2 2.4 1.1 11.3 7.2 3.5 4.3 29.6 16.5 16.8 9.1
2004 11.0 6.9 4.0 1.9 13.2 6.9 3.4 6.1 30.9 16.8 17.1 8.3
2003 9.9 6.1 2.4 1.6 11.0 6.4 2.5 1.9 28.2 14.4 15.4 8.6
2002 11.3 7.2 2.4 1.6 12.3 7.2 2.8 4.0 31.7 14.2 17.6 8.6
2001 7.7 8.6 1.4 1.9 8.6 9.2 2.5 3.0 21.2 19.9 11.8 11.0
2000 10.2 7.0 2.9 0.8 11.7 7.8 3.2 5.9 29.8 21.0 14.6 10.2
1999 9.2 3.0 3.6 1.3 9.8 3.0 3.1 1.3 24.3 9.9 13.4 4.6
1998 10.7 5.8 3.4 3.3 11.5 5.8 3.7 1.3 29.6 13.1 15.8 8.1
1997 10.0 7.1 3.0 1.5 10.5 7.1 3.4 3.5 27.8 19.0 16.4 9.4
1996 10.8 5.8 4.0 0.5 12.2 6.1 2.8 2.8 28.7 16.0 15.8 8.4
1995 10.8 7.4 3.8 2.6 11.7 8.4 3.8 3.1 30.5 15.6 16.3 8.4
1994 9.7 8.4 3.1 2.8 10.7 8.4 3.4 3.3 27.0 18.7 13.6 10.2
1993 10.5 9.5 4.5 4.1 10.9 9.5 2.9 3.3 28.3 24.7 14.7 13.9
1992 8.9 7.4 4.7 2.3 9.5 7.7 2.9 4.1 25.8 19.2 13.6 9.0
1991 9.0 6.0 4.4 2.3 9.4 6.0 2.7 2.6 26.1 14.9 13.9 8.4
1990 8.8 9.0 4.3 3.5 9.1 9.0 0.0 0.0 19.3 20.4 12.0 11.2
1989 13.0 10.7 7.1 3.8 14.1 11.2 0.0 0.0 33.4 30.9 19.8 14.2
1988 12.5 7.7 6.1 3.6 14.1 8.5 0.0 0.0 34.7 21.9 18.1 10.7
1987 13.4 10.1 4.7 4.9 14.1 10.7 0.0 0.0 38.7 28.5 19.5 12.3
1986 16.9 6.8 4.8 3.0 18.0 7.7 0.0 0.0 45.2 21.6 24.4 10.4
1985 15.7 8.5 2.3 3.8 17.3 8.8 0.0 0.0 42.7 22.5 24.0 11.5
1984 17.0 10.1 4.8 4.1 19.0 10.7 0.0 0.0 37.7 27.7 22.1 13.1
1983 14.4 9.6 4.0 4.4 16.2 9.6 0.0 0.0 34.2 23.6 20.1 11.2
1982 16.7 9.9 3.9 4.1 18.4 10.7 0.0 0.0 36.5 28.5 21.8 14.2
1981 17.7 9.0 2.4 4.7 19.2 10.1 0.0 0.0 40.1 23.3 21.6 11.5
1980 18.4 13.1 2.2 6.3 20.1 13.7 0.0 0.0 42.8 35.6 25.1 17.3
1979 15.5 12.2 2.8 5.5 16.7 13.8 0.0 0.0 35.3 35.2 21.4 15.5
1978 15.9 8.4 3.0 4.2 17.0 8.4 0.0 0.0 33.4 17.1 19.4 10.4
1977 18.9 8.5 4.8 1.7 20.2 9.1 0.0 0.0 50.0 20.7 26.7 9.9
1976 12.4 8.9 0.3 2.0 14.2 9.2 0.0 0.0 31.5 19.5 16.5 10.6
1975 12.6 9.0 0.3 2.0 14.4 9.3 0.0 0.0 32.1 19.7 16.8 10.7

Fatal vehicle accidents
Type Total countDrunkFatal countPedestrian countPerson countVehicle count
Year San AntonioHonoluluSan AntonioHonoluluSan AntonioHonoluluSan AntonioHonoluluSan AntonioHonoluluSan AntonioHonolulu
1975 91 31 2 7 104 32 0 0 231 68 121 37
1976 91 31 2 7 104 32 0 0 231 68 121 37
1977 141 30 36 6 151 32 0 0 373 73 199 35
1978 121 30 23 15 129 30 0 0 254 61 147 37
1979 120 44 22 20 129 50 0 0 273 127 165 56
1980 145 48 17 23 158 50 0 0 336 130 197 63
1981 142 33 19 17 154 37 0 0 321 85 173 42
1982 136 36 32 15 150 39 0 0 298 104 178 52
1983 120 35 33 16 135 35 0 0 284 86 167 41
1984 144 37 41 15 161 39 0 0 319 101 187 48
1985 135 31 20 14 149 32 0 0 368 82 207 42
1986 148 25 42 11 158 28 0 0 396 79 214 38
1987 119 37 42 18 126 39 0 0 345 104 174 45
1988 113 28 55 13 128 31 0 0 314 80 164 39
1989 120 39 65 14 130 41 0 0 308 113 182 52
1990 88 33 43 13 91 33 0 0 193 75 120 41
1991 91 23 45 9 95 23 27 10 264 57 141 32
1992 92 29 49 9 98 30 30 16 266 75 140 35
1993 110 37 47 16 115 37 31 13 297 96 154 54
1994 104 33 33 11 115 33 36 13 289 73 146 40
1995 117 29 41 10 127 33 41 12 331 61 177 33
1996 119 23 44 2 134 24 31 11 316 63 174 33
1997 112 28 33 6 117 28 38 14 311 75 184 37
1998 121 23 38 13 130 23 42 5 336 52 179 32
1999 106 12 41 5 112 12 36 5 279 39 154 18
2000 117 26 33 3 134 29 37 22 341 78 167 38
2001 91 32 16 7 101 34 29 11 249 74 139 41
2002 135 27 29 6 148 27 34 15 380 53 211 32
2003 120 23 29 6 134 24 31 7 343 54 188 32
2004 136 26 49 7 163 26 42 23 383 63 212 31
2005 127 27 30 4 142 27 44 16 373 62 211 34
2006 116 30 22 8 124 31 32 13 307 77 177 45
2007 103 22 43 6 119 23 23 18 263 46 158 28
2008 112 17 57 6 119 18 26 8 297 39 182 23
2009 122 14 53 6 128 16 34 5 299 32 196 20
2010 111 24 57 7 122 24 34 14 247 39 168 31
2011 117 22 53 4 121 22 32 11 254 45 172 33
2012 124 15 38 3 138 15 47 3 275 31 199 22
2013 154 21 56 8 169 23 58 6 347 37 222 27
2014 139 21 45 6 151 21 57 14 295 23 203 22
2015 145 21 47 3 155 21 52 16 313 38 219 31
2016 184 22 44 3 199 22 76 8 393 42 282 33
2017 145 17 44 7 148 17 50 4 349 32 221 26
2018 145 25 37 5 149 25 54 17 332 49 228 37
2019 153 16 45 4 155 18 67 13 343 38 230 24
2020 147 8 47 1 157 8 63 6 328 11 237 9
2021 186 20 0 0 200 20 73 10 381 34 288 27
Police full-time law enforcement employees
Year San AntonioHonolulu
2021 2,982 2,437
2020 3,087 2,516
2019 3,362 2,349
2018 2,991 2,434
2017 2,929 2,510
2016 2,819 2,537
2015 2,708 2,539
2014 2,895 2,578
2013 2,889 2,433
2012 2,883 2,531
2011 3,002 2,544
2010 2,949 2,554
2009 2,809 2,610
2008 2,819 2,620
2007 2,773 2,548
2006 2,516 2,532
2005 2,482 2,476
2004 2,479 2,327
2003 2,504 2,454
Police full-time law enforcement employees (per 1,000 residents)
Year San AntonioHonolulu
2021 1.9 2.5
2020 2.0 2.6
2019 2.2 2.4
2018 1.9 2.5
2017 1.9 2.5
2016 1.9 2.5
2015 1.9 2.5
2014 2.0 2.6
2013 2.1 2.5
2012 2.1 2.6
2011 2.2 2.6
2010 2.2 2.7
2009 2.0 2.9
2008 2.1 2.9
2007 2.1 2.8
2006 1.9 2.8
2005 2.0 2.7
2004 2.0 2.6
2003 2.1 2.7
Local government: full-time employees
Job San AntonioHonolulu
Airports 407 0
Financial administration 597 639
Firefighters 1,791 1,095
Fire - other 110 63
Gas supply 313 0
Health 486 301
Judicial and legal 205 389
Local libraries 313 4
Natural resources 111 199
Other and unallocable 697 485
Other government administration 297 740
Parks and recreation 1,079 1,133
Police - other 636 587
Police protection - officers 2,549 2,098
Sewerage 470 608
Solid waste management 672 375
Streets and highways 587 368
Totals for government 16,101 10,021
Water supply 1,352 580
Welfare 337 0
Local government: part-time employees
Job San AntonioHonolulu
Airports 4 0
Health 14 13
Judicial and legal 8 22
Local libraries 199 0
Other and unallocable 10 5
Other government administration 6 263
Parks and recreation 39 1,533
Police - other 233 52
Police protection - officers 0 6
Sewerage 1 3
Streets and highways 0 13
Totals for government 565 2,032
Transit 0 6
Water supply 22 0
Welfare 22 0
Mechanisms of homicide
Mechanism San AntonioHonolulu
Homicides from 2000 to 2006 787 145
Cut / Pierce 113 32
Firearm 458 44
Suffocation 38 0
Mechanisms of homicide per 1,000,000 residents
Mechanism San AntonioHonolulu
Homicides from 2000 to 2006 76.7 23.3
Cut / Pierce 11.0 5.1
Firearm 44.6 7.1
Suffocation 3.7 0
Mechanisms of suicide per 1,000,000 residents
Mechanism San AntonioHonolulu
Suicides from 2000 to 2006 100.2 93.1
Fall 0 14.3
Firearm 51.5 17.2
Poisoning 18.6 14.5
Suffocation 22.5 41.6

Infrastructure

San Antonio's infrastructure supports extensive roadways, airports, and public transit systems including buses and bikes. Meanwhile, Honolulu relies heavily on maritime and air transport, with highways providing the primary means for ground travel within the city.
Infrastructure
Type San Antonio Honolulu
Hospitals 130 11
TV stations 30 13
Arenas or stadiums 2 4
Bank branches located here 333 111
Bank institutions located here 41 11
Main business address for public companies 23 9
Drinking water stations with no reported violations in the past 7 12
Drinking water stations with reported violations in the past 32 13

Schools

School facilities
Type San Antonio Honolulu
Private elementary/middle schools 43 19
Private high schools 28 18
Public elementary/middle schools 367 61
Public high schools 110 14
Colleges/Universities 49 18
HMDA - Conventional home purchase loans - Applications denied
Year San AntonioHonolulu
1999 6,847 374
2000 2,930 310
2001 2,383 233
2002 2,313 350
2003 3,759 482
2004 5,180 776
2005 6,554 1,165
2006 6,983 1,176
2007 4,562 686
2008 1,781 469
2009 847 258

Culture and Food

Both cities have distinct cultural flavors. San Antonio boasts a vibrant Mexican influence reflected in its food and annual events, while Honolulu offers a unique blend of Asian, Hawaiian, and American culture. Food lovers will enjoy the diverse culinary scenes in both cities.

Sports Teams

San Antonio is home to the Spurs, a professional NBA team. Honolulu, while doesn't have any major professional sports team, offers a thriving collegiate sport scene through the University of Hawaii.