San Diego, California and Cincinnati, Ohio are two notable American cities, each with its own unique culture, infrastructure, and lifestyle. While San Diego offers a mix of a steady economy, year-round pleasant weather, and a relaxed coastal lifestyle, Cincinnati is known for its lower cost of living, rich history, and Midwest charm. These cities have significant differences across crime rates, educational opportunities, employment, and cultural amenities which warrants close consideration for residents looking to relocate or tourists seeking a visit.
Distance between
San Diego, CA and
Cincinnati, OH : 1,866.8 miles
San Diego's population is larger by 347%. Its population has grown by 158,211 people (12.9%) since 2000. The population of Cincinnati has decreased by 22,350 people (6.7%) during that time.
On a national scale, both Cincinnati and San Diego exhibit crime rates that are moderately higher than the national average. San Diego has a lower crime rate relative to Cincinnati, making it generally safer. However, the specific suburb or neighborhood greatly affects safety levels in both cities. Both cities have taken measures to improve safety; San Diego focusing on community policing while Cincinnati has initiated data-driven anti-crime initiatives.
City-data.com crime index counts serious crimes and violent crime more heavily. It adjusts for the number of visitors and daily workers commuting into cities. (higher means more crime, U.S. average = 301.1)
City-data.com crime index counts serious crimes and violent crime more heavily. It adjusts for the number of visitors and daily workers commuting into cities. (higher means more crime, U.S. average = 301.1)
Sex Offenders
According to our data, there are 1,333 registered sex offenders living in San Diego and 1,094 registered sex offenders living in . The ratio of residents to sex offenders in San Diego is 1,055 to 1; the ratio in Cincinnati is 273 to 1. The number of registered sex offenders compared to the number of residents is a lot smaller in San Diego than in Cincinnati.
Cost of Living
San Diego is significantly more expensive to live in than Cincinnati. The overall cost of living in San Diego, including housing, groceries, utilities, transportation, and health care, is considerably higher. However, higher wages in San Diego somewhat offset the cost of living difference. Cincinnati, on the other hand, boasts a cost of living that is well below the national average, making it an affordable place to reside.
Income Tax
California, including San Diego, has a higher state income tax rate than Ohio. Ohio's income tax, applicable in Cincinnati, is more moderate and varied, depending on the income bracket.
Property Tax
Cincinnati generally has a higher property tax rate than San Diego. While property values in San Diego are much higher, the lower tax rate can offset some costs for homeowners.
Sales Tax
California's state sales tax is higher than Ohio's. San Diego levies an additional city sales tax, resulting in a higher overall sales tax than Cincinnati. Cincinnati's combined city and state sales tax is lower, making general expenses somewhat more affordable for residents and visitors.
Income
Type
San Diego
Cincinnati
Estimated median household income
$93,042
$42,733
Estimated per capita income
$48,380
$34,519
Cost of living index (U.S. average is 100)
126.4
89
If you make $50,000 in Cincinnati, you will have to make $71,011 in San Diego to maintain the same standard of living.
Geographical Conditions
San Diego is located on the Pacific coast of California and boasts a range of geographical features including beaches, hills, and canyons. Cincinnati is located on the Ohio River and is characterized by hills and river valleys, offering beautiful riverfront views.
Both cities have strong educational systems. Cincinnati is home to the well-regarded University of Cincinnati and Xavier University, while San Diego boasts several higher-education institutions including the University of California, San Diego and San Diego State University. Public and private school systems in both cities offer quality education with diverse options for households with children.
San Diego's economy is diversified, with prominent sectors including international trade, military, tourism, and research. Cincinnati, too, has a vibrant economy, with strengths in finance, manufacturing, and health services. While unemployment rates can vary, overall, both cities exhibit strong job markets with plenty of opportunities.
Biggest Employers
In San Diego, the U.S. Navy, University of California San Diego, and Sharp Healthcare are the top employers, while in Cincinnati, top employers include Kroger, the University of Cincinnati, and Procter & Gamble. Both cities can offer job stability due to large, well-established employers present.
There were 539 building permits issued in San Diego in 2012 (88 more than in 2011) compared to 206 building permits issued in Cincinnati in 2012 (122 more than in 2011).
In San Diego (San Diego County), 52.6% voted for Democrats and 45.0% for Republicans in 2012 Presidential Election. In Cincinnati (Hamilton County), 52.7% voted for Democrats and 46.4% for Republicans.
Elections
Type
Democrats
Republicans
Other
Year
San Diego
Cincinnati
San Diego
Cincinnati
San Diego
Cincinnati
2020
60.3%
57.2%
37.5%
41.3%
2.1%
1.5%
2016
56.3%
52.8%
36.6%
42.5%
7.1%
4.8%
2012
52.6%
52.7%
45.0%
46.4%
2.4%
0.9%
2008
54.2%
53.1%
44.0%
46.1%
1.8%
0.7%
2004
46.7%
47.3%
52.9%
52.7%
0.4%
0.0%
2000
45.8%
42.8%
49.8%
54.1%
4.5%
3.1%
1996
44.1%
43.1%
45.6%
50.1%
10.3%
6.8%
Breakdown of population affiliated with a religious congregation
Type
Adherents
Congregations
Religion
San Diego
Cincinnati
San Diego
Cincinnati
CATHOLIC CHURCH
25.9%
25.6%
6.7%
12.5%
SOUTHERN BAPTIST CONVENTION
1.1%
1.2%
12.0%
6.5%
MUSLIM ESTIMATE
0.7%
0.2%
1.1%
0.6%
SEVENTH DAY ADVENTIST CHURCH
0.5%
0.2%
2.0%
0.9%
EPISCOPAL CHURCH
0.4%
1.1%
2.0%
3.0%
EVANGELICAL LUTHERAN CHURCH IN AMERICA
0.4%
0.6%
2.0%
1.8%
LUTHERAN CHURCH
0.4%
0.3%
2.2%
1.5%
AMERICAN BAPTIST CHURCHES IN THE USA
0.1%
1.3%
1.5%
2.6%
VINEYARD USA
0.0%
1.8%
0.3%
1.1%
Weather
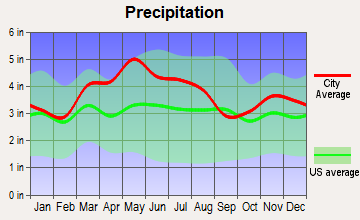
Weather is one of the most conspicuous differences between these two cities. San Diego is noted for its warm, mild, and sunny climate that lasts almost year-round. Winters are mild and summers are usually warm without high humidity. In contrast, Cincinnati experiences a classic Midwest climate with all four seasons, ranging from hot, humid summers to potentially harsh winters with snowfall.
Weather and climate
Type
San Diego
Cincinnati
Temperature - Average
64.4°F
52.9°F
Humidity - Average morning or afternoon humidity
74%
75.8%
Humidity - Differences between morning and afternoon humidity
22%
34%
Humidity - Maximum monthly morning or afternoon humidity
80%
87%
Humidity - Minimum monthly morning or afternoon humidity
58%
53%
Precipitation - Yearly average
11 in
45 in
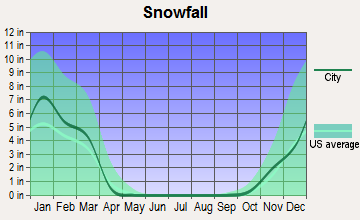
Snowfall - Yearly average
0 in
47.6 in
Clouds - Number of days clear of clouds
24.3%
13.5%
Sunshine amount - Average
74.8%
57.8%
Sunshine amount - Differences during a year
19%
33.1%
Sunshine amount - Maximum monthly
75%
67%
Sunshine amount - Minimum monthly
56%
33.9%
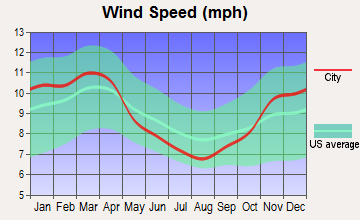
Wind speed - Average
6.9 mph
9 mph
Average climate in San Diego, California
Average climate in Cincinnati, Ohio
Air pollution
Type
AQI
CO
NO2
OZONE
PB
PM10
PM25
SO2
Year
San Diego
Cincinnati
San Diego
Cincinnati
San Diego
Cincinnati
San Diego
Cincinnati
San Diego
San Diego
Cincinnati
San Diego
Cincinnati
San Diego
Cincinnati
2018
101
87
0.53
0.20
11.2
9.6
32.6
27.8
0.007
N/A
N/A
18.3
10.5
10.5
0.1
0.8
2017
115
81
0.63
0.23
12.7
8.5
32.7
29.2
0.007
N/A
N/A
18.8
10.8
9.2
0.1
1.1
2016
105
88
0.46
0.24
13.0
9.4
30.4
28.4
0.006
N/A
N/A
21.2
11.4
8.4
0.1
1.1
2015
111
91
0.43
0.26
13.2
11.0
29.9
26.4
0.005
N/A
N/A
21.5
11.9
9.5
0.1
1.5
2014
105
89
0.44
0.24
11.6
11.4
31.1
27.3
0.007
N/A
N/A
19.5
11.1
12.0
0.1
2.0
2013
138
92
0.50
0.24
12.4
11.5
27.4
27.0
0.019
N/A
N/A
22.9
12.3
11.9
0.2
2.6
2012
110
97
0.53
0.26
12.7
4.8
28.0
27.6
0.019
N/A
N/A
23.4
13.6
13.6
0.2
3.4
2011
122
102
0.51
0.26
13.5
12.9
29.0
28.1
0.034
N/A
N/A
22.1
14.0
13.1
1.5
4.0
2010
109
113
0.52
N/A
14.0
14.7
29.3
29.7
0.019
N/A
N/A
26.6
13.9
18.7
1.0
3.7
2009
121
77
0.64
N/A
15.6
14.4
26.9
25.6
0.014
N/A
N/A
22.6
15.1
8.2
2.7
2.2
2008
127
85
0.71
N/A
16.1
16.0
28.4
26.5
N/A
N/A
67.3
N/A
N/A
9.4
2.6
3.0
2007
157
100
0.71
N/A
16.4
17.1
28.0
30.2
0.012
N/A
64.6
N/A
N/A
12.7
2.8
4.0
2006
123
83
0.81
N/A
18.9
18.0
27.1
29.3
0.056
N/A
64.8
21.9
N/A
N/A
3.4
4.2
2005
112
110
0.90
0.49
19.2
20.6
24.4
30.9
0.049
N/A
N/A
N/A
N/A
N/A
3.7
5.6
2004
120
91
0.93
0.36
18.4
18.7
25.9
27.7
0.055
N/A
N/A
N/A
N/A
N/A
4.6
5.5
2003
124
86
0.88
0.33
19.4
21.9
25.4
27.6
0.049
N/A
N/A
N/A
N/A
N/A
3.8
4.9
2002
125
98
0.86
0.32
20.9
21.4
25.9
29.4
0.039
N/A
N/A
20.0
N/A
N/A
3.6
4.5
2001
132
102
0.93
0.41
20.4
21.4
26.5
29.4
0.048
N/A
N/A
22.9
N/A
N/A
3.4
5.0
2000
134
104
1.02
0.40
22.3
22.1
23.8
28.0
0.054
N/A
N/A
N/A
N/A
N/A
3.6
6.3
Natural disasters
Type
San Diego
Cincinnati
Tornado activity compared to U.S. average
6.7%
166.3%
Earthquake activity compared to U.S. average
5,835%
148.2%
Natural disasters compared to U.S. average
39%
15%
Transportation
Both cities have well-established public transportation systems. San Diego's relies heavily on buses and light rail systems, and commuting by bicycle is also popular. Cincinnati has the Southwest Ohio Regional Transit Authority, offering bus transit along with bike-sharing options. The historic Cincinnati Bell Connector streetcar navigates through the heart of the city.
Transport
Type
San Diego
Cincinnati
Amtrak stations
1
1
Amtrak stations nearby
2
2
FAA registered aircraft
852
454
FAA registered aircraft manufacturers and dealers
33
16
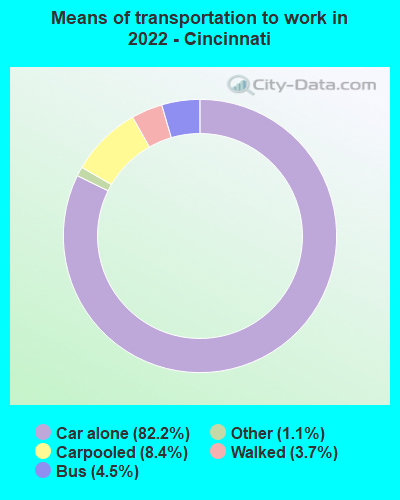
Means of transportation to work
Type
San Diego
Cincinnati
Bicycle
0.6%
0.3%
Bus
2%
3.2%
Carpooled
9.4%
7.2%
Car alone
81.7%
84.7%
Ferryboat
0.1%
0%
Motorcycle
0.3%
0.1%
Railroad
0.5%
0%
Taxicab
0.1%
0.3%
Walked
3.6%
3.4%
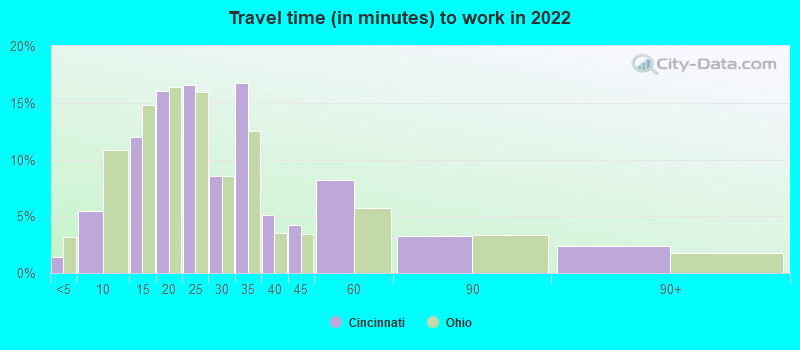
Average travel time to work
Type
San Diego
Cincinnati
Average
27.4 min
26.9 min
Other means
22.7 min
21.8 min
Public transportation
45.7 min
38 min
Private vehicle occupancy
Type
San Diego
Cincinnati
Average
1.2
1.1
Drove alone
89.5%
89.6%
In 2 person carpool
7.6%
8.6%
In 3 person carpool
1.8%
1%
In 4 person carpool
0.4%
0.6%
In 5-6 person carpool
0.5%
0.2%
In 7+ person carpool
0.2%
0%
How many people usually rode to work in the car, truck or van.
Real Estate
Real estate in San Diego is known for its high prices, with median home values significantly above the national average. Cincinnati offers much more affordable housing, with median home values below the national average. Additionally, Cincinnati offers a greater spread of housing styles due to its older and more historically diverse architecture.
Neighborhoods
San Diego is filled with beachfront communities like La Jolla and urban neighborhoods like Gaslamp Quarter. Cincinnati also offers diverse living options, from the urban Over-the-Rhine district to the suburb of Hyde Park. Both cities provide a range of neighborhoods to suit varying lifestyles.
Houses and residents
Type
San Diego
Cincinnati
Houses
555,456
160,420
Average household size (people)
2.6
2.1
Median year apartment built
1980
1961
Length of stay in the house since moving in
14.1 years
13.7 years
Houses occupied
521,000 (93.8%)
144,929 (90.3%)
Houses occupied by owners
251,507 (48.3%)
55,411 (38.2%)
Houses occupied by renters
269,493 (51.7%)
89,518 (61.8%)
Median rent asked for vacant for-rent units
$2,096
$823.02
Median monthly housing costs
$2,044
$918
Median price asked for vacant for-sale houses and condos
$957,871
$55,446
Estimated median house or condo value
$768,800
$190,300
Median numbers of rooms
4.6
4.6
Median number of rooms in apartments
3.7
3.7
Median number of rooms in houses and condos
5.9
6.5
Median house price - detached houses
Over $1,000,000
$271,565
Median house price - in 2-unit structures
Over $1,000,000
$236,559
Median house price - in 3-to-4-unit structures
$529,375
$378,023
Median house price - in 5 or more unit structures
$543,091
$288,600
Median house price - mobile homes
$134,064
$76,176
Median house price - Townhouses or other attached units
$696,014
$269,604
Median house price - All housing units
$941,291
$273,493
Median house age
42
70
Renting percentage
51.7%
61.1%
Housing density (houses/condos per square mile)
1,712.6
2,057.5
House value disparities
23.6%
42.9%
Household income disparities
42.3%
51.8%
Median household income for houses/condes with a mortgage
$138,584
$87,346
Median household income for apartments without a mortgage
$97,588
$63,683
Housing units without a mortgage
2,803 (1.6%)
1,063 (2.8%)
Housing units with both a second mortgage and home equity loan
12,495 (6.9%)
2,466 (6.5%)
Housing units with a mortgage
177,643 (98.4%)
36,710 (97.2%)
Housing units with a home equity loan
694 (0.4%)
116 (0.3%)
Housing units with a second mortgage
16,654 (9.2%)
3,803 (10.1%)
House/condo owner moved in on average (years ago)
11
11
House/condo renter moved in on average (years ago)
1
1
Housing units lacking complete kitchen facilities
0.8%
2.4%
Housing units lacking complete plumbing facilities
0.3%
1.5%
Housing units in structures
Housing units in structures
San Diego
Cincinnati
One, detached
43.4%
36.6%
One, attached
9.9%
4.9%
Two
1.9%
7.5%
3 or 4
6.0%
12.0%
5 to 9
9.3%
8.8%
10 to 19
7.4%
10.0%
20 to 49
6.3%
6.7%
50 or more
14.6%
13.2%
Mobile homes
1.0%
0.3%
Median real estate property taxes paid for housing units
Self-employed workers in own not incorporated business
39,709
6,809
State government workers
29,438
4,546
Unpaid family workers
808
42
Industries and Occupations
Major industries in San Diego include defense/military, tourism, international trade, and research. In Cincinnati, finance, insurance, healthcare, manufacturing, and education are mainstays of the local economy. As a result, job opportunities in a range of fields are prevalent in both cities.
Both cities are equipped with highly rated healthcare systems. San Diego is home to world-renowned UC San Diego Health and Scripps Health. Cincinnati is home to the highly ranked University Hospital and the Cincinnati Children's Hospital Medical Center.
Health (county statistics)
Type
San Diego
Cincinnati
General health status score of residents in this county from 1 (poor) to 5 (excellent)
San Diego's infrastructure is more modern and is continually being updated due to the city's steady growth. On the other hand, Cincinnati has well-established infrastructure, subtly infused with historic charm. Cincinnati's historic architecture extends to the iconic John A. Roebling Suspension Bridge and Union Terminal.
Infrastructure
Type
San Diego
Cincinnati
Hospitals
26
46
TV stations
13
16
Arenas or stadiums
4
6
Bank branches located here
255
289
Bank institutions located here
40
35
Main business address for public companies
92
30
Drinking water stations with no reported violations in the past
5
2
Drinking water stations with reported violations in the past
HMDA - Conventional home purchase loans - Applications denied
Year
San Diego
Cincinnati
1999
3,865
1,027
2000
2,257
1,294
2001
1,754
1,046
2002
2,118
978
2003
5,074
1,051
2004
7,646
1,275
2005
8,409
1,694
2006
7,551
1,584
2007
5,741
991
2008
2,876
436
2009
1,675
279
Culture and Food
Culturally, both cities are rich and diverse. San Diego is known for its laid-back beach culture, world-class zoos, and thriving craft beer scene. It also has a distinct culinary advantage with its close proximity to the Mexican border leading to a popular "Baja-Med" hybrid cuisine. Cincinnati, on the other hand, boasts a range of historical attractions, numerous museums, and theatres. The city is famous for its unique chili and the historic Findlay Market.
Sports Teams
San Diego is home to the Padres (MLB), while Cincinnati is home to the Reds (MLB) and the Bengals (NFL). Both cities have a rich sports history and enthusiastic fan bases, making them great for sports enthusiasts.


 San Diego, CA
 Cincinnati, OH