Comparing between San Diego, California, and New Orleans, Louisiana, presents a study in contrasts in terms of climate, culture, and economy. San Diego is celebrated for its warm, mild weather, its high-quality educational institutions, and a bustling technology-driven economy. Conversely, New Orleans boasts rich cultural heritage, exemplified in its culinary scene and music, and a service-oriented economy rooted in tourism and port activities. Here we delve into aspects like crime rate, cost of living, and transportation facilities to provide a comprehensive comparison.
Distance between
San Diego, CA and
New Orleans, LA : 1,605.1 miles
San Diego's population is larger by 267%. Its population has grown by 158,211 people (12.9%) since 2000. The population of New Orleans has decreased by 107,703 people (22.2%) during that time.
When it comes to crime rates, San Diego has a lower crime rate compared to New Orleans. San Diego is often cited as one of the safest big cities in the United States, which makes it attractive for people who are considering relocating. On the other hand, although New Orleans has experienced a decline in crime rates, it still has one of the highest crime rates among U.S cities. It's worth considering, however, that like any city, crime is higher in certain neighborhoods.
City-data.com crime index counts serious crimes and violent crime more heavily. It adjusts for the number of visitors and daily workers commuting into cities. (higher means more crime, U.S. average = 301.1)
City-data.com crime index counts serious crimes and violent crime more heavily. It adjusts for the number of visitors and daily workers commuting into cities. (higher means more crime, U.S. average = 301.1)
Sex Offenders
According to our data, there are 1,333 registered sex offenders living in San Diego and 701 registered sex offenders living in . The ratio of residents to sex offenders in San Diego is 1,055 to 1; the ratio in New Orleans is 558 to 1. The number of registered sex offenders compared to the number of residents is a smaller in San Diego than in New Orleans.
Cost of Living
The cost of living in San Diego is significantly higher than in New Orleans, especially in terms of housing. San Diego is amongst the state's top cost-of-living areas while New Orleans, despite some increases in recent years, still maintains a relatively lower cost, particularly for the Southern U.S.
Income Tax
California has a progressive income tax system, whereas Louisiana has a relatively less progressive income tax. Consequently, high-income earners may find themselves paying significantly more in San Diego than they would in New Orleans.
Property Tax
Property taxes in Louisiana are generally lower than in California. The average effective property tax rate in San Diego (CA) is around 0.7% of a property's assessed fair market value, compared to approximately 0.5% in New Orleans (LA).
Sales Tax
State sales tax in California is 7.25%, higher than Louisiana's state rate of 4.45%. Furthermore, when combined with local surtaxes, San Diego's total sales tax is 7.75% compared to New Orleans' 9.45%.
Income
Type
San Diego
New Orleans
Estimated median household income
$93,042
$46,942
Estimated per capita income
$48,380
$35,587
Cost of living index (U.S. average is 100)
126.4
97.9
If you make $50,000 in New Orleans, you will have to make $64,556 in San Diego to maintain the same standard of living.
Geographical Conditions
San Diego enjoys a coastal location, like New Orleans, but its terrain is more varied and includes mountains, valleys, and canyons. New Orleans' unique geography includes bayous and a close proximity to the Mississippi River, which adds to its charm but also makes it more vulnerable to flooding.
Education-wise, San Diego is home to several high-ranking public schools and universities, such as the University of California San Diego (UCSD), making it an excellent place for those intending to pursue higher education. On the opposite, New Orleans has struggled with its public education system post-Katrina, but it's also home to prominent universities like Tulane and Loyola.
San Diego's economy is propelled by military and defense-related activities, tourism, international trade, and manufacturing. In contrast, New Orleans has a service-oriented economy largely driven by tourism, port activities, healthcare, and oil refining. Despite these differences, both cities offer an array of job opportunities in their dominant sectors.
Biggest Employers
The First Way is the largest group of community health centers in San Diego (CA) while the United States Navy is notably large as an employer. In New Orleans, Ochsner Health System dominates, while Tulane University also provides substantial employment.
There were 539 building permits issued in San Diego in 2012 (88 more than in 2011) compared to 716 building permits issued in New Orleans in 2012 (1 less than in 2011).
In San Diego (San Diego County), 52.6% voted for Democrats and 45.0% for Republicans in 2012 Presidential Election. In New Orleans (Orleans Parish), 80.5% voted for Democrats and 17.8% for Republicans.
Elections
Type
Democrats
Republicans
Other
Year
San Diego
New Orleans
San Diego
New Orleans
San Diego
New Orleans
2020
60.3%
83.6%
37.5%
15.1%
2.1%
1.3%
2016
56.3%
81.1%
36.6%
14.7%
7.1%
4.2%
2012
52.6%
80.5%
45.0%
17.8%
2.4%
1.7%
2008
54.2%
79.6%
44.0%
19.1%
1.8%
1.3%
2004
46.7%
77.8%
52.9%
21.8%
0.4%
0.4%
2000
45.8%
76.2%
49.8%
21.8%
4.5%
2.0%
1996
44.1%
90.7%
45.6%
8.2%
10.3%
1.2%
Breakdown of population affiliated with a religious congregation
Type
Adherents
Congregations
Religion
San Diego
New Orleans
San Diego
New Orleans
CATHOLIC CHURCH
25.9%
30.9%
6.7%
16.0%
SOUTHERN BAPTIST CONVENTION
1.1%
4.3%
12.0%
13.0%
MUSLIM ESTIMATE
0.7%
0.5%
1.1%
1.8%
SEVENTH DAY ADVENTIST CHURCH
0.5%
1.1%
2.0%
1.8%
EPISCOPAL CHURCH
0.4%
1.5%
2.0%
4.2%
EVANGELICAL LUTHERAN CHURCH IN AMERICA
0.4%
0.2%
2.0%
0.9%
LUTHERAN CHURCH
0.4%
0.5%
2.2%
3.9%
AMERICAN BAPTIST CHURCHES IN THE USA
0.1%
0.6%
1.5%
0.6%
Weather
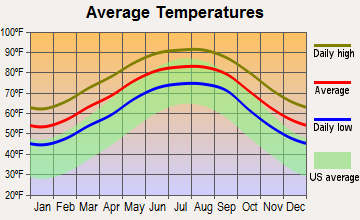
Weather-wise, San Diego typically enjoys a warm, mild climate year-round, making it appealing for those who enjoy outdoor activities. Conversely, New Orleans has a humid subtropical climate, with long, hot, and humid summers, and mild winters. It's also more prone to severe weather events, like hurricanes, than San Diego.
Weather and climate
Type
San Diego
New Orleans
Temperature - Average
64.4°F
69.6°F
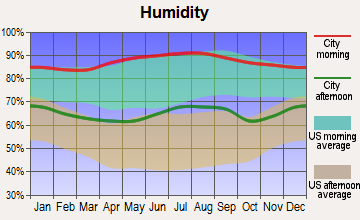
Humidity - Average morning or afternoon humidity
74%
80.8%
Humidity - Differences between morning and afternoon humidity
22%
32%
Humidity - Maximum monthly morning or afternoon humidity
80%
91%
Humidity - Minimum monthly morning or afternoon humidity
58%
59%
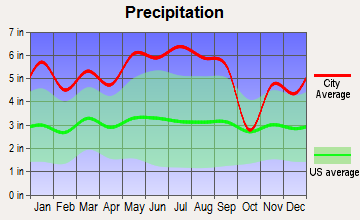
Precipitation - Yearly average
11 in
62.2 in
Snowfall - Yearly average
0 in
0.2 in
Clouds - Number of days clear of clouds
24.3%
16.9%
Sunshine amount - Average
74.8%
63.7%
Sunshine amount - Differences during a year
19%
22%
Sunshine amount - Maximum monthly
75%
70%
Sunshine amount - Minimum monthly
56%
48%
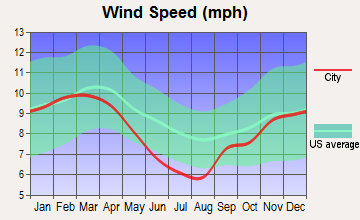
Wind speed - Average
6.9 mph
8.7 mph
Average climate in San Diego, California
Average climate in New Orleans, Louisiana
Air pollution
Type
AQI
CO
NO2
OZONE
PB
PM10
PM25
SO2
Year
San Diego
New Orleans
San Diego
New Orleans
San Diego
New Orleans
San Diego
New Orleans
San Diego
San Diego
New Orleans
San Diego
New Orleans
San Diego
New Orleans
2018
101
75
0.53
N/A
11.2
5.5
32.6
27.9
0.007
N/A
N/A
19.6
10.5
9.5
0.1
1.1
2017
115
73
0.63
N/A
12.7
6.0
32.7
27.6
0.007
N/A
N/A
18.8
10.8
9.5
0.1
1.6
2016
105
71
0.46
N/A
13.0
6.7
30.4
29.1
0.006
N/A
N/A
16.5
11.4
9.4
0.1
1.7
2015
111
76
0.43
N/A
13.2
6.3
29.9
26.5
0.005
N/A
N/A
17.5
11.9
8.8
0.1
1.3
2014
105
79
0.44
N/A
11.6
6.7
31.1
25.6
0.007
N/A
N/A
17.7
11.1
7.7
0.1
2.0
2013
138
73
0.50
N/A
12.4
6.5
27.4
25.8
0.019
N/A
N/A
17.8
12.3
7.4
0.2
2.6
2012
110
84
0.53
N/A
12.7
7.8
28.0
26.8
0.019
N/A
N/A
24.0
13.6
10.0
0.2
2.5
2011
122
93
0.51
N/A
13.5
7.8
29.0
27.0
0.034
N/A
N/A
24.9
14.0
8.8
1.5
2.1
2010
109
89
0.52
N/A
14.0
7.8
29.3
27.5
0.019
N/A
N/A
26.7
13.9
9.5
1.0
2.9
2009
121
81
0.64
N/A
15.6
7.6
26.9
26.5
0.014
N/A
N/A
N/A
15.1
9.1
2.7
2.8
2008
127
81
0.71
N/A
16.1
9.3
28.4
27.3
N/A
N/A
67.3
N/A
N/A
10.0
2.6
3.0
2007
157
97
0.71
N/A
16.4
9.1
28.0
28.4
0.012
N/A
64.6
N/A
N/A
10.2
2.8
3.6
2006
123
93
0.81
N/A
18.9
9.7
27.1
28.7
0.056
N/A
64.8
N/A
N/A
11.2
3.4
N/A
2005
112
93
0.90
0.58
19.2
9.0
24.4
24.7
0.049
N/A
N/A
N/A
N/A
10.6
3.7
N/A
2004
120
96
0.93
0.68
18.4
9.5
25.9
21.3
0.055
N/A
N/A
N/A
N/A
10.3
4.6
N/A
2003
124
91
0.88
0.84
19.4
9.9
25.4
19.5
0.049
N/A
N/A
N/A
N/A
11.5
3.8
N/A
2002
125
68
0.86
0.61
20.9
9.3
25.9
20.2
0.039
N/A
N/A
N/A
N/A
N/A
3.6
N/A
2001
132
88
0.93
0.81
20.4
10.2
26.5
20.6
0.048
N/A
N/A
N/A
N/A
N/A
3.4
N/A
2000
134
105
1.02
0.55
22.3
11.3
23.8
24.5
0.054
N/A
N/A
N/A
N/A
N/A
3.6
N/A
Natural disasters
Type
San Diego
New Orleans
Tornado activity compared to U.S. average
6.7%
125.4%
Earthquake activity compared to U.S. average
5,835%
44.4%
Natural disasters compared to U.S. average
39%
21%
Transportation
San Diego boasts a more expansive system of public transportation that includes buses, trolleys, ferries, and trains. Contrastingly, in New Orleans, traditional streetcars are an iconic symbol of the city and contribute significantly to its public transportation along with buses.
Transport
Type
San Diego
New Orleans
Amtrak stations
1
1
Amtrak stations nearby
2
1
FAA registered aircraft
852
201
FAA registered aircraft manufacturers and dealers
33
2
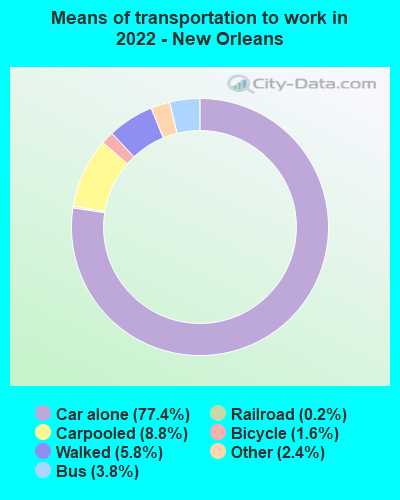
Means of transportation to work
Type
San Diego
New Orleans
Bicycle
0.6%
1.4%
Bus
2%
3.3%
Carpooled
9.4%
9%
Car alone
81.7%
79.9%
Ferryboat
0.1%
0.1%
Motorcycle
0.3%
0.1%
Railroad
0.5%
0.2%
Taxicab
0.1%
0.5%
Walked
3.6%
3.6%
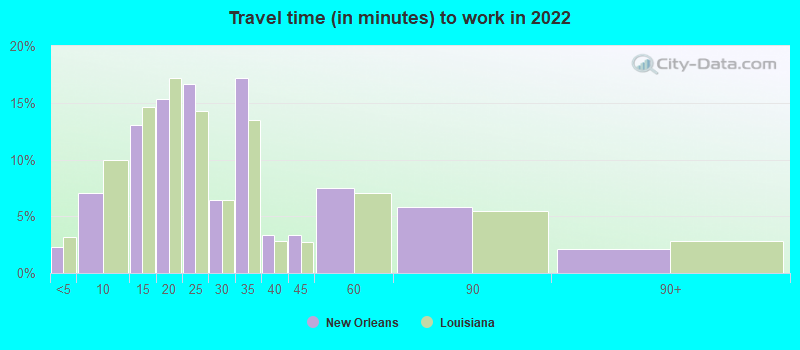
Average travel time to work
Type
San Diego
New Orleans
Average
27.4 min
27.7 min
Other means
22.7 min
23.4 min
Public transportation
45.7 min
42.3 min
Private vehicle occupancy
Type
San Diego
New Orleans
Average
1.2
1.2
Drove alone
89.5%
89.9%
In 2 person carpool
7.6%
8.2%
In 3 person carpool
1.8%
0.8%
In 4 person carpool
0.4%
0.4%
In 5-6 person carpool
0.5%
0.1%
In 7+ person carpool
0.2%
0.6%
How many people usually rode to work in the car, truck or van.
Real Estate
Real estate prices in San Diego are amongst the highest in the country, significantly exceeding those in New Orleans. Median home prices in San Diego are more than double those in New Orleans. Conversely, New Orleans offers more affordability in the housing market, resulting in a lower cost of living.
Neighborhoods
Both cities offer a diverse range of neighborhoods, from the beach neighborhoods of La Jolla and Pacific Beach in San Diego to the historic French Quarter and Garden District in New Orleans. Each city provides a blend of residential areas that include both quiet, suburban-style neighborhoods and vibrant, urban communities.
Houses and residents
Type
San Diego
New Orleans
Houses
555,456
194,701
Average household size (people)
2.6
2.3
Median year apartment built
1980
1966
Median year house/condo built
1977
1960
Length of stay in the house since moving in
14.1 years
15.5 years
Houses occupied
521,000 (93.8%)
158,827 (81.6%)
Houses occupied by owners
251,507 (48.3%)
83,516 (52.6%)
Houses occupied by renters
269,493 (51.7%)
75,311 (47.4%)
Median rent asked for vacant for-rent units
$2,096
$1,126
Median monthly housing costs
$2,044
$1,106
Median price asked for vacant for-sale houses and condos
$957,871
$470,732
Estimated median house or condo value
$768,800
$279,100
Median numbers of rooms
4.6
5.2
Median number of rooms in apartments
3.7
4.4
Median number of rooms in houses and condos
5.9
6.3
Median house price - detached houses
Over $1,000,000
$360,278
Median house price - in 2-unit structures
Over $1,000,000
$499,015
Median house price - in 3-to-4-unit structures
$529,375
$347,348
Median house price - in 5 or more unit structures
$543,091
$400,453
Median house price - mobile homes
$134,064
$25,502
Median house price - Townhouses or other attached units
$696,014
$365,362
Median house price - All housing units
$941,291
$369,282
Median house age
42
61
Renting percentage
51.7%
52.2%
Housing density (houses/condos per square mile)
1,712.6
1,078.3
House value disparities
23.6%
38.2%
Household income disparities
42.3%
53.1%
Median household income for houses/condes with a mortgage
$138,584
$89,566
Median household income for apartments without a mortgage
$97,588
$53,790
Housing units without a mortgage
2,803 (1.6%)
629 (1.3%)
Housing units with both a second mortgage and home equity loan
12,495 (6.9%)
3,326 (6.9%)
Housing units with a mortgage
177,643 (98.4%)
47,733 (98.7%)
Housing units with a home equity loan
694 (0.4%)
296 (0.6%)
Housing units with a second mortgage
16,654 (9.2%)
4,588 (9.5%)
House/condo owner moved in on average (years ago)
11
14
House/condo renter moved in on average (years ago)
1
3
Housing units lacking complete kitchen facilities
0.8%
5.6%
Housing units lacking complete plumbing facilities
0.3%
4.6%
Housing units in structures
Housing units in structures
San Diego
New Orleans
One, detached
43.4%
48.0%
One, attached
9.9%
9.7%
Two
1.9%
15.1%
3 or 4
6.0%
6.9%
5 to 9
9.3%
4.1%
10 to 19
7.4%
3.8%
20 to 49
6.3%
3.9%
50 or more
14.6%
8.1%
Mobile homes
1.0%
0.4%
Median real estate property taxes paid for housing units
Self-employed workers in own not incorporated business
39,709
9,492
State government workers
29,438
9,130
Unpaid family workers
808
527
Industries and Occupations
San Diego is a hub for biotechnology and healthcare, while technology and military sectors also provide substantial employment. In New Orleans, the dominant sectors are hospitality and tourism, healthcare, and shipping, reflective of its thriving port and active cultural scene.
San Diego and New Orleans both have robust healthcare systems. San Diego is a hub for healthcare and biotech, with world-class facilities such as UC San Diego Health. New Orleans, being home to large healthcare employers like Ochsner Health System, also offers significant healthcare services.
Health (county statistics)
Type
San Diego
New Orleans
General health status score of residents in this county from 1 (poor) to 5 (excellent)
Both cities have robust infrastructures, but San Diego, with its well-developed downtown area and extensive freeways, stands out. In New Orleans, post-Katrina rebuilding has been a key infrastructure focus, with many improvements seen particularly in storm resilience structures.
HMDA - Conventional home purchase loans - Applications denied
Year
San Diego
New Orleans
1999
3,865
1,021
2000
2,257
942
2001
1,754
820
2002
2,118
820
2003
5,074
991
2004
7,646
1,379
2005
8,409
1,899
2006
7,551
1,426
2007
5,741
1,245
2008
2,876
683
2009
1,675
378
Culture and Food
Culturally, both cities are rich but different. San Diego's cuisine is influenced by its Mexican heritage, with the city famed for its fish tacos and burritos. New Orleans, by contrast, has a culinary scene deeply rooted in Creole and Cajun traditions, with specialties like gumbo, jambalaya, and beignets. Also, New Orleans' annual Mardi Gras celebration is an iconic cultural event.
Sports Teams
Both cities take pride in their sports teams. San Diego boasts the Padres (MLB) and the Gulls (AHL). However, it lost its NFL franchise, the Chargers, to Los Angeles. New Orleans is home to the Saints (NFL) and the Pelicans (NBA), which enjoy a passionate local following.


 San Diego, CA
 New Orleans, LA