San Diego, CA vs Plano, TX - Advanced U.S. city comparison tool

San Diego, CA vs Plano, TX

San Diego, California, and Plano, Texas, are both vibrant cities with unique characteristics. Known for its stunning beaches and year-round good weather, San Diego offers the classic Southern California lifestyle. Plano, on the other hand, situated in the Dallas-Fort Worth metropolitan area, is noted for its strong economy and prosperity. While considering relocation or a visit, features like crime/safety, weather, cost of living, education, economy, infrastructure, industries, real estate, neighborhoods, transport, taxes, culture/food, sports, geography, and healthcare are crucial. In this comparison, we'll delve into these factors, differentiating San Diego from Plano and assisting you in making an informed decision.
 
 
Distance between San Diego, CA and Plano, TX : 1,181.5 miles

San Diego's population is larger by 379%. Its population has grown by 158,211 people (12.9%) since 2000. The population of Plano has grown by 66,223 people (29.8%) during that time.

Population
Type San Diego Plano
Population 1,381,611 288,253
Female / male percentage 48.8% / 51.2%
48.8%
51.2%
50.3% / 49.7%
50.3%
49.7%
Racial makeup - percentage
Ethnicity San DiegoPlano
White Non-Hispanic 41.9% 47.0%
Hispanic 29.0% 17.9%
Asian 16.9% 22.2%
Black 5.5% 8.7%
Two or more 5.3% 2.9%
Pacific Islander 0.5% 0.0%
American Indian 0.2% 0.1%
Racial makeup - absolute values
Ethnicity San DiegoPlano
White Non-Hispanic 579,373 134,940
Hispanic 400,337 51,247
Asian 233,618 63,652
Black 75,323 24,931
Two or more 73,108 8,242
Pacific Islander 6,302 84
American Indian 2,753 233

Crime and Safety

San Diego has a higher crime rate compared to Plano, with a rate that's higher than the national average. Areas fluctuate with safety varying by neighborhood, similar to any large city. On the other hand, Plano is considered one of the safest cities in America. Its crime rate is significantly lower than the national average, offering peace of mind for residents and tourists alike.

Crime by year per 100,000 residents
Type City-data.com crime indexRobberies per 100,000Murders per 100,000Rapes per 100,000Assaults per 100,000Burglaries per 100,000Theft per 100,000Auto theft per 100,000Arson per 100,000
Year San DiegoPlanoSan DiegoPlanoSan DiegoPlanoSan DiegoPlanoSan DiegoPlanoSan DiegoPlanoSan DiegoPlanoSan DiegoPlanoSan DiegoPlano
2020 197.8 135.9 84.0 39.2 3.9 1.0 33.7 34.7 247.3 80.5 231.2 211.8 1,116.0 1,282.0 344.5 151.3 15.4 3.8
2019 208.3 132.7 93.4 44.2 3.5 1.0 38.9 31.2 226.0 66.5 245.7 215.0 1,278.0 1,306.9 358.7 147.1 8.5 4.8
2018 212.9 135.7 100.2 40.7 2.4 2.1 42.1 28.6 228.4 72.4 261.2 240.1 1,286.6 1,367.7 360.7 130.4 13.0 4.8
2017 207.4 145.4 99.0 41.0 2.5 6.9 39.3 28.2 225.9 76.1 268.0 250.0 1,214.4 1,369.4 360.6 115.7 11.1 7.9
2016 223.5 141.8 98.1 37.8 3.5 1.7 40.5 26.7 235.1 73.2 335.6 312.9 1,276.5 1,456.1 413.1 135.0 16.9 4.9
2015 227.4 140.5 98.4 41.0 2.6 1.4 40.4 32.2 257.1 79.9 366.2 259.4 1,351.9 1,448.9 363.9 95.1 12.4 6.4
2014 210.5 151.0 96.3 56.2 2.3 1.4 27.1 28.8 255.2 78.8 373.7 297.3 1,219.5 1,580.1 365.8 105.1 15.3 8.3
2013 235.0 156.3 107.9 39.5 2.9 1.1 23.4 33.4 258.8 73.6 471.0 343.4 1,425.2 1,738.2 455.3 91.4 13.2 5.8
2012 241.6 153.7 113.3 40.2 3.5 0.4 22.7 20.1 273.5 70.1 440.9 399.9 1,433.6 1,841.7 493.8 115.0 13.7 2.6
2011 229.7 173.3 110.6 53.5 2.9 1.9 22.2 17.0 251.9 91.6 443.5 450.4 1,337.2 1,958.8 475.3 146.6 11.6 1.9
2010 244.5 181.8 125.1 58.5 2.2 1.5 22.9 20.0 279.3 106.2 488.5 476.1 1,375.0 1,967.7 488.7 148.9 11.9 3.8
2009 261.0 193.2 144.9 51.7 3.1 1.5 24.2 16.9 278.9 102.7 509.1 543.0 1,373.4 2,224.4 570.1 172.3 14.1 7.0
2008 315.3 212.2 158.8 54.2 4.3 2.6 29.6 18.1 282.9 152.8 608.9 574.2 1,725.7 2,327.1 839.6 155.4 14.9 6.8
2007 339.8 216.0 166.1 61.6 4.7 0.8 23.5 19.6 307.8 175.9 608.9 531.2 1,844.6 2,372.1 1,048.5 162.5 15.9 16.9
2006 347.3 234.3 170.8 59.9 5.4 1.6 27.5 15.9 300.8 209.6 611.4 540.9 1,904.3 2,576.8 1,052.9 220.9 14.6 26.8
2005 276.1 233.4 146.4 48.1 4.0 0.8 29.6 22.0 339.1 221.7 586.6 546.0 1,934.8 2,698.8 1,111.3 241.3 18.3 11.6
2004 271.0 228.3 128.8 57.3 4.8 2.0 29.1 18.3 365.9 186.1 570.1 547.0 1,964.2 2,729.5 1,012.2 219.9 14.9 15.4
2003 284.3 255.2 127.8 55.4 5.1 2.1 31.9 19.9 414.0 215.9 634.5 631.5 2,022.3 3,000.1 987.4 277.9 18.7 8.7

City-data.com crime index counts serious crimes and violent crime more heavily. It adjusts for the number of visitors and daily workers commuting into cities. (higher means more crime, U.S. average = 301.1)


Crime per year
Type City-data.com crime indexRobberiesMurdersRapesAssaultsBurglariesTheftAuto theftArson
Year San DiegoPlanoSan DiegoPlanoSan DiegoPlanoSan DiegoPlanoSan DiegoPlanoSan DiegoPlanoSan DiegoPlanoSan DiegoPlanoSan DiegoPlano
2019 208.3 132.7 1,346 129 50 3 561 91 3,258 194 3,543 627 18,426 3,811 5,172 429 122 14
2018 212.9 135.7 1,439 118 35 6 605 83 3,281 210 3,752 696 18,482 3,965 5,182 378 187 14
2017 207.4 145.4 1,410 119 35 20 559 82 3,217 221 3,817 726 17,294 3,977 5,135 336 158 23
2016 223.5 141.8 1,387 109 50 5 572 77 3,323 211 4,743 902 18,042 4,197 5,839 389 239 14
2015 227.4 140.5 1,378 116 37 4 566 91 3,601 226 5,129 734 18,933 4,100 5,096 269 174 18
2014 210.5 151.0 1,318 156 32 4 371 80 3,493 219 5,115 826 16,691 4,390 5,006 292 209 23
2013 235.0 156.3 1,456 109 39 3 316 92 3,492 203 6,355 947 19,230 4,794 6,143 252 178 16
2012 241.6 153.7 1,517 110 47 1 304 55 3,661 192 5,902 1,095 19,188 5,043 6,610 315 183 7
2011 229.7 173.3 1,456 142 38 5 293 45 3,317 243 5,840 1,195 17,610 5,197 6,259 389 153 5
2010 244.5 181.8 1,636 152 29 4 300 52 3,651 276 6,387 1,237 17,977 5,113 6,389 387 155 10
2009 261.0 193.2 1,905 141 41 4 318 46 3,667 280 6,693 1,481 18,057 6,067 7,496 470 186 19
2008 315.3 212.2 2,019 144 55 7 376 48 3,597 406 7,743 1,526 21,945 6,184 10,677 413 190 18
2007 339.8 216.0 2,095 160 59 2 296 51 3,882 457 7,679 1,380 23,264 6,162 13,224 422 200 44
2006 347.3 234.3 2,164 154 68 4 348 41 3,811 539 7,746 1,391 24,125 6,627 13,338 568 185 69
2005 276.1 233.4 1,862 120 51 2 376 55 4,314 553 7,462 1,362 24,613 6,732 14,138 602 233 29
2004 271.0 228.3 1,650 141 62 5 373 45 4,689 458 7,305 1,346 25,168 6,716 12,970 541 191 38
2003 284.3 255.2 1,626 134 65 5 406 48 5,269 522 8,076 1,527 25,739 7,254 12,567 672 238 21

City-data.com crime index counts serious crimes and violent crime more heavily. It adjusts for the number of visitors and daily workers commuting into cities. (higher means more crime, U.S. average = 301.1)

Sex Offenders

According to our data, there are 1,333 registered sex offenders living in San Diego and 134 registered sex offenders living in .
The ratio of residents to sex offenders in San Diego is 1,055 to 1; the ratio in Plano is 2,135 to 1.
The number of registered sex offenders compared to the number of residents is larger in San Diego than in Plano.

Cost of Living

San Diego is notable for its high cost of living, primarily influenced by housing costs. Everything from groceries to health care is more expensive than the national average. Plano's cost of living is lower in comparison, although slightly above the national average.

Income Tax

Californians pay a state income tax, with rates varying according to income. In stark contrast, Texas does not impose a state income tax, which can be seen as a significant advantage for residents of Plano.

Property Tax

Property taxes in Texas are amongst the highest in the US, and Plano is no exception. San Diego homeowners, while contending with higher property values, benefit from California's relatively lower property tax rate

Sales Tax

California has a higher sales tax rate (8.25%) compared to Texas (8.25%). However, the total sales tax can be higher in San Diego due to local district taxes. In Plano, there are no additional local taxes, making the total sales tax slightly lower.
Income
Type San Diego Plano
Estimated median household income $93,042 $95,002
Estimated per capita income $48,380 $49,792
Cost of living index (U.S. average is 100) 126.4 96.2

If you make $50,000 in Plano, you will have to make $65,696 in San Diego to maintain the same standard of living.

Geographical Conditions

Geographically, San Diego is coastal with hilly terrain, beautiful beaches, and proximity to the Mexican border. Plano is landlocked, characterized by flat terrain, and is part of the larger Dallas-Fort Worth metropolitan area.
Geographical information
Type San Diego Plano
Land area 324.3 sq. miles 71.6 sq. miles
Population density 4,259.7 people per sq. mile 4,027.8 people per sq. mile
Elevation 40 feet 674 feet
Relative area comparison
San Diego, CA Plano, TX
First ancestry reported - percentage
Ancestry San DiegoPlano
German 4.1% 4.5%
English 3.7% 4.6%
Irish 3.7% 3.0%
Italian 2.7% 1.2%
Polish 0.8% 0.7%
Norwegian 0.6% 0.3%
Swedish 0.6% 0.2%
Russian 0.6% 0.5%
Scottish 0.5% 0.9%
French 0.5% 0.5%
Portuguese 0.5% 0.0%
Ukrainian 0.4% 0.2%
Scotch-Irish 0.4% 0.6%
Dutch 0.3% 0.3%
Welsh 0.2% 0.2%
Hungarian 0.2% 0.1%
Greek 0.2% 0.1%
Czech 0.1% 0.2%
Population origin - absolute values
Ancestry San DiegoPlano
German 31,098 7,776
Irish 28,411 5,186
English 28,257 8,043
Italian 20,762 2,179
Polish 6,306 1,215
Russian 4,825 847
Swedish 4,750 415
Norwegian 4,195 579
French 4,053 939
Portuguese 3,750 83
Scottish 3,500 1,564
Scotch-Irish 3,212 1,099
Ukrainian 3,045 425
Dutch 2,478 448
Greek 1,789 234
Hungarian 1,643 260
Welsh 1,528 298
French Canadian 1,134 290
Danish 874 133
Lithuanian 787 7
Foreign born residents - absolute values
Type Count
Region San DiegoPlano
All 332,864 83,793
Africa 13,482 4,628
Asia 158,944 54,789
Europe 28,086 5,533
Latin America 124,428 19,738
North America 5,332 1,261
Oceania 2,592 154
Foreign born residents - percentage
Type Percentage
Region San DiegoPlano
All 24.1% 27.8%
Africa 1.0% 1.5%
Asia 11.5% 18.2%
Europe 2.0% 1.8%
Latin America 9.0% 6.6%
North America 0.4% 0.4%
Oceania 0.2% 0.1%

Education

Both cities prioritize education; San Diego is home to the prestigious University of California, San Diego, along with various other reputed institutions. Plano's public schools are amongst the highest-rated in Texas, and the city is close to several universities in the Dallas-Fort Worth area.
School enrollment
Type San Diego Plano
Nursery, preschool 17,408 (5.2%) 4,011 (5.8%)
Kindergarten 15,191 (4.5%) 4,698 (6.8%)
Grade 1 to 4 57,255 (17%) 13,161 (19.1%)
Grade 5 to 8 50,659 (15.1%) 14,245 (20.7%)
Grade 9 to 12 61,511 (18.3%) 15,793 (22.9%)
College undergrad 105,968 (31.5%) 13,019 (18.9%)
Graduate or professional 28,062 (8.4%) 3,908 (5.7%)
Students in private schools - absolute values
Type Count
Grade San DiegoPlano
Grades 1 to 8 (elementary and middle school) 12,248 2,465
Grades 9 to 12 (high school) 7,798 1,047
Undergraduate colleges 23,490 2,278
Students in private schools - percentage
Type Percentage
Grade San DiegoPlano
Grades 1 to 8 (elementary and middle school) 11.4% 9.0%
Grades 9 to 12 (high school) 12.7% 6.6%
Undergraduate colleges 22.2% 17.5%
Educational attainment
Type San Diego Plano
Less than high school 10.1% 7.3%
High school or equiv. 15.7% 12.1%
Less than 1 year of college 5.2% 3.7%
1 or more years of college 12.7% 12.2%
Associate degree 7.4% 5.5%
Bachelor's degree 28.5% 32.1%
Master's degree 13.1% 22.7%
Profess. school degree 3.4% 2.2%
Doctorate degree 3.8% 2.1%
Education level (25-year-olds and older)
Type San Diego Plano
Bachelor's degree or higher 48.8% 59.1%
Graduate or professional degree 20.3% 27%
High school or higher 89.9% 92.7%

Work and Economy

San Diego's economy emphasizes healthcare, military defense, international trade, and tourism. In contrast, Plano's economy leans more towards the high-tech, retail, and financial services sectors. Both cities have a healthy job market with plenty of opportunities.

Biggest Employers

San Diego's biggest employers include the University of California, San Diego (UCSD), the Navy, and Sharp Healthcare. Plano's employment scene is dominated by large corporations such as Capital One Finance, Toyota Motor North America, and JCPenney.
Employment and residency - absolute values
Kind San DiegoPlano
Work and live in this city 450,898 45,280
Work and live in this county 704,831 108,108
Workers who work outside the city they live in 772,502 176,750
Workers who work outside the county they live in 9,400 40,880
Working at home 183,424 28,067
Not working at home 530,807 128,682
Daytime population change due to commuting 141,927 N/A
Employment and residency - percentage
Kind San DiegoPlano
Work and live in this city 77.7% 38.1%
Work and live in this county 98.7% 72.6%
Workers who work outside the city they live in 22.3% 61.9%
Workers who work outside the county they live in 1.3% 27.4%
Working at home 25.7% 17.9%
Not working at home 74.3% 82.1%
Daytime population change due to commuting 11.6% N/A
Geographical mobility: all
Type all
Mobility San DiegoPlano
Same house 1 year ago 83.2% 85.8%
Moved from abroad 0.9% 0.7%
Moved within same county 10.3% 5.8%
Moved from different state 3.1% 2.8%
Moved within same state 2.4% 4.9%
Geographical mobility: Asian
Type Asian
Mobility San DiegoPlano
Same house 1 year ago 84.1% 82.9%
Moved from abroad 1.1% 1.8%
Moved within same county 10.2% 5.4%
Moved from different state 2.2% 6.5%
Moved within same state 2.4% 3.4%
Geographical mobility: Black
Type Black
Mobility San DiegoPlano
Same house 1 year ago 84.6% 79.5%
Moved from abroad 0.7% 0%
Moved within same county 10.0% 7.7%
Moved from different state 3.3% 3.8%
Moved within same state 1.3% 9.0%
Geographical mobility: White
Type White
Mobility San DiegoPlano
Same house 1 year ago 80.8% 86.3%
Moved from abroad 1.1% 0.6%
Moved within same county 10.7% 6.4%
Moved from different state 4.1% 2.3%
Moved within same state 3.3% 4.5%
Building permits
Type Average valueCount
City San DiegoPlanoSan DiegoPlano
1997 $183,500 $173,600 2,814 3,131
1998 $194,000 $178,300 2,819 2,923
1999 $199,900 $185,000 2,233 2,310
2000 $261,300 $200,600 2,014 1,962
2001 $254,400 $179,200 2,209 1,692
2002 $205,900 $186,400 2,588 1,090
2003 $190,500 $190,800 1,926 855
2004 $167,100 $201,900 1,301 751
2005 $175,800 $192,500 1,059 803
2006 $184,800 $212,000 815 867
2007 $196,200 $221,800 748 546
2008 $323,700 $229,500 641 368
2009 $289,000 $262,100 374 226
2010 $255,900 $239,000 557 311
2011 $349,000 $211,500 451 349
2012 $372,900 $168,700 535 673
2013 $366,800 $279,100 821 410
2014 $345,900 $334,300 712 524
2015 $329,400 $317,000 1,325 460
2016 $303,400 $282,100 823 491
2017 $341,000 $420,400 1,138 315
2018 $310,800 $394,800 774 244
2019 $351,600 $304,500 580 197
2020 $291,000 $234,100 445 291
2021 $305,000 $238,200 539 321

There were 539 building permits issued in San Diego in 2012 (88 more than in 2011) compared to 321 building permits issued in Plano in 2012 (28 less than in 2011).

In San Diego (San Diego County), 52.6% voted for Democrats and 45.0% for Republicans in 2012 Presidential Election. In Plano (Collin County), 33.6% voted for Democrats and 65.2% for Republicans.

Elections
Type DemocratsRepublicansOther
Year San DiegoPlanoSan DiegoPlanoSan DiegoPlano
2020 60.3% 47.1% 37.5% 51.4% 2.1% 1.5%
2016 56.3% 39.0% 36.6% 55.7% 7.1% 5.4%
2012 52.6% 33.6% 45.0% 65.2% 2.4% 1.2%
2008 54.2% 36.7% 44.0% 62.3% 1.8% 1.0%
2004 46.7% 28.2% 52.9% 71.3% 0.4% 0.6%
2000 45.8% 24.5% 49.8% 73.2% 4.5% 2.3%
1996 44.1% 28.5% 45.6% 63.0% 10.3% 8.5%
Breakdown of population affiliated with a religious congregation
Type AdherentsCongregations
Religion San DiegoPlanoSan DiegoPlano
CATHOLIC CHURCH 25.9% 14.2% 6.7% 1.6%
SOUTHERN BAPTIST CONVENTION 1.1% 10.1% 12.0% 29.1%
MUSLIM ESTIMATE 0.7% 2.9% 1.1% 1.9%
SEVENTH DAY ADVENTIST CHURCH 0.5% 0.1% 2.0% 0.8%
EPISCOPAL CHURCH 0.4% 0.2% 2.0% 1.0%
EVANGELICAL LUTHERAN CHURCH IN AMERICA 0.4% 0.3% 2.0% 1.0%
LUTHERAN CHURCH 0.4% 0.8% 2.2% 1.4%

Weather

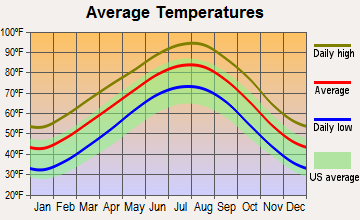
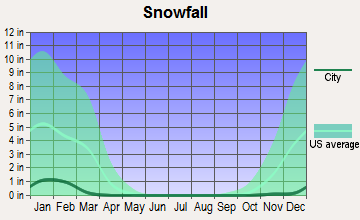
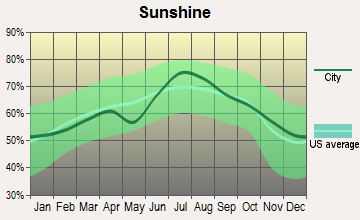
San Diego boasts excellent weather, with moderate temperatures year-round and little distinct seasonal change. It's perfect for outdoor enthusiasts who enjoy sunshine and mild weather. Plano, in contrast, experiences all four seasons, with hot summers and chilly winters. Besides, it also has a higher chance of experiencing severe weather events like tornadoes and thunderstorms.
Weather and climate
Type San Diego Plano
Temperature - Average 64.4°F 64.2°F
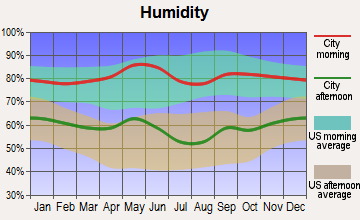
Humidity - Average morning or afternoon humidity 74% 71.3%
Humidity - Differences between morning and afternoon humidity 22% 34%
Humidity - Maximum monthly morning or afternoon humidity 80% 82%
Humidity - Minimum monthly morning or afternoon humidity 58% 48%
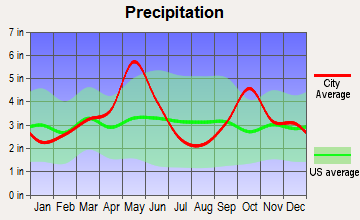
Precipitation - Yearly average 11 in 40.2 in
Snowfall - Yearly average 0 in 4.2 in
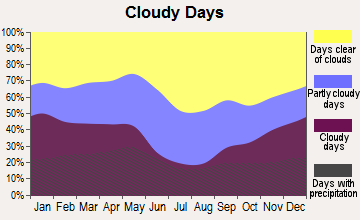
Clouds - Number of days clear of clouds 24.3% 22.8%
Sunshine amount - Average 74.8% 66.6%
Sunshine amount - Differences during a year 19% 20%
Sunshine amount - Maximum monthly 75% 74%
Sunshine amount - Minimum monthly 56% 54%
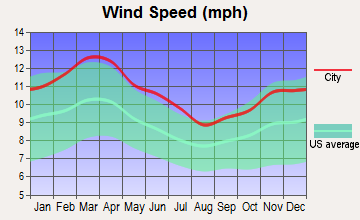
Wind speed - Average 6.9 mph 10.3 mph

Average climate in San Diego, California

Chicago, Illinois average temperatures Chicago, Illinois average precipitation Chicago, Illinois humidity Chicago, Illinois wind speed Chicago, Illinois snowfall Chicago, Illinois sunshine Chicago, Illinois clear and cloudy days
 

Average climate in Plano, Texas

Chicago, Illinois average temperatures Chicago, Illinois average precipitation Chicago, Illinois humidity Chicago, Illinois wind speed Chicago, Illinois snowfall Chicago, Illinois sunshine Chicago, Illinois clear and cloudy days
 

Air pollution
Type AQICONO2OZONEPBPM10PM25SO2
Year San DiegoPlanoSan Diego San DiegoPlanoSan DiegoPlanoSan DiegoPlanoSan Diego San DiegoPlanoSan DiegoPlano
2018 101 85 0.53 N/A 11.2 5.8 32.6 30.1 0.007 N/A N/A N/A 10.5 9.7 0.1 0.4
2017 115 84 0.63 N/A 12.7 5.8 32.7 31.4 0.007 N/A N/A N/A 10.8 9.1 0.1 0.3
2016 105 77 0.46 N/A 13.0 6.4 30.4 29.9 0.006 N/A N/A N/A 11.4 8.4 0.1 0.2
2015 111 84 0.43 N/A 13.2 7.2 29.9 30.0 0.005 N/A N/A N/A 11.9 8.9 0.1 0.3
2014 105 83 0.44 N/A 11.6 6.1 31.1 30.9 0.007 N/A N/A N/A 11.1 9.9 0.1 0.3
2013 138 95 0.50 N/A 12.4 7.0 27.4 32.2 0.019 N/A N/A N/A 12.3 13.0 0.2 0.2
2012 110 112 0.53 N/A 12.7 8.5 28.0 34.3 0.019 N/A N/A N/A 13.6 12.0 0.2 0.3
2011 122 98 0.51 N/A 13.5 9.1 29.0 33.9 0.034 N/A N/A N/A 14.0 11.9 1.5 0.6
2010 109 78 0.52 N/A 14.0 9.7 29.3 30.8 0.019 N/A N/A N/A 13.9 N/A 1.0 0.7
2009 121 86 0.64 N/A 15.6 9.6 26.9 31.5 0.014 N/A N/A N/A 15.1 N/A 2.7 0.5
2008 127 82 0.71 N/A 16.1 9.9 28.4 32.3 N/A 0.121 67.3 N/A N/A N/A 2.6 0.5
2007 157 89 0.71 N/A 16.4 10.3 28.0 29.7 0.012 0.070 64.6 N/A N/A N/A 2.8 0.3
2006 123 103 0.81 N/A 18.9 10.5 27.1 33.7 0.056 0.106 64.8 N/A N/A N/A 3.4 0.7
2005 112 105 0.90 N/A 19.2 13.2 24.4 32.6 0.049 0.142 N/A N/A N/A 11.0 3.7 0.9
2004 120 92 0.93 N/A 18.4 11.8 25.9 29.2 0.055 0.099 N/A N/A N/A N/A 4.6 0.8
2003 124 100 0.88 N/A 19.4 13.9 25.4 30.3 0.049 0.121 N/A N/A N/A N/A 3.8 1.0
2002 125 96 0.86 N/A 20.9 14.3 25.9 29.1 0.039 0.080 N/A N/A N/A N/A 3.6 0.4
2001 132 99 0.93 N/A 20.4 12.8 26.5 30.6 0.048 0.069 N/A N/A N/A N/A 3.4 1.0
2000 134 107 1.02 N/A 22.3 14.5 23.8 31.7 0.054 0.092 N/A N/A N/A N/A 3.6 1.1
Natural disasters
Type San Diego Plano
Tornado activity compared to U.S. average 6.7% 252.9%
Earthquake activity compared to U.S. average 5,835% 596.9%
Natural disasters compared to U.S. average 39% 14%

Transportation

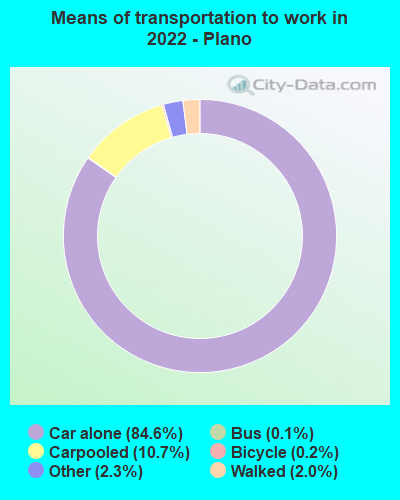
San Diego is equipped with bus and light rail services, and is bicycle-friendly. Yet, many residents prefer driving. Traffic can be heavy, especially during peak hours. Plano citizens predominantly rely on private vehicles, but the city does offer bus and light rail services.
Transport
Type San Diego Plano
Amtrak stations 1 0
Amtrak stations nearby 2 1
FAA registered aircraft 852 266
FAA registered aircraft manufacturers and dealers 33 11
Means of transportation to work
Type San Diego Plano
Bicycle 0.6% 0.1%
Bus 2% 0.4%
Carpooled 9.4% 7.8%
Car alone 81.7% 89.2%
Ferryboat 0.1% 0%
Motorcycle 0.3% 0.1%
Railroad 0.5% 0%
Walked 3.6% 1.2%
Means of transportation to work
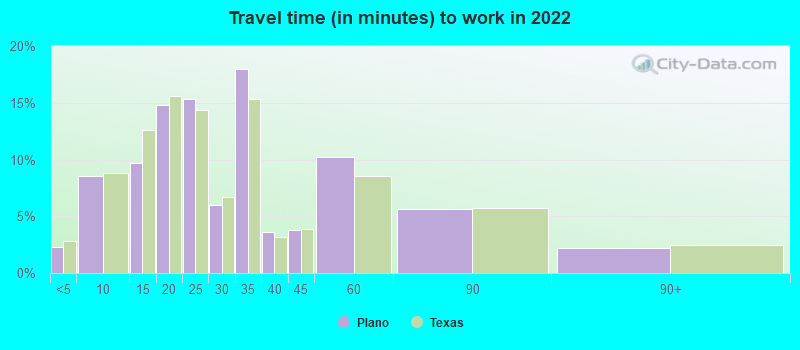
Average travel time to work
Type San Diego Plano
Average 27.4 min 28.8 min
Other means 22.7 min 28.4 min
Public transportation 45.7 min 59 min
Travel time to work
Time leaving to work
Travel time to work
Time leaving to work
Private vehicle occupancy
Type San Diego Plano
Average 1.2 1.1
Drove alone 89.5% 89.9%
In 2 person carpool 7.6% 8.8%
In 3 person carpool 1.8% 0.8%
In 4 person carpool 0.4% 0.2%
In 5-6 person carpool 0.5% 0.2%
In 7+ person carpool 0.2% 0%

How many people usually rode to work in the car, truck or van.

Real Estate

San Diego's real estate market is highly competitive, with high home prices. Apartments in downtown San Diego can be expensive, but suburbs offer more affordable options. Plano's real estate market is more reasonable, with a wide array of housing options across a variety of price points.

Neighborhoods

Each city showcases unique neighborhoods. In San Diego, neighborhoods range from beachfront locales like La Jolla and Mission Beach to urban areas such as Gaslamp Quarter. Plano features family-friendly neighborhoods such as Willow Bend and Haggard Park.
Houses and residents
Type San Diego Plano
Houses 555,456 114,797
Average household size (people) 2.6 2.6
Median year apartment built 1980 1996
Median year house/condo built 1977 1990
Length of stay in the house since moving in 14.1 years 13 years
Houses occupied 521,000 (93.8%) 108,472 (94.5%)
Houses occupied by owners 251,507 (48.3%) 60,883 (56.1%)
Houses occupied by renters 269,493 (51.7%) 47,589 (43.9%)
Median rent asked for vacant for-rent units $2,096 $1,491
Median monthly housing costs $2,044 $1,599
Median price asked for vacant for-sale houses and condos $957,871 $1,044,402
Estimated median house or condo value $768,800 $387,200
Median numbers of rooms 4.6 6.1
Median number of rooms in apartments 3.7 4
Median number of rooms in houses and condos 5.9 7.6
Median house price - detached houses Over $1,000,000 $447,315
Median house price - in 2-unit structures Over $1,000,000 $154,744
Median house price - in 3-to-4-unit structures $529,375 $260,615
Median house price - in 5 or more unit structures $543,091 $210,357
Median house price - mobile homes $134,064 $112,806
Median house price - Townhouses or other attached units $696,014 $325,999
Median house price - All housing units $941,291 $437,302
Median house age 42 28
Renting percentage 51.7% 37%
Housing density (houses/condos per square mile) 1,712.6 1,604.1
House value disparities 23.6% 23.4%
Household income disparities 42.3% 41.5%
Median household income for houses/condes with a mortgage $138,584 $134,911
Median household income for apartments without a mortgage $97,588 $110,429
Housing units without a mortgage 2,803 (1.6%) 744 (2%)
Housing units with both a second mortgage and home equity loan 12,495 (6.9%) 1,681 (4.4%)
Housing units with a mortgage 177,643 (98.4%) 37,102 (98%)
Housing units with a home equity loan 694 (0.4%) 86 (0.2%)
Housing units with a second mortgage 16,654 (9.2%) 2,508 (6.6%)
House/condo owner moved in on average (years ago) 11 13
House/condo renter moved in on average (years ago) 1 1
Housing units lacking complete kitchen facilities 0.8% 1.9%
Housing units lacking complete plumbing facilities 0.3% 0%
Housing units in structures
Housing units in structures San DiegoPlano
One, detached 43.4% 60.2%
One, attached 9.9% 3.5%
Two 1.9% 0.8%
3 or 4 6.0% 3.0%
5 to 9 9.3% 7.3%
10 to 19 7.4% 9.1%
20 to 49 6.3% 3.2%
50 or more 14.6% 12.1%
Mobile homes 1.0% 0.8%
Median real estate property taxes paid for housing units
Type San Diego Plano
With mortgages $5,987 (0.8%) $6,222 (1.6%)
With no mortgages $3,791 (0.5%) $5,837 (1.5%)
Marital status
Type San Diego Plano
Divorced 8.7% 9.3%
Never married 40.5% 29%
Now married 45.1% 57.1%
Separated 1.9% 0.9%
Widowed 3.9% 3.7%
Class of workers - percentage
Class of Workers San DiegoPlano
Employee of private company 66.4% 74.9%
Private not-for-profit wage and salary workers 9.8% 5.3%
Local government workers 6.4% 6.1%
Self-employed workers in own not incorporated business 5.8% 5.0%
State government workers 4.3% 2.7%
Self-employed in own incorporated business 3.9% 4.5%
Federal government workers 3.5% 1.3%
Unpaid family workers 0.1% 0.0%
Class of workers - absolute values
Class of Workers San DiegoPlano
Employee of private company 456,519 113,123
Federal government workers 23,728 1,937
Local government workers 43,803 9,277
Private not-for-profit wage and salary workers 67,149 8,056
Self-employed in own incorporated business 26,516 6,854
Self-employed workers in own not incorporated business 39,709 7,541
State government workers 29,438 4,098
Unpaid family workers 808 57

Industries and Occupations

San Diego's top industries include defense/military, tourism, international trade, and research. Many residents work in these sectors. In Plano, high-tech, financial services, and retail rule, with companies like Capital One, Toyota, and JCPenney providing many local jobs.
Most common male industries
Industry San DiegoPlano
Professional, scientific, and technical services 17.2% 20.4%
Manufacturing 12.1% 8.1%
Retail trade 9.3% 10.0%
Construction 8.2% 8.0%
Health care and social assistance 7.7% 5.4%
Educational services 6.5% 5.0%
Accommodation and food services 6.3% 8.3%
Transportation and warehousing 5.5% 4.1%
Administrative and support and waste management services 4.5% 4.2%
Public administration 4.5% 2.1%
Finance and insurance 4.1% 9.4%
Other services, except public administration 3.2% 3.9%
Wholesale trade 2.5% 3.4%
Information 2.4% 3.9%
Arts, entertainment, and recreation 2.4% 1.4%
Real estate and rental and leasing 2.4% 1.1%
Utilities 0.8% 0.9%
Management of companies and enterprises 0.2% 0.1%
Agriculture, forestry, fishing and hunting 0.2% 0.1%
Mining, quarrying, and oil and gas extraction 0.0% 0.2%
Most common female industries
Industry San DiegoPlano
Health care and social assistance 20.4% 15.7%
Professional, scientific, and technical services 13.9% 11.4%
Educational services 12.5% 11.7%
Retail trade 9.9% 10.2%
Accommodation and food services 7.2% 6.2%
Manufacturing 6.4% 4.8%
Other services, except public administration 5.2% 6.2%
Finance and insurance 5.1% 12.1%
Public administration 4.9% 2.9%
Administrative and support and waste management services 3.6% 4.4%
Arts, entertainment, and recreation 2.1% 2.0%
Real estate and rental and leasing 2.0% 2.7%
Transportation and warehousing 1.9% 1.3%
Information 1.7% 3.6%
Wholesale trade 1.3% 1.0%
Construction 1.1% 2.5%
Utilities 0.4% 0.4%
Agriculture, forestry, fishing and hunting 0.3% 0.1%
Management of companies and enterprises 0.2% 0.6%
Mining, quarrying, and oil and gas extraction 0.0% 0.3%
Most common male occupations
Occupation San DiegoPlano
Management occupations 13.0% 17.7%
Computer and mathematical occupations 8.1% 18.1%
Sales and related occupations 7.9% 10.6%
Business and financial operations occupations 7.1% 7.6%
Architecture and engineering occupations 6.6% 5.2%
Office and administrative support occupations 6.2% 4.1%
Construction and extraction occupations 5.9% 4.9%
Food preparation and serving related occupations 4.9% 6.5%
Material moving occupations 4.3% 1.8%
Life, physical, and social science occupations 3.9% 0.5%
Educational instruction, and library occupations 3.9% 3.3%
Production occupations 3.9% 2.7%
Transportation occupations 3.5% 2.3%
Installation, maintenance, and repair occupations 3.5% 3.6%
Building and grounds cleaning and maintenance occupations 3.1% 2.1%
Arts, design, entertainment, sports, and media occupations 2.8% 2.0%
Health diagnosing and treating practitioners and other technical occupations 2.6% 1.9%
Firefighting and prevention, and other protective service workers including supervisors 1.9% 1.2%
Healthcare support occupations 1.5% 0.3%
Legal occupations 1.3% 0.6%
Most common female occupations
Occupation San DiegoPlano
Office and administrative support occupations 13.1% 15.2%
Management occupations 11.5% 15.0%
Sales and related occupations 9.9% 10.0%
Business and financial operations occupations 8.5% 10.9%
Educational instruction, and library occupations 8.3% 8.6%
Health diagnosing and treating practitioners and other technical occupations 7.3% 6.7%
Food preparation and serving related occupations 5.2% 3.7%
Healthcare support occupations 4.8% 2.6%
Personal care and service occupations 4.4% 3.9%
Life, physical, and social science occupations 3.5% 0.9%
Computer and mathematical occupations 3.3% 5.6%
Health technologists and technicians 3.2% 2.2%
Arts, design, entertainment, sports, and media occupations 2.5% 2.0%
Building and grounds cleaning and maintenance occupations 2.4% 1.7%
Production occupations 2.4% 2.3%
Legal occupations 2.2% 2.4%
Community and social service occupations 2.1% 2.3%
Architecture and engineering occupations 2.0% 1.6%
Material moving occupations 1.6% 0.9%
Food environment data per 10,000 residents
Food environment statistics San DiegoPlano
Number of convenience stores (no gas) 1.7 2.9
Number of convenience stores (with gas) 0.8 0.7
Number of full-service restaurants 7.6 6.5
Number of grocery stores 1.9 1.1
Number of supercenters and club stores 0.1 0.2
Food environment - absolute values
Food environment statistics San DiegoPlano
Number of convenience stores (no gas) 487 215
Number of convenience stores (with gas) 227 53
Number of full-service restaurants 2,238 478
Number of grocery stores 574 77
Number of supercenters and club stores 17 13
Obesity and diabetes
Food environment statistics rate San DiegoPlano
Adult diabetes rate 6.5% 7.3%
Adult obesity rate 22.2% 24.0%
Low-income preschool obesity rate 16.0% 15.3%

Health Care

San Diego is renowned for its high-quality healthcare and numerous medical centers. Plano also offers exceptional healthcare services, with Texas Health Plano and Medical City Plano among the top facilities.

Fatal vehicle accidents per 100,000 residents
Type Total count per 100,000Drunk per 100,000Fatal count per 100,000Pedestrian count per 100,000Person count per 100,000Vehicle count per 100,000
Year San DiegoPlanoSan DiegoPlanoSan DiegoPlanoSan DiegoPlanoSan DiegoPlanoSan DiegoPlano
2021 8.0 3.8 0.0 0.0 8.6 3.8 4.6 0.3 14.3 9.0 11.9 7.6
2020 7.1 5.2 1.7 1.0 7.7 6.6 2.8 1.0 15.2 12.2 10.9 8.4
2019 6.0 3.5 0.8 0.0 6.3 3.5 3.5 0.7 11.1 9.7 8.4 6.3
2018 6.7 3.1 1.3 1.4 7.0 3.1 3.4 0.7 16.0 7.3 11.7 5.2
2017 5.0 5.6 1.1 1.0 5.4 6.9 2.3 0.7 9.6 19.8 8.0 12.5
2016 6.4 3.1 2.3 1.7 7.0 4.2 3.8 0.0 13.2 10.8 9.8 5.9
2015 6.6 4.6 2.1 1.1 7.0 4.9 2.6 0.7 13.0 11.3 9.4 8.1
2014 5.6 2.9 1.0 1.1 5.8 2.9 2.8 0.7 11.2 7.5 9.1 5.7
2013 6.0 3.3 1.7 1.8 6.1 3.3 2.7 0.7 13.4 5.8 10.5 5.1
2012 5.2 4.0 1.6 1.8 5.5 4.0 2.2 0.0 11.1 10.7 8.1 6.6
2011 4.8 3.7 1.3 0.7 4.9 3.7 2.3 1.1 9.0 8.2 7.2 6.3
2010 5.1 3.8 1.5 2.7 5.7 4.2 2.1 0.4 10.4 7.3 8.2 6.2
2009 5.7 4.0 2.1 1.1 5.9 4.4 2.1 1.1 14.9 9.5 9.1 6.9
2008 6.3 2.2 2.5 0.4 6.6 3.7 2.1 0.0 15.4 9.7 9.8 5.2
2007 6.6 3.8 3.1 2.3 7.3 3.8 2.4 0.4 17.3 8.4 9.7 6.9
2006 7.3 3.5 2.2 1.6 7.9 3.5 2.2 0.0 17.5 10.2 10.7 7.0
2005 8.0 7.2 3.5 3.2 8.8 7.2 1.9 0.4 23.2 15.2 13.9 11.2
2004 7.8 4.5 3.0 1.6 8.0 4.5 3.1 0.8 17.8 13.0 11.1 8.1
2003 7.7 5.0 3.5 3.3 8.1 5.0 3.3 0.0 19.5 11.2 11.2 7.0
2002 7.0 4.2 2.9 1.3 7.6 4.6 3.8 2.1 17.2 9.2 9.4 6.3
2001 6.4 6.0 2.2 1.7 6.6 6.4 2.3 2.1 18.4 16.6 9.1 11.9
2000 7.8 5.9 2.9 0.9 8.6 5.9 3.1 1.4 22.3 20.7 12.3 9.5
1999 9.3 3.0 3.3 0.4 9.7 3.4 3.6 0.4 27.5 7.7 13.3 4.3
1998 6.8 5.0 2.2 0.9 7.3 5.0 2.8 0.5 18.9 18.6 10.1 10.9
1997 6.3 1.9 1.8 1.0 6.9 2.4 2.6 1.0 19.3 5.3 9.9 3.4
1996 7.0 3.6 2.9 1.0 7.8 3.6 3.0 0.0 18.8 9.9 9.8 7.3
1995 8.2 6.7 2.3 3.4 9.1 6.7 3.6 0.6 23.1 24.6 11.9 16.2
1994 9.8 7.2 2.9 2.4 10.2 7.2 5.2 0.6 27.0 22.8 13.4 12.0
1993 10.8 2.6 3.5 1.3 11.2 2.6 4.2 0.0 29.2 8.3 16.3 3.8
1992 9.1 7.5 2.2 4.8 9.6 7.5 4.7 1.4 26.5 21.9 13.1 10.3
1991 11.9 1.5 3.2 0.7 12.6 1.5 7.3 0.0 37.0 3.6 16.6 2.2
1990 12.6 3.1 4.6 1.5 13.0 3.9 0.0 0.0 35.3 8.5 17.7 3.9
1989 16.2 4.1 6.1 0.8 17.0 4.1 0.0 0.0 43.8 8.1 22.0 5.7
1988 17.0 10.2 5.3 2.6 17.5 10.2 0.0 0.0 46.7 27.2 25.0 14.5
1987 16.0 8.9 6.0 6.3 16.9 12.5 0.0 0.0 43.6 30.4 23.0 14.3
1986 13.0 11.3 5.8 0.9 13.6 11.3 0.0 0.0 33.9 31.1 18.5 18.8
1985 14.7 11.9 6.3 6.0 15.1 12.9 0.0 0.0 36.1 25.9 20.1 16.9
1984 14.1 13.7 7.8 8.4 15.1 16.9 0.0 0.0 36.8 47.4 19.8 19.0
1983 12.7 13.4 6.1 2.2 13.0 16.8 0.0 0.0 30.0 31.4 18.0 17.9
1982 11.7 12.0 5.6 3.6 12.9 15.5 0.0 0.0 29.5 31.1 16.3 17.9
1981 15.0 10.3 8.7 6.4 16.2 12.8 0.0 0.0 38.7 20.5 23.0 10.3
1980 16.1 4.1 8.0 1.4 17.0 4.1 0.0 0.0 36.2 11.1 22.0 4.1
1979 17.0 6.0 8.2 1.5 18.1 6.0 0.0 0.0 38.0 7.5 23.3 6.0
1978 17.4 11.4 8.8 3.3 18.3 13.0 0.0 0.0 41.1 21.2 25.5 13.0
1977 15.1 5.4 8.4 0.0 17.5 5.4 0.0 0.0 37.7 8.9 21.5 5.4
1976 9.8 0.0 3.7 0.0 9.9 0.0 0.0 0.0 21.6 0.0 12.2 0.0
1975 10.0 0.0 3.8 0.0 10.2 0.0 0.0 0.0 22.1 0.0 12.5 0.0

Fatal vehicle accidents
Type Total countDrunkFatal countPedestrian countPerson countVehicle count
Year San DiegoPlanoSan DiegoPlanoSan DiegoPlanoSan DiegoPlanoSan DiegoPlanoSan DiegoPlano
1975 79 0 30 0 80 0 0 0 174 0 98 0
1976 79 0 30 0 80 0 0 0 174 0 98 0
1977 124 3 69 0 144 3 0 0 310 5 177 3
1978 146 7 74 2 154 8 0 0 345 13 214 8
1979 146 4 70 1 155 4 0 0 326 5 200 4
1980 141 3 70 1 149 3 0 0 317 8 193 3
1981 135 8 78 5 146 10 0 0 348 16 207 8
1982 108 10 52 3 119 13 0 0 272 26 150 15
1983 120 12 58 2 123 15 0 0 284 28 170 16
1984 137 13 76 8 146 16 0 0 357 45 192 18
1985 146 12 63 6 150 13 0 0 358 26 200 17
1986 132 12 59 1 138 12 0 0 345 33 188 20
1987 166 10 62 7 176 14 0 0 453 34 239 16
1988 181 12 56 3 186 12 0 0 497 32 266 17
1989 176 5 66 1 185 5 0 0 476 10 239 7
1990 141 4 51 2 145 5 0 0 395 11 198 5
1991 134 2 36 1 142 2 82 0 418 5 187 3
1992 105 11 25 7 111 11 54 2 305 32 151 15
1993 124 4 40 2 129 4 48 0 337 13 188 6
1994 113 12 34 4 118 12 60 1 313 38 155 20
1995 96 12 27 6 106 12 42 1 269 44 139 29
1996 83 7 34 2 92 7 35 0 222 19 115 14
1997 75 4 22 2 82 5 31 2 231 11 118 7
1998 82 11 27 2 88 11 34 1 229 41 122 24
1999 115 7 41 1 120 8 45 1 341 18 165 10
2000 95 13 36 2 105 13 38 3 273 46 151 21
2001 79 14 27 4 82 15 29 5 227 39 113 28
2002 88 10 36 3 95 11 47 5 215 22 117 15
2003 97 12 44 8 102 12 42 0 246 27 142 17
2004 99 11 38 4 102 11 40 2 227 32 141 20
2005 103 18 45 8 113 18 25 1 298 38 178 28
2006 94 9 28 4 102 9 28 0 226 26 138 18
2007 85 10 40 6 95 10 31 1 225 22 126 18
2008 82 6 33 1 86 10 28 0 201 26 128 14
2009 74 11 28 3 77 12 27 3 195 26 119 19
2010 67 10 20 7 74 11 28 1 136 19 107 16
2011 63 10 17 2 65 10 30 3 120 22 96 17
2012 70 11 21 5 73 11 30 0 148 29 108 18
2013 82 9 23 5 83 9 36 2 182 16 143 14
2014 77 8 14 3 80 8 39 2 154 21 126 16
2015 91 13 29 3 97 14 36 2 181 32 131 23
2016 90 9 32 5 98 12 53 0 185 31 137 17
2017 71 16 16 3 76 20 32 2 135 57 113 36
2018 95 9 19 4 99 9 48 2 227 21 166 15
2019 85 10 11 0 89 10 49 2 158 28 119 18
2020 98 15 23 3 107 19 39 3 210 35 151 24
2021 110 11 0 0 119 11 63 1 198 26 164 22
Police full-time law enforcement employees
Year San DiegoPlano
2021 2,394 591
2020 2,424 557
2019 2,387 585
2018 2,332 585
2017 2,282 0
2016 2,522 512
2015 2,545 570
2014 2,520 570
2013 2,511 569
2012 2,481 480
2011 2,455 489
2010 2,516 495
2009 2,647 477
2008 2,775 501
2007 2,675 485
2006 2,701 483
2005 2,823 468
2004 2,765 453
2003 2,823 459
Police full-time law enforcement employees (per 1,000 residents)
Year San DiegoPlano
2021 1.7 2.0
2020 1.7 1.9
2019 1.7 2.0
2018 1.6 2.0
2017 1.6 0.0
2016 1.8 1.8
2015 1.8 2.0
2014 1.8 2.1
2013 1.9 2.1
2012 1.9 1.8
2011 1.9 1.8
2010 1.9 1.9
2009 2.0 1.7
2008 2.2 1.9
2007 2.1 1.9
2006 2.1 1.9
2005 2.2 1.9
2004 2.2 1.8
2003 2.2 1.9
Local government: full-time employees
Job San DiegoPlano
Airports 22 0
Financial administration 363 69
Firefighters 927 381
Fire - other 232 20
Judicial and legal 356 46
Local libraries 236 125
Other and unallocable 881 359
Other government administration 1,359 121
Parks and recreation 1,000 191
Police - other 521 241
Police protection - officers 1,841 399
Sewerage 576 35
Solid waste management 373 93
Streets and highways 389 93
Totals for government 10,062 2,279
Water supply 986 73
Local government: part-time employees
Job San DiegoPlano
Financial administration 5 1
Fire - other 70 1
Judicial and legal 23 1
Local libraries 415 64
Other and unallocable 31 21
Other government administration 59 18
Parks and recreation 659 376
Police - other 164 69
Police protection - officers 13 0
Sewerage 16 0
Solid waste management 2 9
Streets and highways 14 0
Totals for government 1,551 560
Water supply 80 0
Place of birth - Foreign born
Residents San DiegoPlano
All residents 24.1% 29.3%
American Indian / Alaska Native residents 24.9% 18.7%
Asian residents 58.4% 70.5%
Black or African American residents 13.4% 19.3%
Native Hawaiian / Pacific Islander residents 19.5% 15.1%
Other race residents 36.3% 45.8%
Two or more races residents 19.8% 27.3%
White residents 10.8% 10.9%
White alone, not Hispanic / Latino residents 9.6% 9.2%
Place of birth - Native, outside of US
Residents San DiegoPlano
All residents 2.4% 1.4%
American Indian / Alaska Native residents 1.5% 0.7%
Asian residents 2.7% 0.8%
Black or African American residents 3.4% 0.3%
Native Hawaiian / Pacific Islander residents 19.3% 39.9%
Other race residents 2.6% 1.7%
Two or more races residents 3.8% 3.5%
White residents 1.8% 1.4%
White alone, not Hispanic / Latino residents 1.4% 1.4%
Place of birth - Born in state of residence
Residents San DiegoPlano
All residents 47.5% 38.8%
American Indian / Alaska Native residents 53.4% 48.9%
Asian residents 31.2% 18.0%
Black or African American residents 47.0% 29.8%
Native Hawaiian / Pacific Islander residents 48.9% 15.1%
Other race residents 54.2% 44.1%
Two or more races residents 60.8% 51.3%
White residents 46.1% 46.7%
White alone, not Hispanic / Latino residents 44.1% 44.5%
Place of birth - Born in other state
Residents San DiegoPlano
All residents 26.0% 30.5%
American Indian / Alaska Native residents 20.2% 31.7%
Asian residents 7.7% 10.7%
Black or African American residents 36.2% 50.6%
Native Hawaiian / Pacific Islander residents 12.3% 30.0%
Other race residents 6.9% 8.4%
Two or more races residents 15.6% 17.9%
White residents 41.3% 41.1%
White alone, not Hispanic / Latino residents 44.8% 44.8%
English speakers (speaking English at home)
Type San Diego Plano
Born in the United States residents 91.8% 91%
Foreign born residents 14.1% 11.7%
Native, born elsewhere residents 59% 56.8%
Total residents 61.2% 63.1%
Mechanisms of homicide
Mechanism San DiegoPlano
Homicides from 2000 to 2006 813 108
Cut / Pierce 130 0
Firearm 478 63
Suffocation 41 0
Mechanisms of homicide per 1,000,000 residents
Mechanism San DiegoPlano
Homicides from 2000 to 2006 40.0 25.8
Cut / Pierce 6.4 0
Firearm 23.5 15.1
Suffocation 2.0 0
Mechanisms of suicide per 1,000,000 residents
Mechanism San DiegoPlano
Suicides from 2000 to 2006 103.8 78.2
Cut / Pierce 2.3 0
Drowning 2.1 0
Fall 6.3 0
Firearm 45.1 39.7
Poisoning 20.2 17.2
Suffocation 22.8 16.7

Infrastructure

San Diego offers more in terms of infrastructure due to its larger size. It has a bustling downtown area, an international airport, vibrant nightlife, and extensive parks. Plano, though smaller, also offers a well-maintained infrastructure, with a developing downtown area, and numerous parks and recreation centers.
Infrastructure
Type San Diego Plano
Hospitals 26 15
TV stations 13 25
Bank branches located here 255 115
Bank institutions located here 40 42
Main business address for public companies 92 17
Drinking water stations with no reported violations in the past 5 0
Drinking water stations with reported violations in the past 20 1

Schools

School facilities
Type San Diego Plano
Private elementary/middle schools 39 3
Private high schools 22 8
Public elementary/middle schools 221 53
Public high schools 71 16
Colleges/Universities 36 1
HMDA - Conventional home purchase loans - Applications denied
Year San DiegoPlano
1999 3,865 825
2000 2,257 258
2001 1,754 199
2002 2,118 204
2003 5,074 655
2004 7,646 921
2005 8,409 1,145
2006 7,551 1,104
2007 5,741 750
2008 2,876 384
2009 1,675 213

Culture and Food

San Diego's culture is influenced by its coastal location and proximity to Mexico, resulting in a diverse food scene, vibrant nightlife, and countless festivals. Plano, with a mix of Texan and international cultures, also offers a variety of dining options and cultural events.

Sports Teams

San Diego hosts the Padres (MLB), while popular teams like the Chargers (NFL) have relocated. In contrast, Plano is close to Dallas, home to the Cowboys (NFL), Mavericks (NBA), and Rangers (MLB).