San Diego and Southwest San Gabriel Valley are two distinctive Californian regions offering diverse lifestyles, cultural nuances, and amenities. Both regions boast unique geographies, amenities and cultures for both residents and tourists. While San Diego is primarily a bustling metropolitan area, Southwest San Gabriel Valley is more suburban. A comprehensive comparison of these two regions could provide balanced, in-depth insight for those looking to relocate or visit.
In comparing crime and safety, San Diego generally has a higher crime rate than Southwest San Gabriel Valley. However, like many cities, certain neighborhoods in both areas differ in safety. It's essential to research these areas carefully before moving or visiting. Both regions benefit from active law enforcement agencies that work diligently to maintain safety.
Cost of Living
In terms of cost of living, San Diego's is generally higher, factoring in factors like housing, food, and healthcare. Conversely, Southwest San Gabriel Valley has a lower cost of living, making it an attractive option for those looking for a more affordable California lifestyle.
Income Tax
Income tax rates are consistent across California, with rates ranging from 1% to 13.3% depending on income level. Therefore, residents of both San Diego and Southwest San Gabriel Valley fall under this tax structure.
Property Tax
Property tax rates are set at the county level in California. Both San Diego and Southwest San Gabriel Valley residents will experience similar rates, adjusted marginally based on the county and the value of their property.
Sales Tax
Both regions are subject to California's state sales tax of 7.25%, but San Diego charges an additional city tax of 2.25%. No additional local sales tax is collected in the Southwest San Gabriel Valley.
Income
Type
San Diego
Southwest San Gabriel Valley
Estimated median household income
$93,042
$73,720
Estimated per capita income
$48,380
$29,945
Cost of living index (U.S. average is 100)
126.4
161.2
If you make $50,000 in San Diego, you will have to make $63,766 in Southwest San Gabriel Valley to maintain the same standard of living.
Geographical Conditions
San Diego is a coastal city boasting beautiful beaches, bays, and natural parks. The Southwest San Gabriel Valley, located inland, offers a gentler landscape featuring rolling hills and open spaces.
Geographical information
Type
San Diego
Southwest San Gabriel Valley
Land area
324.3 sq. miles
35.3 sq. miles
Population density
4,259.7 people per sq. mile
9,252.7 people per sq. mile
Relative area comparison
San Diego, CA Southwest San Gabriel Valley, CA
Education
San Diego is home to many prestigious institutions, such as the University of California, San Diego, and San Diego State University. On the other hand, Southwest San Gabriel Valley contains many highly-rated public and private schools but lacks major universities.
San Diego's economy is diverse, with sectors like Biotech, Marine, and Telecommunications playing significant roles. Southwest San Gabriel Valley also boasts a thriving local economy, with small businesses being a significant contributor. Job opportunities and overall economic health vary between these two areas.
Biggest Employers
San Diego's largest employers include the University of California, San Diego (UCSD), and Naval Base San Diego. In Southwest San Gabriel Valley, large employers like the Huntington Hospital and Pasadena Unified School District provide significant local employment.
In San Diego (San Diego County), 52.6% voted for Democrats and 45.0% for Republicans in 2012 Presidential Election. In Southwest San Gabriel Valley (Los Angeles County), 69.7% voted for Democrats and 27.8% for Republicans.
Elections
Type
Democrats
Republicans
Other
Year
San Diego
Southwest San Gabriel Valley
San Diego
Southwest San Gabriel Valley
San Diego
Southwest San Gabriel Valley
2020
60.3%
71.0%
37.5%
26.9%
2.1%
2.1%
2016
56.3%
72.0%
36.6%
22.5%
7.1%
5.5%
2012
52.6%
69.7%
45.0%
27.8%
2.4%
2.4%
2008
54.2%
69.2%
44.0%
28.8%
1.8%
1.9%
2004
46.7%
63.3%
52.9%
35.7%
0.4%
1.0%
2000
45.8%
63.6%
49.8%
32.4%
4.5%
4.0%
1996
44.1%
59.3%
45.6%
31.0%
10.3%
9.7%
Breakdown of population affiliated with a religious congregation
Type
Adherents
Congregations
Religion
San Diego
Southwest San Gabriel Valley
San Diego
Southwest San Gabriel Valley
CATHOLIC CHURCH
25.9%
36.1%
6.7%
4.7%
SOUTHERN BAPTIST CONVENTION
1.1%
1.0%
12.0%
9.0%
MUSLIM ESTIMATE
0.7%
0.7%
1.1%
1.0%
SEVENTH DAY ADVENTIST CHURCH
0.5%
0.5%
2.0%
2.4%
EPISCOPAL CHURCH
0.4%
0.4%
2.0%
1.4%
EVANGELICAL LUTHERAN CHURCH IN AMERICA
0.4%
0.2%
2.0%
1.9%
LUTHERAN CHURCH
0.4%
0.2%
2.2%
1.6%
AMERICAN BAPTIST CHURCHES IN THE USA
0.1%
0.5%
1.5%
3.1%
Weather
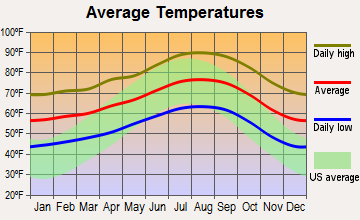
For fans of sunnier weather, San Diego is known for its warm, beach-friendly climate year-round, while Southwest San Gabriel Valley often experiences a semi-arid Mediterranean climate, characterized by warm, dry summers and cool, wet winters. For tourists, this could impact travel plans and activities during a visit.
Weather and climate
Type
San Diego
Southwest San Gabriel Valley
Temperature - Average
64.4°F
66.3°F
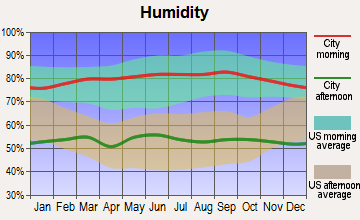
Humidity - Average morning or afternoon humidity
74%
61.4%
Humidity - Differences between morning and afternoon humidity
22%
16.5%
Humidity - Maximum monthly morning or afternoon humidity
80%
65.8%
Humidity - Minimum monthly morning or afternoon humidity
58%
49.3%
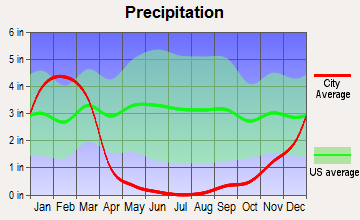
Precipitation - Yearly average
11 in
17.6 in
Snowfall - Yearly average
0 in
0 in
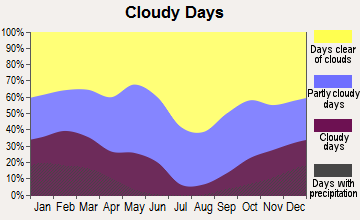
Clouds - Number of days clear of clouds
24.3%
30.1%
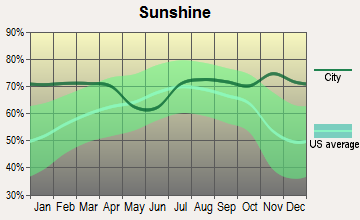
Sunshine amount - Average
74.8%
78.4%
Sunshine amount - Differences during a year
19%
22%
Sunshine amount - Maximum monthly
75%
85%
Sunshine amount - Minimum monthly
56%
63%
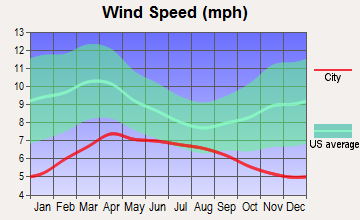
Wind speed - Average
6.9 mph
2.3 mph
Average climate in San Diego, California
Average climate in Southwest San Gabriel Valley, California
Air pollution
Type
AQI
CO
NO2
OZONE
PB
PM10
PM25
SO2
Year
San Diego
Southwest San Gabriel Valley
San Diego
Southwest San Gabriel Valley
San Diego
Southwest San Gabriel Valley
San Diego
Southwest San Gabriel Valley
San Diego
Southwest San Gabriel Valley
San Diego
Southwest San Gabriel Valley
San Diego
Southwest San Gabriel Valley
San Diego
Southwest San Gabriel Valley
2018
101
140
0.53
0.39
11.2
14.2
32.6
26.6
0.007
0.008
N/A
27.5
10.5
15.1
0.1
0.4
2017
115
142
0.63
0.38
12.7
15.1
32.7
27.8
0.007
0.007
N/A
30.2
10.8
15.3
0.1
0.5
2016
105
128
0.46
0.36
13.0
15.2
30.4
26.5
0.006
0.007
N/A
27.8
11.4
14.3
0.1
0.4
2015
111
137
0.43
0.36
13.2
15.3
29.9
26.7
0.005
0.006
N/A
27.6
11.9
16.4
0.1
0.3
2014
105
138
0.44
0.39
11.6
16.3
31.1
26.8
0.007
0.007
N/A
29.9
11.1
18.0
0.1
0.4
2013
138
140
0.50
0.44
12.4
17.5
27.4
25.2
0.019
0.007
N/A
28.3
12.3
17.0
0.2
0.4
2012
110
144
0.53
0.47
12.7
17.7
28.0
25.0
0.019
0.007
N/A
27.6
13.6
18.1
0.2
0.5
2011
122
142
0.51
0.50
13.5
19.3
29.0
23.6
0.034
0.008
N/A
29.8
14.0
17.6
1.5
0.4
2010
109
128
0.52
0.52
14.0
19.4
29.3
22.9
0.019
0.020
N/A
30.0
13.9
16.3
1.0
0.5
2009
121
150
0.64
0.43
15.6
21.5
26.9
23.5
0.014
0.011
N/A
40.0
15.1
18.0
2.7
0.5
2008
127
152
0.71
0.53
16.1
23.5
28.4
22.8
N/A
0.014
67.3
39.1
N/A
18.3
2.6
0.6
2007
157
128
0.71
0.58
16.4
24.2
28.0
21.8
0.012
0.017
64.6
N/A
N/A
N/A
2.8
1.1
2006
123
125
0.81
0.63
18.9
24.6
27.1
22.1
0.056
0.009
64.8
N/A
N/A
N/A
3.4
1.7
2005
112
123
0.90
0.66
19.2
25.6
24.4
20.5
0.049
0.015
N/A
N/A
N/A
N/A
3.7
2.1
2004
120
132
0.93
0.77
18.4
27.7
25.9
22.9
0.055
0.019
N/A
N/A
N/A
N/A
4.6
2.4
2003
124
143
0.88
0.98
19.4
31.8
25.4
22.0
0.049
0.027
N/A
N/A
N/A
N/A
3.8
1.8
2002
125
137
0.86
1.00
20.9
33.0
25.9
21.1
0.039
0.025
N/A
N/A
N/A
N/A
3.6
2.4
2001
132
143
0.93
1.11
20.4
34.2
26.5
18.9
0.048
0.039
N/A
N/A
N/A
N/A
3.4
2.4
2000
134
147
1.02
1.12
22.3
33.4
23.8
18.9
0.054
0.033
N/A
N/A
N/A
N/A
3.6
1.4
Natural disasters
Type
San Diego
Southwest San Gabriel Valley
Tornado activity compared to U.S. average
6.7%
18%
Earthquake activity compared to U.S. average
5,835%
7,182.3%
Natural disasters compared to U.S. average
39%
57%
Transportation
San Diego hosts an extensive public transit system, including buses, trams, and the Amtrak train service. In the Southwest San Gabriel Valley, public transit consists primarily of bus services, and driving tends to be the most common commuting method.
Transport
Type
San Diego
Southwest San Gabriel Valley
Amtrak stations
1
0
Amtrak stations nearby
2
3
FAA registered aircraft
852
0
FAA registered aircraft manufacturers and dealers
33
0
Means of transportation to work
Type
San Diego
Southwest San Gabriel Valley
Bicycle
0.6%
0.5%
Bus
2%
4.7%
Carpooled
9.4%
16.1%
Car alone
81.7%
73%
Ferryboat
0.1%
0%
Motorcycle
0.3%
0.1%
Railroad
0.5%
0%
Walked
3.6%
2.5%
Average travel time to work
Type
San Diego
Southwest San Gabriel Valley
Average
27.4 min
29.1 min
Real Estate
San Diego's real estate market is infamous for its high prices, driven by the city's popularity and seafront location. In contrast, Southwest San Gabriel Valley's real estate market is more affordable, with a range of housing options to suit different income levels.
Neighborhoods
From Downtown San Diego's bustling nightlife to La Jolla's serene ocean views, there's a neighborhood for everyone. In Southwest San Gabriel Valley, quieter suburban neighborhoods are more common, offering a peaceful, family-friendly environment.
Houses and residents
Type
San Diego
Southwest San Gabriel Valley
Houses
555,456
102,656
Average household size (people)
2.6
3.1
Houses occupied
521,000 (93.8%)
99,543 (97%)
Houses occupied by owners
251,507 (48.3%)
47,333 (47.6%)
Houses occupied by renters
269,493 (51.7%)
52,210 (52.5%)
Median rent asked for vacant for-rent units
$2,096
$1,828
Median price asked for vacant for-sale houses and condos
$957,871
$1,138,428
Estimated median house or condo value
$768,800
$723,161
Median number of rooms in apartments
3.7
3.7
Median number of rooms in houses and condos
5.9
5.9
Renting percentage
51.7%
51.7%
Housing density (houses/condos per square mile)
1,712.6
2,909.6
Household income disparities
42.3%
44%
Housing units without a mortgage
2,803 (1.6%)
13,166 (31.1%)
Housing units with both a second mortgage and home equity loan
12,495 (6.9%)
88 (0.2%)
Housing units with a mortgage
177,643 (98.4%)
29,118 (68.9%)
Housing units with a home equity loan
694 (0.4%)
2,557 (6%)
Housing units with a second mortgage
16,654 (9.2%)
2,975 (7%)
Housing units lacking complete kitchen facilities
0.8%
1.5%
Housing units lacking complete plumbing facilities
Self-employed workers in own not incorporated business
39,709
8,660
State government workers
29,438
4,158
Unpaid family workers
808
639
Industries and Occupations
San Diego's thriving sectors are Biotechnology and Healthcare, where many residents work. In the Southwest San Gabriel Valley, the Healthcare sector is also dominant, supplemented by retail, education, and local government jobs.
Both regions have access to high-quality healthcare, with San Diego hosting university-affiliated hospitals and Southwest San Gabriel Valley's Huntington Hospital ranked highly across California.
Health (county statistics)
Type
San Diego
Southwest San Gabriel Valley
General health status score of residents in this county from 1 (poor) to 5 (excellent)
San Diego has a developed infrastructure with substantial investments in public utilities, transportation, and urban planning. Comparatively, Southwest San Gabriel Valley, whilst smaller, also sports a well-planned infrastructure that supports its suburban communities.
Infrastructure
Type
San Diego
Southwest San Gabriel Valley
TV stations
13
26
Culture and Food
San Diego is famously multicultural, evident in its diverse food scene featuring Mexican, Seafood, and American cuisines. Southwest San Gabriel Valley is strongly influenced by a significant Asian-American population, contributing to a rich array of East Asian food options.
Sports Teams
San Diego is home to sports teams like the Padres (MLB) and Sockers (MASL). Southwest San Gabriel Valley, being a more suburban region, lacks professional sports teams but has a robust community sports culture.
 San Diego, CA
 Southwest San Gabriel Valley, CA