San Diego and the Upper San Gabriel Valley are two distingueshed areas of California, each offering a unique pace of life. San Diego, a populous city on the coast, boasts a rich mix of culture, entertainment, vivacious neighborhoods, and access to numerous beaches. The Upper San Gabriel Valley, consisting largely of suburbia, offers a more tranquil, residential environment. Nestled among the San Gabriel Mountains, it offers beautiful nature views and outdoor activities. Comparatively, the two areas provide different prospects concerning crime and safety, cost of living, education, economy, infrastructure, and many more aspects.
San Diego reports a slightly higher crime rate than national averages, particularly in property crimes. However, like any large metropolitan region, crime can vary significantly between neighborhoods. Upper San Gabriel Valley, on the other hand, consists of smaller communities, several of which have crime rates lower than national averages. Both areas offer safe neighborhoods, but overall, the Upper San Gabriel Valley typically records fewer crime incidents.
Cost of Living
San Diego's cost of living is considerably high, especially regarding housing. Although wages are typically higher in San Diego, residents may still feel the pinch due to the city's expensive living costs. The Upper San Gabriel Valley has a lower cost of living relative to San Diego, but it's still higher than the national average, chiefly in the housing department.
Income Tax
Both San Diego and Upper San Gabriel Valley residents are subject to California's progressive income tax, which ranges from 1% to 13.3% depending on income level.
Property Tax
Property taxes in San Diego and the Upper San Gabriel Valley are similar as they're both set at the state level. In California, property tax is 1% of the assessed value of the property at the time of purchase.
Sales Tax
The city sales tax in San Diego is 7.75%, while the Upper San Gabriel Valley region has a slightly higher sales tax ranging from 9.5% to 10.25%, depending on the city.
Income
Type
San Diego
Upper San Gabriel Valley
Estimated median household income
$93,042
$80,436
Estimated per capita income
$48,380
$33,562
Cost of living index (U.S. average is 100)
126.4
159.5
If you make $50,000 in San Diego, you will have to make $63,093 in Upper San Gabriel Valley to maintain the same standard of living.
Geographical Conditions
San Diego is characterized by a coastal geography with beautiful beaches, canyons, and mesas, while the Upper San Gabriel Valley is located inland, sandwiched between mountain ranges and the flat lowlands of the L.A. Basin.
Geographical information
Type
San Diego
Upper San Gabriel Valley
Land area
324.3 sq. miles
49.4 sq. miles
Population density
4,259.7 people per sq. mile
6,624.2 people per sq. mile
Relative area comparison
San Diego, CA Upper San Gabriel Valley, CA
Education
San Diego is home to numerous renowned universities and highly rated public schools, offering educational opportunities for various age groups. The Upper San Gabriel Valley also offers good education opportunities with highly rated schools and proximity to prominent educational institutions like the California Institute of Technology and Pasadena City College.
San Diego's economy is diverse and robust, with key sectors including technology, healthcare, international trade, research, and tourism. The Upper San Gabriel Valley also presents diverse job offerings, with a strong presence in manufacturing, retail, healthcare, and education sectors. However, San Diego's larger economy offers a wider variety of job opportunities.
Biggest Employers
In San Diego, major employers include the Navy, UC San Diego Health, Sharp HealthCare, and Qualcomm. In the Upper San Gabriel Valley, notable employers include City of Hope National Medical Center, California Institute of Technology, and Azusa Pacific University.
In San Diego (San Diego County), 52.6% voted for Democrats and 45.0% for Republicans in 2012 Presidential Election. In Upper San Gabriel Valley (Los Angeles County), 69.7% voted for Democrats and 27.8% for Republicans.
Elections
Type
Democrats
Republicans
Other
Year
San Diego
Upper San Gabriel Valley
San Diego
Upper San Gabriel Valley
San Diego
Upper San Gabriel Valley
2020
60.3%
71.0%
37.5%
26.9%
2.1%
2.1%
2016
56.3%
72.0%
36.6%
22.5%
7.1%
5.5%
2012
52.6%
69.7%
45.0%
27.8%
2.4%
2.4%
2008
54.2%
69.2%
44.0%
28.8%
1.8%
1.9%
2004
46.7%
63.3%
52.9%
35.7%
0.4%
1.0%
2000
45.8%
63.6%
49.8%
32.4%
4.5%
4.0%
1996
44.1%
59.3%
45.6%
31.0%
10.3%
9.7%
Breakdown of population affiliated with a religious congregation
Type
Adherents
Congregations
Religion
San Diego
Upper San Gabriel Valley
San Diego
Upper San Gabriel Valley
CATHOLIC CHURCH
25.9%
36.1%
6.7%
4.7%
SOUTHERN BAPTIST CONVENTION
1.1%
1.0%
12.0%
9.0%
MUSLIM ESTIMATE
0.7%
0.7%
1.1%
1.0%
SEVENTH DAY ADVENTIST CHURCH
0.5%
0.5%
2.0%
2.4%
EPISCOPAL CHURCH
0.4%
0.4%
2.0%
1.4%
EVANGELICAL LUTHERAN CHURCH IN AMERICA
0.4%
0.2%
2.0%
1.9%
LUTHERAN CHURCH
0.4%
0.2%
2.2%
1.6%
AMERICAN BAPTIST CHURCHES IN THE USA
0.1%
0.5%
1.5%
3.1%
Weather
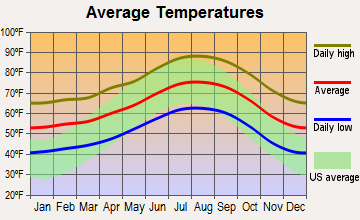
San Diego offers a desirable Mediterranean climate, with mild, wet winters and warm, dry summers. Its coastal location offers cooling sea breezes and reduces the temperature extremes often experienced further inland. The Upper San Gabriel Valley also benefits from a Mediterranean climate, but slightly hotter in summer due to its inland position. Winters can be cooler compared to San Diego, with surrounding mountain peaks frequently dusted with snow.
Weather and climate
Type
San Diego
Upper San Gabriel Valley
Temperature - Average
64.4°F
63.5°F
Humidity - Average morning or afternoon humidity
74%
62.2%
Humidity - Differences between morning and afternoon humidity
22%
17.3%
Humidity - Maximum monthly morning or afternoon humidity
80%
67%
Humidity - Minimum monthly morning or afternoon humidity
58%
49.7%
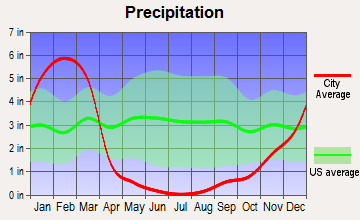
Precipitation - Yearly average
11 in
24.3 in
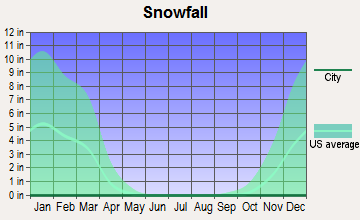
Snowfall - Yearly average
0 in
0 in
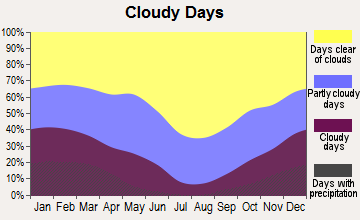
Clouds - Number of days clear of clouds
24.3%
29.4%
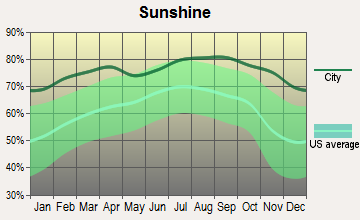
Sunshine amount - Average
74.8%
78.4%
Sunshine amount - Differences during a year
19%
22%
Sunshine amount - Maximum monthly
75%
85%
Sunshine amount - Minimum monthly
56%
63%
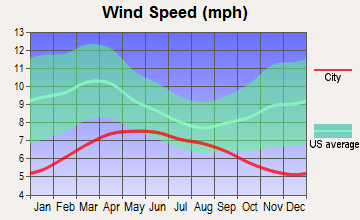
Wind speed - Average
6.9 mph
2.6 mph
Average climate in San Diego, California
Average climate in Upper San Gabriel Valley, California
Air pollution
Type
AQI
CO
NO2
OZONE
PB
PM10
PM25
SO2
Year
San Diego
Upper San Gabriel Valley
San Diego
Upper San Gabriel Valley
San Diego
Upper San Gabriel Valley
San Diego
Upper San Gabriel Valley
San Diego
Upper San Gabriel Valley
San Diego
Upper San Gabriel Valley
San Diego
Upper San Gabriel Valley
San Diego
Upper San Gabriel Valley
2018
101
142
0.53
0.37
11.2
14.2
32.6
28.5
0.007
0.007
N/A
28.5
10.5
14.1
0.1
0.4
2017
115
146
0.63
0.36
12.7
15.1
32.7
29.8
0.007
0.007
N/A
31.2
10.8
14.0
0.1
0.5
2016
105
136
0.46
0.33
13.0
15.5
30.4
28.1
0.006
0.007
N/A
28.6
11.4
13.0
0.1
0.4
2015
111
143
0.43
0.33
13.2
15.2
29.9
28.4
0.005
0.007
N/A
28.4
11.9
15.2
0.1
0.3
2014
105
141
0.44
0.35
11.6
16.7
31.1
28.0
0.007
0.007
N/A
31.3
11.1
14.9
0.1
0.5
2013
138
144
0.50
0.39
12.4
17.3
27.4
26.6
0.019
0.007
N/A
29.3
12.3
14.4
0.2
0.4
2012
110
148
0.53
0.43
12.7
18.2
28.0
25.9
0.019
0.006
N/A
28.7
13.6
16.5
0.2
0.5
2011
122
146
0.51
0.47
13.5
19.1
29.0
24.8
0.034
0.008
N/A
28.9
14.0
17.6
1.5
0.5
2010
109
133
0.52
0.48
14.0
19.2
29.3
24.6
0.019
0.011
N/A
27.0
13.9
15.5
1.0
0.5
2009
121
153
0.64
0.39
15.6
21.0
26.9
25.4
0.014
0.011
N/A
32.0
15.1
17.2
2.7
0.4
2008
127
155
0.71
0.54
16.1
23.1
28.4
24.9
N/A
0.013
67.3
32.1
N/A
16.9
2.6
0.6
2007
157
135
0.71
0.55
16.4
24.6
28.0
23.1
0.012
0.016
64.6
N/A
N/A
N/A
2.8
1.0
2006
123
128
0.81
0.58
18.9
24.9
27.1
22.8
0.056
0.009
64.8
N/A
N/A
N/A
3.4
1.5
2005
112
128
0.90
0.61
19.2
25.4
24.4
21.3
0.049
0.015
N/A
N/A
N/A
N/A
3.7
1.7
2004
120
134
0.93
0.71
18.4
26.0
25.9
23.8
0.055
0.018
N/A
N/A
N/A
N/A
4.6
2.4
2003
124
143
0.88
0.89
19.4
30.7
25.4
23.3
0.049
0.025
N/A
N/A
N/A
N/A
3.8
1.6
2002
125
137
0.86
0.91
20.9
32.5
25.9
21.9
0.039
0.022
N/A
N/A
N/A
N/A
3.6
2.2
2001
132
143
0.93
1.04
20.4
33.1
26.5
20.1
0.048
0.031
N/A
N/A
N/A
N/A
3.4
2.3
2000
134
151
1.02
1.07
22.3
33.5
23.8
20.1
0.054
0.028
N/A
N/A
N/A
N/A
3.6
1.3
Natural disasters
Type
San Diego
Upper San Gabriel Valley
Tornado activity compared to U.S. average
6.7%
18%
Earthquake activity compared to U.S. average
5,835%
7,264.5%
Natural disasters compared to U.S. average
39%
57%
Transportation
San Diego has a strong public transportation system, including bus and trolley services, and multiple interstate highways. Commutes in San Diego can be longer, particularly during peak hours. Upper San Gabriel Valley, though less equipped with public transit options, provides easy access to major freeways and is relatively close to Downtown L.A., and thus, commutes can be shorter.
Transport
Type
San Diego
Upper San Gabriel Valley
Amtrak stations
1
0
Amtrak stations nearby
2
3
FAA registered aircraft
852
0
FAA registered aircraft manufacturers and dealers
33
0
Means of transportation to work
Type
San Diego
Upper San Gabriel Valley
Bicycle
0.6%
1.1%
Bus
2%
3.9%
Carpooled
9.4%
16.6%
Car alone
81.7%
71.1%
Ferryboat
0.1%
0%
Motorcycle
0.3%
0.1%
Railroad
0.5%
0.1%
Taxicab
0.1%
0.1%
Walked
3.6%
3.2%
Average travel time to work
Type
San Diego
Upper San Gabriel Valley
Average
27.4 min
29.1 min
Real Estate
San Diego's real estate market is highly competitive, with home prices significantly above the national average. The Upper San Gabriel Valley also has a competitive market, but on average, housing prices are lower than in San Diego.
Neighborhoods
San Diego offers an eclectic mix of neighborhoods, from beach communities like La Jolla to historic districts like Gaslamp Quarter. Upper San Gabriel Valley is characterized by suburban communities each with a distinct character, such as the high-end Arcadia and the historic Monrovia.
Houses and residents
Type
San Diego
Upper San Gabriel Valley
Houses
555,456
99,295
Average household size (people)
2.6
3.3
Houses occupied
521,000 (93.8%)
96,186 (96.9%)
Houses occupied by owners
251,507 (48.3%)
52,398 (54.5%)
Houses occupied by renters
269,493 (51.7%)
43,788 (45.5%)
Median rent asked for vacant for-rent units
$2,096
$1,771
Median price asked for vacant for-sale houses and condos
$957,871
$1,138,428
Estimated median house or condo value
$768,800
$740,686
Median number of rooms in apartments
3.7
3.7
Median number of rooms in houses and condos
5.9
5.9
Renting percentage
51.7%
44.9%
Housing density (houses/condos per square mile)
1,712.6
2,008.8
Household income disparities
42.3%
44%
Housing units without a mortgage
2,803 (1.6%)
11,525 (24.8%)
Housing units with both a second mortgage and home equity loan
12,495 (6.9%)
137 (0.3%)
Housing units with a mortgage
177,643 (98.4%)
34,867 (75.2%)
Housing units with a home equity loan
694 (0.4%)
3,133 (6.8%)
Housing units with a second mortgage
16,654 (9.2%)
4,036 (8.7%)
Housing units lacking complete kitchen facilities
0.8%
1.5%
Housing units lacking complete plumbing facilities
Self-employed workers in own not incorporated business
39,709
10,209
State government workers
29,438
3,180
Unpaid family workers
808
401
Industries and Occupations
In San Diego, healthcare, military, research, tourism, and education are the main industries. Meanwhile, in the Upper San Gabriel Valley, industries revolve around manufacturing, education, retail, healthcare, and public administration. The occupations in each place reflect the dominant industries, with many professionals in San Diego engaged in management, science, and arts occupations, and those in Upper San Gabriel Valley mostly in sales, office, service, and education sectors.
San Diego is home to many top-quality medical facilities like UC San Diego Health and Scripps Health. The Upper San Gabriel Valley offers access to renowned hospitals like City of Hope National Medical Center and Huntington Memorial Hospital.
Health (county statistics)
Type
San Diego
Upper San Gabriel Valley
General health status score of residents in this county from 1 (poor) to 5 (excellent)
San Diego's infrastructure is more developed due to its city status, offering highways, bridges, public transit, an international airport, and a bustling seaport. The Upper San Gabriel Valley, being suburban, has less infrastructure but still provides efficient roads and proximity to significant airports like L.A. International.
Infrastructure
Type
San Diego
Upper San Gabriel Valley
TV stations
13
27
Culture and Food
San Diego, being a coastal city, has a vibrant and multicultural food scene with excellent seafood and Mexican cuisine. In contrast, Upper San Gabriel Valley, particularly in cities like Arcadia and San Gabriel, is famous for its quality Asian cuisine.
Sports Teams
San Diego hosts professional baseball and soccer teams, namely the Padres and Loyal SC. The Upper San Gabriel Valley does not host professional sports teams but is in close proximity to Los Angeles, which has teams in all major sports.
 San Diego, CA
 Upper San Gabriel Valley, CA