San Francisco and Fresno, although cities in the same state of California, offer distinctive experiences in terms of crime/safety, climate, cost of living, education, economy, infrastructure, industries, employment, real estate, neighborhoods, transportation, taxation, culture, sports, geography, and healthcare. San Francisco is notable for its breathtaking waterfronts, high cost of living, diverse culture and booming tech industry while Fresno is characterized by its agricultural focus, warm weather, lower cost of living, and proximity to national parks. This comparative analysis aims to provide an in-depth view of each city, aiding anyone considering a visit or even a move to either one.
Distance between
San Francisco, CA and
Fresno, CA : 160.4 miles
San Francisco's population is larger by 50%. Its population has grown by 38,468 people (5.0%) since 2000. The population of Fresno has grown by 116,858 people (27.3%) during that time.
San Francisco and Fresno have varying levels of crime and safety. San Francisco has had both an increase in property crimes and violent crimes in recent years, raising safety concerns. Conversely, Fresno has a higher overall crime rate, but many areas of the city are safe and family-friendly. Both cities have taken measures to increase safety and reduce crime, but potential residents should research neighborhoods before moving.
City-data.com crime index counts serious crimes and violent crime more heavily. It adjusts for the number of visitors and daily workers commuting into cities. (higher means more crime, U.S. average = 301.1)
City-data.com crime index counts serious crimes and violent crime more heavily. It adjusts for the number of visitors and daily workers commuting into cities. (higher means more crime, U.S. average = 301.1)
Sex Offenders
According to our data, there are 829 registered sex offenders living in San Francisco and 1,478 registered sex offenders living in . The ratio of residents to sex offenders in San Francisco is 1,051 to 1; the ratio in Fresno is 353 to 1. The number of registered sex offenders compared to the number of residents is a lot smaller in San Francisco than in Fresno.
Cost of Living
The cost of living in San Francisco is very high, being one of the most expensive cities in the US. In comparison, the cost of living in Fresno is significantly lower. Housing, food, transportation, and other basic essentials are less expensive in Fresno compared to San Francisco.
Income Tax
Both cities, being in California, have the same statewide income tax rates, which range from 1% up to 13.3% based on income level.
Property Tax
San Francisco tends to have higher property taxes due to the very high value of property in the city. Fresno's property taxes are generally lower due to more moderate property values.
Sales Tax
The sales tax in San Francisco is 8.5%, while Fresno's is slightly lower at 7.975%. These taxes encompass both state and local rates.
Income
Type
San Francisco
Fresno
Estimated median household income
$121,826
$61,250
Estimated per capita income
$80,383
$28,499
Cost of living index (U.S. average is 100)
141.1
96.3
If you make $50,000 in Fresno, you will have to make $73,261 in San Francisco to maintain the same standard of living.
Geographical Conditions
San Francisco is a coastal city with rolling hills, a large bay, and proximity to coastal forests, whereas Fresno is located in the San Joaquin Valley, offering flat terrain and proximate to several national parks.
Both cities offer a variety of educational opportunities, though San Francisco is home to more renowned universities such as the University of California, San Francisco and San Francisco State University. Fresno also has great schools, including Fresno State, but it doesn't boast the same nationwide recognition.
San Francisco's economy is heavily influenced by tech, finance, and tourism, with a higher unemployment rate than the national average. In contrast, Fresno's economy is based on agriculture, food processing, and the healthcare industry, offering a lower cost of living but also lower wages. The unemployment rate in Fresno is also higher than the national average.
Biggest Employers
In San Francisco, some of the largest employers include Salesforce, Wells Fargo, and Uber. Fresno's biggest employers are Community Medical Centers, Saint Agnes Medical Center, and Fresno Unified School District.
There were 33 building permits issued in San Francisco in 2012 (2 more than in 2011) compared to 1,911 building permits issued in Fresno in 2012 (1205 more than in 2011).
In San Francisco (San Francisco County), 83.5% voted for Democrats and 13.0% for Republicans in 2012 Presidential Election. In Fresno (Fresno County), 49.8% voted for Democrats and 48.0% for Republicans.
Elections
Type
Democrats
Republicans
Other
Year
San Francisco
Fresno
San Francisco
Fresno
San Francisco
Fresno
2020
85.3%
53.0%
12.7%
45.2%
2.0%
1.8%
2016
84.6%
49.2%
9.2%
43.2%
6.2%
7.5%
2012
83.5%
49.8%
13.0%
48.0%
3.4%
2.2%
2008
84.4%
50.2%
13.7%
48.1%
2.0%
1.8%
2004
83.0%
42.0%
15.2%
57.8%
1.8%
0.3%
2000
75.7%
43.2%
16.1%
53.3%
8.1%
3.5%
1996
72.2%
45.3%
15.7%
47.4%
12.1%
7.3%
Breakdown of population affiliated with a religious congregation
Type
Adherents
Congregations
Religion
San Francisco
Fresno
San Francisco
Fresno
CATHOLIC CHURCH
15.0%
31.0%
9.6%
6.1%
EPISCOPAL CHURCH
0.8%
0.0%
3.5%
0.1%
MUSLIM ESTIMATE
0.8%
0.3%
1.2%
0.6%
SOUTHERN BAPTIST CONVENTION
0.7%
1.6%
8.4%
8.1%
AMERICAN BAPTIST CHURCHES IN THE USA
0.6%
0.6%
2.5%
2.4%
EVANGELICAL LUTHERAN CHURCH IN AMERICA
0.2%
0.5%
1.7%
2.0%
SEVENTH DAY ADVENTIST CHURCH
0.2%
0.7%
1.9%
2.6%
Weather
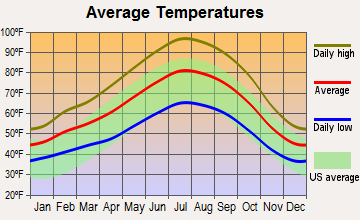
When comparing weather, San Francisco is known for its mild and foggy weather with average annual temperatures ranging from 50 to 73 degrees Fahrenheit. Fresno, on the other hand, experiences hot summers and mild winters with temperatures ranging from 36 to 97 degrees Fahrenheit on average. This could be a deciding factor depending on your weather preference.
Weather and climate
Type
San Francisco
Fresno
Temperature - Average
58.3°F
63°F
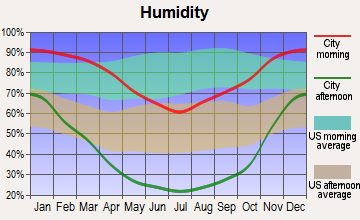
Humidity - Average morning or afternoon humidity
84.3%
60.9%
Humidity - Differences between morning and afternoon humidity
29%
67%
Humidity - Maximum monthly morning or afternoon humidity
91%
88%
Humidity - Minimum monthly morning or afternoon humidity
62%
21%
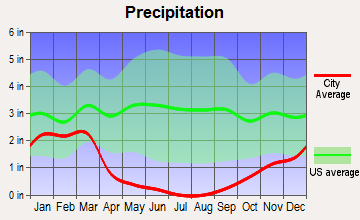
Precipitation - Yearly average
22.2 in
11.6 in
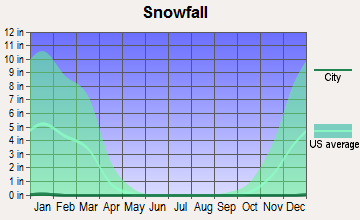
Snowfall - Yearly average
0 in
0 in
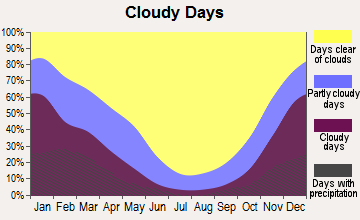
Clouds - Number of days clear of clouds
26.8%
32.4%
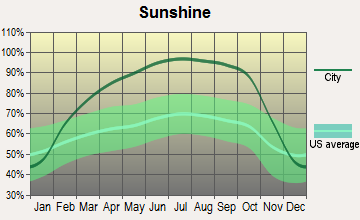
Sunshine amount - Average
73%
82.8%
Sunshine amount - Differences during a year
22%
52%
Sunshine amount - Maximum monthly
77%
96%
Sunshine amount - Minimum monthly
55%
44%
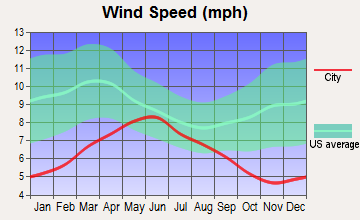
Wind speed - Average
11.4 mph
6.5 mph
Average climate in San Francisco, California
Average climate in Fresno, California
Air pollution
Type
AQI
CO
NO2
OZONE
PB
PM10
PM25
SO2
Year
San Francisco
Fresno
San Francisco
Fresno
San Francisco
Fresno
San Francisco
Fresno
San Francisco
Fresno
Fresno
San Francisco
Fresno
San Francisco
Fresno
2018
104
128
0.35
0.35
11.3
9.7
23.4
31.7
0.012
N/A
39.7
N/A
11.9
14.8
0.4
0.6
2017
96
132
0.40
0.35
11.4
9.2
22.5
33.2
0.008
N/A
38.3
N/A
9.9
14.3
0.6
0.6
2016
68
128
0.39
0.35
10.6
8.4
22.4
31.4
0.005
N/A
34.7
N/A
7.9
13.5
0.8
0.5
2015
85
134
0.41
0.32
12.1
8.7
22.5
31.1
0.004
N/A
34.2
N/A
7.9
13.9
0.8
0.5
2014
85
139
0.38
0.33
12.1
10.1
21.8
32.4
0.005
0.004
39.3
N/A
7.7
16.4
0.6
0.5
2013
88
136
0.40
0.37
13.9
11.1
20.4
31.0
0.004
0.005
43.3
N/A
10.2
19.1
0.5
0.6
2012
75
140
0.40
0.36
12.8
9.7
22.7
31.9
0.003
0.004
36.1
N/A
8.2
14.2
1.1
0.6
2011
86
139
0.24
0.34
14.1
8.7
21.3
33.5
0.003
N/A
30.2
N/A
9.5
21.1
1.7
0.8
2010
84
121
0.21
0.27
13.4
6.9
22.0
31.1
0.004
N/A
N/A
N/A
10.6
N/A
1.0
0.7
2009
95
107
0.30
0.31
15.1
7.3
20.4
29.6
0.005
N/A
N/A
N/A
12.8
N/A
1.1
1.6
2008
94
130
0.43
0.33
15.6
9.3
21.7
31.1
0.007
N/A
N/A
N/A
11.7
22.2
0.9
1.0
2007
84
146
0.45
0.34
15.6
10.0
20.5
28.4
0.007
N/A
N/A
N/A
8.9
26.0
1.2
0.7
2006
86
104
0.52
0.36
16.1
11.3
21.5
29.7
N/A
0.006
N/A
N/A
8.7
N/A
1.6
N/A
2005
89
101
0.39
0.33
14.8
10.7
20.5
28.1
N/A
N/A
N/A
N/A
8.8
N/A
1.3
N/A
2004
93
103
0.44
0.34
16.1
11.5
20.9
30.8
0.004
N/A
N/A
N/A
11.2
N/A
2.5
N/A
2003
65
115
0.64
0.44
18.4
15.0
19.7
31.2
N/A
N/A
N/A
N/A
N/A
N/A
1.7
1.2
2002
62
139
0.69
0.43
18.6
15.2
19.6
44.8
0.008
N/A
N/A
N/A
N/A
N/A
1.4
N/A
2001
64
143
0.72
0.42
19.2
15.1
19.0
47.3
0.008
N/A
N/A
N/A
N/A
N/A
1.4
N/A
2000
60
136
0.71
0.51
20.3
15.4
17.1
41.0
0.017
N/A
N/A
N/A
N/A
N/A
2.0
N/A
Natural disasters
Type
San Francisco
Fresno
Tornado activity compared to U.S. average
7.7%
9.9%
Earthquake activity compared to U.S. average
7,468.1%
8,613%
Natural disasters compared to U.S. average
6%
12%
Transportation
Public transit in San Francisco is comprehensive with buses, light rail, and ferries covering the entire city, and cycling is a popular commute option. In contrast, Fresno's public transit is limited and most residents rely heavily on driving.
Transport
Type
San Francisco
Fresno
Amtrak stations
4
1
Amtrak stations nearby
3
2
FAA registered aircraft
453
408
FAA registered aircraft manufacturers and dealers
9
36
Means of transportation to work
Type
San Francisco
Fresno
Bicycle
2.7%
0.8%
Bus
11.4%
1.3%
Carpooled
9.1%
10.7%
Car alone
53.9%
84.4%
Ferryboat
0.4%
0%
Motorcycle
0.9%
0.2%
Railroad
0.7%
0%
Streetcar
7.9%
0%
Subway
1.6%
0.1%
Taxicab
0.4%
0.1%
Walked
8.3%
1.4%
Average travel time to work
Type
San Francisco
Fresno
Average
38 min
23.7 min
Other means
28.3 min
21.5 min
Public transportation
39.7 min
45.3 min
Private vehicle occupancy
Type
San Francisco
Fresno
Average
1.2
1.2
Drove alone
85.5%
88.3%
In 2 person carpool
10.1%
8.5%
In 3 person carpool
3.2%
1.8%
In 4 person carpool
0.9%
0.8%
In 5-6 person carpool
0.2%
0.5%
In 7+ person carpool
0.1%
0.1%
How many people usually rode to work in the car, truck or van.
Real Estate
San Francisco's real estate market is booming and expensive, with limited available properties. In contrast, Fresno's real estate market is more affordable and offers a wider variety of available properties.
Neighborhoods
San Francisco offers diverse neighborhoods, with options ranging from upscale Nob Hill to artsy Mission District. In contrast, Fresno's neighborhoods are more suburban, appealing to those who prefer a quieter hometown feel.
Houses and residents
Type
San Francisco
Fresno
Houses
412,269
188,756
Average household size (people)
2.3
3.1
Median year apartment built
1953
1977
Median year house/condo built
1942
1983
Length of stay in the house since moving in
16.3 years
12.6 years
Houses occupied
350,796 (85.1%)
181,841 (96.3%)
Houses occupied by owners
140,809 (40.1%)
91,233 (50.2%)
Houses occupied by renters
209,987 (59.9%)
90,608 (49.8%)
Median rent asked for vacant for-rent units
$3,809
$958.34
Median monthly housing costs
$2,337
$1,209
Median price asked for vacant for-sale houses and condos
$1,670,841
$285,919
Estimated median house or condo value
Over $1,000,000
$321,300
Median numbers of rooms
3.9
5
Median number of rooms in apartments
3.2
4
Median number of rooms in houses and condos
5.6
5.9
Median house price - detached houses
Over $1,000,000
$375,492
Median house price - in 2-unit structures
Over $1,000,000
$184,112
Median house price - in 3-to-4-unit structures
Over $1,000,000
$196,355
Median house price - in 5 or more unit structures
Over $1,000,000
$287,684
Median house price - mobile homes
$517,939
$100,122
Median house price - Townhouses or other attached units
Over $1,000,000
$260,277
Median house price - All housing units
Over $1,000,000
$358,028
Median house age
76
42
Renting percentage
64.2%
50.9%
Housing density (houses/condos per square mile)
8,829.1
1,808.6
House value disparities
18.7%
29.4%
Household income disparities
41.7%
46.4%
Median household income for houses/condes with a mortgage
$210,544
$97,354
Median household income for apartments without a mortgage
$99,969
$73,445
Housing units without a mortgage
1,778 (1.9%)
1,037 (1.7%)
Housing units with both a second mortgage and home equity loan
7,687 (8.3%)
2,880 (4.8%)
Housing units with a mortgage
91,236 (98.1%)
59,354 (98.3%)
Housing units with a home equity loan
471 (0.5%)
68 (0.1%)
Housing units with a second mortgage
9,395 (10.1%)
4,120 (6.8%)
House/condo owner moved in on average (years ago)
14
10
House/condo renter moved in on average (years ago)
4
3
Housing units lacking complete kitchen facilities
4.7%
1.5%
Housing units lacking complete plumbing facilities
2.7%
0.4%
Housing units in structures
Housing units in structures
San Francisco
Fresno
One, detached
19.1%
59.0%
One, attached
12.1%
3.2%
Two
9.0%
3.0%
3 or 4
11.4%
7.8%
5 to 9
9.0%
9.6%
10 to 19
9.3%
3.6%
20 to 49
11.3%
3.4%
50 or more
18.7%
7.5%
Mobile homes
0.1%
2.6%
Boats, RVs, vans, etc.
0.0%
0.1%
Median real estate property taxes paid for housing units
Self-employed workers in own not incorporated business
30,288
14,428
State government workers
22,691
9,836
Unpaid family workers
399
890
Industries and Occupations
The main industries in San Francisco are technology, finance, and tourism. The dominant occupations are managerial, professional, and tech-related roles. Fresno's leading industries are agriculture, healthcare, and education, with many residents working in farming, nursing, and teaching.
San Francisco offers world-class healthcare with numerous highly-rated hospitals, such as UCSF Medical Center. Fresno also has good healthcare facilities, notably Community Regional Medical Center, although not as world-renowned as those in San Francisco.
San Francisco is well-developed with impressive skylines, modern buildings, and advanced tech infrastructure making it appealing to businesses and residents. Fresno lacks the same high-end infrastructure but is sufficiently developed for its size.
Infrastructure
Type
San Francisco
Fresno
Hospitals
16
32
TV stations
18
4
Arenas or stadiums
2
2
Bank branches located here
281
98
Bank institutions located here
52
25
Main business address for public companies
68
1
Drinking water stations with no reported violations in the past
5
5
Drinking water stations with reported violations in the past
HMDA - Conventional home purchase loans - Applications denied
Year
San Francisco
Fresno
1999
1,402
717
2000
1,000
484
2001
733
462
2002
870
569
2003
1,576
1,510
2004
2,147
2,462
2005
2,344
3,394
2006
2,511
3,441
2007
2,117
2,138
2008
1,575
760
2009
952
354
Culture and Food
Cultural and gastronomical scenes flourish in San Francisco, with diverse cuisines and lifestyles, while Fresno offers a more homely and traditional atmosphere with Mexican cuisine being popular.
Sports Teams
San Francisco is home to several professional sports teams including the San Francisco Giants and 49ers. Fresno, while not having its own professional sports teams, hosts Minor League Baseball’s Fresno Grizzlies.


 San Francisco, CA
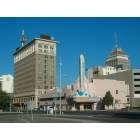
 Fresno, CA