San Francisco, California and Lincoln, Nebraska are two distinctly different cities, each with its own unique qualities. San Francisco, known for its tech industry and iconic Golden Gate Bridge, has a high cost of living and diverse culture. Lincoln, the quieter capital city of Nebraska, offers a slower pace of life and lower living costs. While each city has its advantages, the choice will depend on personal lifestyle preferences, economic factors, and your aspirations.
Distance between
San Francisco, CA and
Lincoln, NE : 1,388.5 miles
San Francisco's population is larger by 179%. Its population has grown by 38,468 people (5.0%) since 2000. The population of Lincoln has grown by 67,076 people (29.7%) during that time.
Although San Francisco has a higher crime rate compared to the national average, efforts are consistently being made to increase safety. Neighborhood crime rates in San Francisco vary, with districts like Presidio and Sunset offering greater safety. On the other hand, Lincoln, Nebraska's crime rate is lower than the national average, making it a safer place to live overall. According to NeighbourhoodScout, Lincoln is safer than approximately 35% of U.S. cities.
City-data.com crime index counts serious crimes and violent crime more heavily. It adjusts for the number of visitors and daily workers commuting into cities. (higher means more crime, U.S. average = 301.1)
City-data.com crime index counts serious crimes and violent crime more heavily. It adjusts for the number of visitors and daily workers commuting into cities. (higher means more crime, U.S. average = 301.1)
Sex Offenders
According to our data, there are 586 registered sex offenders living in San Francisco and 880 registered sex offenders living in . The ratio of residents to sex offenders in San Francisco is 1,486 to 1; the ratio in Lincoln is 319 to 1. The number of registered sex offenders compared to the number of residents is a lot smaller in San Francisco than in Lincoln.
Cost of Living
San Francisco is one of the most expensive cities in America, which is reflected in its high housing costs, transportation expenses, and general living expenses. Lincoln, by contrast, has a relatively low cost of living. Housing in Lincoln is less than half of the national average, making it a more affordable option for families and individuals looking to relocate.
Income Tax
Both California and Nebraska have a progressive state income tax, with California’s rates ranging from 1% to 13.3% and Nebraska’s from 2.46% to 6.84%. Neither city imposes a city income tax.
Property Tax
In California, the average property tax rate is 0.73%, while in Nebraska it's 1.65%. However, due to the higher property values in San Francisco, homeowners there tend to pay more in absolute dollars.
Sales Tax
California's state sales tax is 7.25%, and San Francisco adds an extra 1.25% city sales tax. Comparatively, Nebraska's state sales tax is 5.5%, with Lincoln adding a 1.75% city sales tax.
Income
Type
San Francisco
Lincoln
Estimated median household income
$121,826
$62,294
Estimated per capita income
$80,383
$34,008
Cost of living index (U.S. average is 100)
141.1
84.5
If you make $50,000 in Lincoln, you will have to make $83,491 in San Francisco to maintain the same standard of living.
Geographical Conditions
San Francisco is known for its hilly landscape, beautiful bay, and iconic Golden Gate Bridge. It has access to various outdoor activities like hiking, sailing, and surfing. Lincoln, on the other hand, is located on the Great Plains with a geography that consists of flat grasslands.
San Francisco is renowned for its high-quality education and is home to prestigious universities such as University of California San Francisco and San Francisco State University. Lincoln also offers solid educational opportunities with the University of Nebraska-Lincoln being the city's largest employer and an educational hub.
San Francisco's economy is diverse and strong, largely driven by the tech industry, finance, and tourism. Meanwhile, Lincoln's economy is based more on service industries, government, and manufacturing. The unemployment rate in both cities is below the national average, although job growth rate is higher in San Francisco.
Biggest Employers
In San Francisco, the tech sector leads with companies such as Salesforce, Uber, and Twitter. Meanwhile, in Lincoln, the University of Nebraska-Lincoln, State of Nebraska, and Lincoln Public Schools are the largest employers.
There were 33 building permits issued in San Francisco in 2012 (2 more than in 2011) compared to 1,093 building permits issued in Lincoln in 2012 (549 more than in 2011).
In San Francisco (San Francisco County), 83.5% voted for Democrats and 13.0% for Republicans in 2012 Presidential Election. In Lincoln (Lancaster County), 48.7% voted for Democrats and 49.0% for Republicans.
Elections
Type
Democrats
Republicans
Other
Year
San Francisco
Lincoln
San Francisco
Lincoln
San Francisco
Lincoln
2020
85.3%
52.3%
12.7%
44.6%
2.0%
3.1%
2016
84.6%
45.4%
9.2%
45.2%
6.2%
9.4%
2012
83.5%
48.7%
13.0%
49.0%
3.4%
2.3%
2008
84.4%
51.6%
13.7%
46.6%
2.0%
1.9%
2004
83.0%
42.6%
15.2%
56.3%
1.8%
1.1%
2000
75.7%
41.7%
16.1%
51.9%
8.1%
6.4%
1996
72.2%
44.4%
15.7%
45.9%
12.1%
9.8%
Breakdown of population affiliated with a religious congregation
Type
Adherents
Congregations
Religion
San Francisco
Lincoln
San Francisco
Lincoln
CATHOLIC CHURCH
15.0%
14.9%
9.6%
6.8%
EPISCOPAL CHURCH
0.8%
0.4%
3.5%
1.7%
MUSLIM ESTIMATE
0.8%
0.2%
1.2%
0.8%
SOUTHERN BAPTIST CONVENTION
0.7%
0.7%
8.4%
3.0%
AMERICAN BAPTIST CHURCHES IN THE USA
0.6%
0.1%
2.5%
1.3%
EVANGELICAL LUTHERAN CHURCH IN AMERICA
0.2%
5.0%
1.7%
6.4%
LUTHERAN CHURCH
0.2%
4.6%
1.5%
5.9%
REFORMED CHURCH IN AMERICA
0.2%
0.4%
0.2%
1.3%
SALVATION ARMY
0.2%
0.4%
1.3%
0.4%
SEVENTH DAY ADVENTIST CHURCH
0.2%
1.4%
1.9%
3.4%
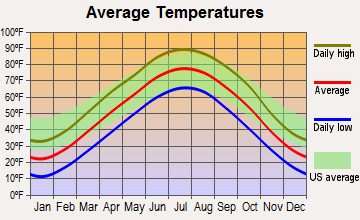
Weather
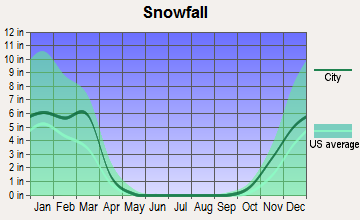
San Francisco enjoys moderate weather year-round. Its Mediterranean climate means cool, damp winters and dry summers, with temperatures rarely exceeding 80 degrees. Fog is a common phenomenon. Lincoln, in contrast, experiences a humid continental climate with hot summers and cold, snowy winters. The variety in weather can offer a refreshing change for those unaccustomed to San Francisco's consistently mild weather.
Weather and climate
Type
San Francisco
Lincoln
Temperature - Average
58.3°F
51.1°F
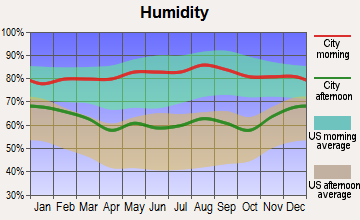
Humidity - Average morning or afternoon humidity
84.3%
75.2%
Humidity - Differences between morning and afternoon humidity
29%
35%
Humidity - Maximum monthly morning or afternoon humidity
91%
87%
Humidity - Minimum monthly morning or afternoon humidity
62%
52%
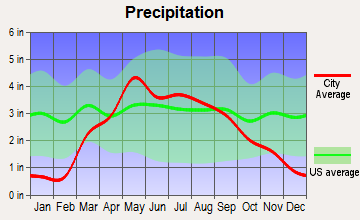
Precipitation - Yearly average
22.2 in
29.1 in
Snowfall - Yearly average
0 in
53 in
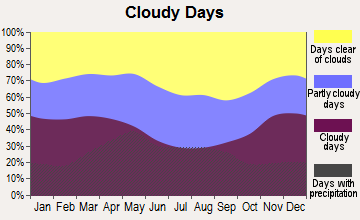
Clouds - Number of days clear of clouds
26.8%
19.6%
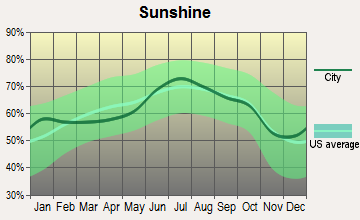
Sunshine amount - Average
73%
65.4%
Sunshine amount - Differences during a year
22%
23%
Sunshine amount - Maximum monthly
77%
73%
Sunshine amount - Minimum monthly
55%
50%
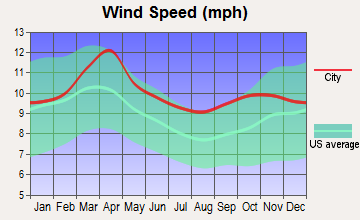
Wind speed - Average
11.4 mph
10.6 mph
Average climate in San Francisco, California
Average climate in Lincoln, Nebraska
Air pollution
Type
AQI
CO
NO2
OZONE
PB
PM25
SO2
Year
San Francisco
Lincoln
San Francisco
Lincoln
San Francisco
San Francisco
Lincoln
San Francisco
San Francisco
San Francisco
2018
104
46
0.35
N/A
11.3
N/A
23.4
28.8
0.012
N/A
11.9
N/A
0.4
N/A
2017
96
47
0.40
N/A
11.4
N/A
22.5
27.6
0.008
N/A
9.9
N/A
0.6
N/A
2016
68
48
0.39
N/A
10.6
N/A
22.4
30.4
0.005
N/A
7.9
N/A
0.8
N/A
2015
85
54
0.41
N/A
12.1
N/A
22.5
31.3
0.004
N/A
7.9
N/A
0.8
N/A
2014
85
54
0.38
N/A
12.1
N/A
21.8
29.1
0.005
N/A
7.7
N/A
0.6
N/A
2013
88
46
0.40
N/A
13.9
N/A
20.4
29.1
0.004
N/A
10.2
N/A
0.5
N/A
2012
75
41
0.40
N/A
12.8
N/A
22.7
32.7
0.003
N/A
8.2
N/A
1.1
N/A
2011
86
30
0.24
0.32
14.1
N/A
21.3
26.3
0.003
N/A
9.5
N/A
1.7
N/A
2010
84
31
0.21
0.39
13.4
N/A
22.0
25.0
0.004
N/A
10.6
N/A
1.0
N/A
2009
95
58
0.30
0.42
15.1
N/A
20.4
23.4
0.005
N/A
12.8
N/A
1.1
N/A
2008
94
31
0.43
0.40
15.6
N/A
21.7
25.4
0.007
N/A
11.7
N/A
0.9
N/A
2007
84
35
0.45
0.47
15.6
N/A
20.5
27.8
0.007
N/A
8.9
N/A
1.2
N/A
2006
86
38
0.52
0.55
16.1
N/A
21.5
26.7
N/A
N/A
8.7
N/A
1.6
N/A
2005
89
40
0.39
0.62
14.8
N/A
20.5
28.2
N/A
N/A
8.8
N/A
1.3
N/A
2004
93
37
0.44
0.68
16.1
N/A
20.9
27.1
0.004
N/A
11.2
N/A
2.5
N/A
2003
65
43
0.64
0.63
18.4
N/A
19.7
29.2
N/A
N/A
N/A
N/A
1.7
N/A
2002
62
39
0.69
0.62
18.6
N/A
19.6
27.3
0.008
N/A
N/A
N/A
1.4
N/A
2001
64
41
0.72
0.73
19.2
N/A
19.0
26.5
0.008
N/A
N/A
N/A
1.4
N/A
2000
60
40
0.71
0.71
20.3
N/A
17.1
27.8
0.017
N/A
N/A
N/A
2.0
N/A
Natural disasters
Type
San Francisco
Lincoln
Tornado activity compared to U.S. average
7.7%
199.3%
Earthquake activity compared to U.S. average
7,468.1%
471.2%
Natural disasters compared to U.S. average
6%
12%
Transportation
In terms of public transportation, San Francisco has an extensive network, including BART and the city’s famous cable cars. It's also a commuter-friendly city with a higher percentage of people biking or walking to work. Lincoln's public transportation is limited to a bus system and cycling routes, but the city is easy to navigate by car.
Transport
Type
San Francisco
Lincoln
Amtrak stations
4
1
Amtrak stations nearby
3
1
FAA registered aircraft
453
240
FAA registered aircraft manufacturers and dealers
9
3
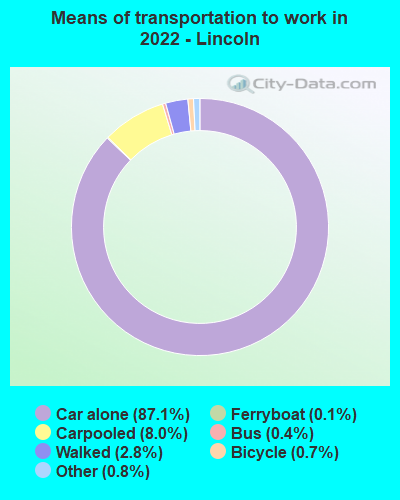
Means of transportation to work
Type
San Francisco
Lincoln
Bicycle
2.7%
0.8%
Bus
11.4%
1.1%
Carpooled
9.1%
10.2%
Car alone
53.9%
83.4%
Ferryboat
0.4%
0%
Motorcycle
0.9%
0.1%
Railroad
0.7%
0%
Streetcar
7.9%
0%
Subway
1.6%
0%
Taxicab
0.4%
0%
Walked
8.3%
3.4%
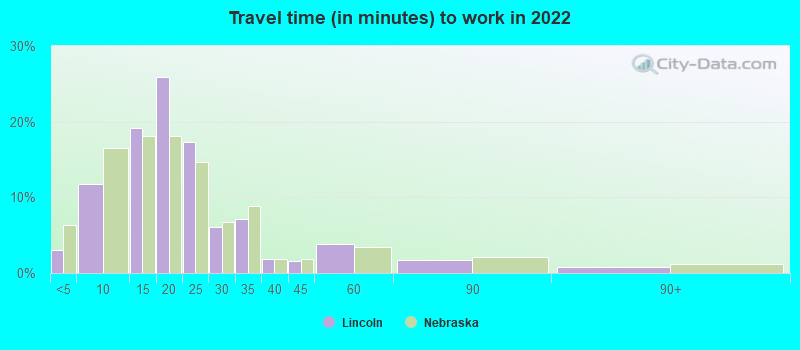
Average travel time to work
Type
San Francisco
Lincoln
Average
38 min
21.5 min
Other means
28.3 min
18.8 min
Public transportation
39.7 min
28.9 min
Private vehicle occupancy
Type
San Francisco
Lincoln
Average
1.2
1.1
Drove alone
85.5%
88.3%
In 2 person carpool
10.1%
10%
In 3 person carpool
3.2%
1.1%
In 4 person carpool
0.9%
0.3%
In 5-6 person carpool
0.2%
0.3%
In 7+ person carpool
0.1%
0%
How many people usually rode to work in the car, truck or van.
Real Estate
Real estate is more expensive in San Francisco. With a high demand and limited supply, housing costs are considerable. Lincoln has a balanced real estate market with lower median home prices, offering affordable housing options.
Neighborhoods
Both San Francisco and Lincoln offer vibrant neighborhoods. San Francisco's neighborhoods are diverse and each offers its own flavor, from the hip Mission District to the affluent Pacific Heights. Lincoln's neighborhoods are quieter and primarily residential, such as the family-friendly Capitol Beach.
Houses and residents
Type
San Francisco
Lincoln
Houses
412,269
126,262
Average household size (people)
2.3
2.4
Median year apartment built
1953
1983
Median year house/condo built
1942
1979
Length of stay in the house since moving in
16.3 years
12.1 years
Houses occupied
350,796 (85.1%)
120,407 (95.4%)
Houses occupied by owners
140,809 (40.1%)
70,003 (58.1%)
Houses occupied by renters
209,987 (59.9%)
50,404 (41.9%)
Median rent asked for vacant for-rent units
$3,809
$849.83
Median monthly housing costs
$2,337
$1,000
Median price asked for vacant for-sale houses and condos
$1,670,841
$413,349
Estimated median house or condo value
Over $1,000,000
$228,000
Median numbers of rooms
3.9
5.7
Median number of rooms in apartments
3.2
3.9
Median number of rooms in houses and condos
5.6
7
Median house price - detached houses
Over $1,000,000
$244,409
Median house price - in 2-unit structures
Over $1,000,000
$146,009
Median house price - in 3-to-4-unit structures
Over $1,000,000
$318,993
Median house price - in 5 or more unit structures
Over $1,000,000
$99,016
Median house price - mobile homes
$517,939
$14,649
Median house price - Townhouses or other attached units
Over $1,000,000
$282,955
Median house price - All housing units
Over $1,000,000
$242,537
Median house age
76
40
Renting percentage
64.2%
41.4%
Housing density (houses/condos per square mile)
8,829.1
1,691.6
House value disparities
18.7%
29.7%
Household income disparities
41.7%
43.1%
Median household income for houses/condes with a mortgage
$210,544
$97,001
Median household income for apartments without a mortgage
$99,969
$72,157
Housing units without a mortgage
1,778 (1.9%)
1,686 (3.6%)
Housing units with both a second mortgage and home equity loan
7,687 (8.3%)
3,489 (7.5%)
Housing units with a mortgage
91,236 (98.1%)
44,764 (96.4%)
Housing units with a home equity loan
471 (0.5%)
0 (0%)
Housing units with a second mortgage
9,395 (10.1%)
4,382 (9.4%)
House/condo owner moved in on average (years ago)
14
10
House/condo renter moved in on average (years ago)
4
1
Housing units lacking complete kitchen facilities
4.7%
0.8%
Housing units lacking complete plumbing facilities
2.7%
0.3%
Housing units in structures
Housing units in structures
San Francisco
Lincoln
One, detached
19.1%
58.3%
One, attached
12.1%
8.0%
Two
9.0%
2.3%
3 or 4
11.4%
2.9%
5 to 9
9.0%
5.6%
10 to 19
9.3%
7.4%
20 to 49
11.3%
7.6%
50 or more
18.7%
6.4%
Mobile homes
0.1%
1.5%
Median real estate property taxes paid for housing units
Self-employed workers in own not incorporated business
30,288
9,332
State government workers
22,691
14,738
Unpaid family workers
399
298
Industries and Occupations
A tech hub, San Francisco hosts companies including Uber, Twitter, and Salesforce. Other large sectors include finance and tourism. Lincoln's economy primarily revolves around service industries, manufacturing, and the government sector, offering jobs in industries like education, health, and finance.
San Francisco is home to highly rated medical facilities such as University of California San Francisco Medical Center. Lincoln also has solid health care options including Bryan Health and the CHI Health St. Elizabeth.
Health (county statistics)
Type
San Francisco
Lincoln
General health status score of residents in this county from 1 (poor) to 5 (excellent)
San Francisco boasts state-of-the-art infrastructure, including the iconic Golden Gate Bridge and SFO, an international airport with connections worldwide. Lincoln's infrastructure is less extensive, but includes Lincoln Airport and an efficient highway system.
Infrastructure
Type
San Francisco
Lincoln
Hospitals
16
11
TV stations
18
16
Arenas or stadiums
2
3
Bank branches located here
281
123
Bank institutions located here
52
21
Main business address for public companies
68
8
Drinking water stations with no reported violations in the past
5
6
Drinking water stations with reported violations in the past
HMDA - Conventional home purchase loans - Applications denied
Year
San Francisco
Lincoln
1999
1,402
563
2000
1,000
394
2001
733
262
2002
870
246
2003
1,576
334
2004
2,147
357
2005
2,344
416
2006
2,511
374
2007
2,117
223
2008
1,575
149
2009
952
97
Culture and Food
San Francisco is renowned for its cultural diversity, reflected in its food, music, and art scene. It's a foodie's paradise, offering everything from Michelin-star restaurants to global street food. Lincoln, while having a quieter cultural scene, is known for its vibrant music scene and Midwestern cuisine.
Sports Teams
San Francisco homes several major sports teams, including the San Francisco 49ers (NFL) and the Golden State Warriors (NBA). Lincoln is home to the University of Nebraska's Cornhuskers, who command a loyal following in college football.


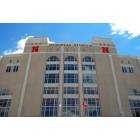


 San Francisco, CA
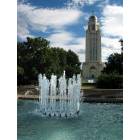
 Lincoln, NE