San Francisco, California, as a bustling city with a diverse and energetic population, contrasts greatly with the quiet and cozy community of Newhall, California. From the aspect of cost of living, crime rates, or education opportunities, to cultural vibrancy, tax considerations and health care options, the two places provide distinctly different lifestyles. This comparison sheds light on the unique features, pros, and cons of living or visiting these two places, catering to people considering relocation or a short tour.
San Francisco, being a large city, does have higher crime rates than smaller suburban towns like Newhall. However, it's important to note that crime is typically concentrated in specific areas, and many neighborhoods in San Francisco are considered to be very safe. On the other hand, Newhall enjoys a lower crime rate due to its less dense population and suburban lifestyle, making it a safer living or tourist destination overall.
Cost of Living
San Francisco is one of the most expensive cities in the United States, with the cost of living being significantly higher than the national average. This includes housing, food, and transportation expenses. Newhall, while not cheap, is less expensive compared to San Francisco, with the cost of living closer to the state average.
Income Tax
Both San Francisco and Newhall residents are subject to California state income tax, which is progressive and ranges from 1% to 13.3% depending upon income. There is no additional city income tax in either location.
Property Tax
Property taxes in San Francisco county are relatively high compared to other counties in California, given the high property values. In contrast, property taxes in Newhall are lower, reflecting the lower property values compared to San Francisco.
Sales Tax
San Francisco has a higher sales tax (8.5%) due to the additional city tax on top of the state tax. Newhall has a lower sales tax which aligns with the California state sales tax rate.
Income
Type
San Francisco
Newhall
Estimated median household income
$121,826
$122,713
Estimated per capita income
$80,383
$50,120
Cost of living index (U.S. average is 100)
141.1
150.6
If you make $50,000 in San Francisco, you will have to make $53,366 in Newhall to maintain the same standard of living.
Geographical Conditions
San Francisco is characterized by steep hills and surrounded by the Pacific Ocean and the San Francisco Bay, adding to its scenic beauty. Newhall is situated in the Santa Clarita Valley, surrounded by a picturesque mountainous landscape.
Geographical information
Type
San Francisco
Newhall
Land area
46.7 sq. miles
496.7 sq. miles
Population density
17,458 people per sq. mile
388.5 people per sq. mile
Elevation
63 feet
1,272 feet
Relative area comparison
San Francisco, CA Newhall, CA
Education
San Francisco boasts many highly rated schools and universities, including the University of San Francisco and San Francisco State University. It's a hub for education and innovation. Newhall, on the other hand, has a fewer educational institutions but they maintain solid ratings, providing excellent schooling for younger students.
San Francisco serves as a hub for numerous industries including technology, finance, and tourism, providing vast employment opportunities. Newhall's economy, while less diverse, is robust with a focus on retail, healthcare, and education sectors, and benefits from its nearness to Los Angeles.
Biggest Employers
San Francisco's biggest employers include Salesforce, Wells Fargo, and Uber. In Newhall, some of the biggest employers are William S Hart Union High School District, Henry Mayo Newhall Hospital, and Princess Cruises.
In San Francisco (San Francisco County), 83.5% voted for Democrats and 13.0% for Republicans in 2012 Presidential Election. In Newhall (Los Angeles County), 69.7% voted for Democrats and 27.8% for Republicans.
Elections
Type
Democrats
Republicans
Other
Year
San Francisco
Newhall
San Francisco
Newhall
San Francisco
Newhall
2020
85.3%
71.0%
12.7%
26.9%
2.0%
2.1%
2016
84.6%
72.0%
9.2%
22.5%
6.2%
5.5%
2012
83.5%
69.7%
13.0%
27.8%
3.4%
2.4%
2008
84.4%
69.2%
13.7%
28.8%
2.0%
1.9%
2004
83.0%
63.3%
15.2%
35.7%
1.8%
1.0%
2000
75.7%
63.6%
16.1%
32.4%
8.1%
4.0%
1996
72.2%
59.3%
15.7%
31.0%
12.1%
9.7%
Breakdown of population affiliated with a religious congregation
Type
Adherents
Congregations
Religion
San Francisco
Newhall
San Francisco
Newhall
CATHOLIC CHURCH
15.0%
36.1%
9.6%
4.7%
EPISCOPAL CHURCH
0.8%
0.4%
3.5%
1.4%
MUSLIM ESTIMATE
0.8%
0.7%
1.2%
1.0%
SOUTHERN BAPTIST CONVENTION
0.7%
1.0%
8.4%
9.0%
AMERICAN BAPTIST CHURCHES IN THE USA
0.6%
0.5%
2.5%
3.1%
SEVENTH DAY ADVENTIST CHURCH
0.2%
0.5%
1.9%
2.4%
Weather
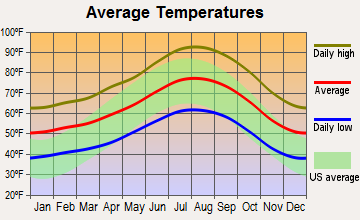
The weather in San Francisco is famously variable, often changing from foggy to sunny within the same day. The average temperature is quite moderate, rarely reaching extremes of hot or cold. Newhall, in contrast, experiences a warmer Mediterranean climate, with mild winters and hot, dry summers. Tourists visiting either city would need to pack accordingly.
Weather and climate
Type
San Francisco
Newhall
Temperature - Average
58.3°F
63°F
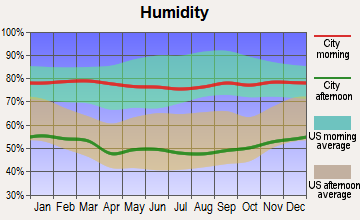
Humidity - Average morning or afternoon humidity
84.3%
63.9%
Humidity - Differences between morning and afternoon humidity
29%
18.6%
Humidity - Maximum monthly morning or afternoon humidity
91%
69.3%
Humidity - Minimum monthly morning or afternoon humidity
62%
50.7%
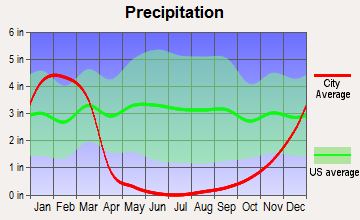
Precipitation - Yearly average
22.2 in
18.2 in
Snowfall - Yearly average
0 in
0 in
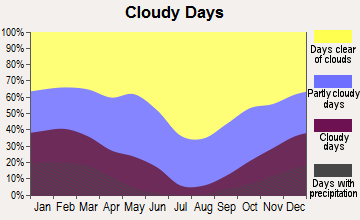
Clouds - Number of days clear of clouds
26.8%
27.8%
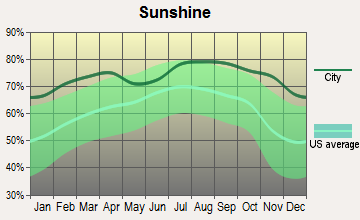
Sunshine amount - Average
73%
78.4%
Sunshine amount - Differences during a year
22%
21.9%
Sunshine amount - Maximum monthly
77%
84.9%
Sunshine amount - Minimum monthly
55%
63%
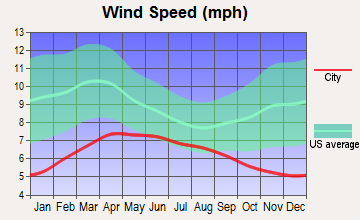
Wind speed - Average
11.4 mph
3.1 mph
Average climate in San Francisco, California
Average climate in Newhall, California
Air pollution
Type
AQI
CO
NO2
OZONE
PB
PM10
PM25
SO2
Year
San Francisco
Newhall
San Francisco
Newhall
San Francisco
Newhall
San Francisco
Newhall
San Francisco
Newhall
Newhall
San Francisco
Newhall
San Francisco
Newhall
2018
104
130
0.35
0.24
11.3
11.0
23.4
31.8
0.012
0.002
24.4
N/A
11.9
10.7
0.4
N/A
2017
96
129
0.40
0.27
11.4
10.7
22.5
33.7
0.008
0.002
25.0
N/A
9.9
10.6
0.6
N/A
2016
68
117
0.39
0.23
10.6
10.2
22.4
33.2
0.005
0.002
23.8
N/A
7.9
9.7
0.8
N/A
2015
85
123
0.41
0.21
12.1
11.9
22.5
33.7
0.004
0.001
21.8
N/A
7.9
9.1
0.8
N/A
2014
85
133
0.38
0.24
12.1
12.8
21.8
34.4
0.005
0.003
25.4
N/A
7.7
10.7
0.6
N/A
2013
88
134
0.40
0.24
13.9
14.5
20.4
34.6
0.004
0.004
24.8
N/A
10.2
10.0
0.5
0.3
2012
75
138
0.40
0.23
12.8
13.8
22.7
33.0
0.003
0.004
24.6
N/A
8.2
10.3
1.1
0.5
2011
86
135
0.24
0.25
14.1
13.9
21.3
31.7
0.003
0.006
24.3
N/A
9.5
13.0
1.7
0.5
2010
84
126
0.21
0.22
13.4
14.7
22.0
29.6
0.004
0.005
21.5
N/A
10.6
13.8
1.0
0.8
2009
95
147
0.30
0.26
15.1
15.5
20.4
30.8
0.005
0.006
N/A
N/A
12.8
14.6
1.1
0.5
2008
94
143
0.43
0.30
15.6
16.9
21.7
32.1
0.007
N/A
31.7
N/A
11.7
18.6
0.9
0.8
2007
84
117
0.45
0.35
15.6
19.9
20.5
29.5
0.007
0.008
N/A
N/A
8.9
N/A
1.2
1.0
2006
86
120
0.52
0.26
16.1
18.6
21.5
30.9
N/A
N/A
N/A
N/A
8.7
N/A
1.6
0.6
2005
89
127
0.39
0.35
14.8
19.5
20.5
29.5
N/A
N/A
N/A
N/A
8.8
N/A
1.3
1.6
2004
93
135
0.44
0.45
16.1
20.7
20.9
31.4
0.004
N/A
N/A
N/A
11.2
N/A
2.5
2.4
2003
65
142
0.64
0.50
18.4
21.6
19.7
31.9
N/A
N/A
N/A
N/A
N/A
N/A
1.7
1.3
2002
62
153
0.69
0.60
18.6
20.1
19.6
30.9
0.008
0.010
N/A
N/A
N/A
N/A
1.4
2.0
2001
64
133
0.72
0.73
19.2
23.0
19.0
26.8
0.008
0.011
N/A
N/A
N/A
N/A
1.4
0.7
2000
60
140
0.71
0.80
20.3
24.9
17.1
26.0
0.017
0.012
N/A
N/A
N/A
N/A
2.0
0.5
Natural disasters
Type
San Francisco
Newhall
Tornado activity compared to U.S. average
7.7%
11.9%
Earthquake activity compared to U.S. average
7,468.1%
7,354.1%
Natural disasters compared to U.S. average
6%
57%
Transportation
San Francisco has an extensive public transportation system, including buses, light rail, and the famous cable cars. In Newhall, commuting often involves driving, but the city also offers public transit options and is served by Metrolink, a regional commuter rail system.
Transport
Type
San Francisco
Newhall
Amtrak stations
4
0
Amtrak stations nearby
3
3
FAA registered aircraft
453
20
FAA registered aircraft manufacturers and dealers
9
0
Means of transportation to work
Type
San Francisco
Newhall
Bicycle
2.7%
0.4%
Bus
11.4%
1.9%
Carpooled
9.1%
13.7%
Car alone
53.9%
78.1%
Ferryboat
0.4%
0%
Motorcycle
0.9%
0.2%
Railroad
0.7%
0.8%
Streetcar
7.9%
0%
Subway
1.6%
0.1%
Taxicab
0.4%
0%
Walked
8.3%
1.3%
Average travel time to work
Type
San Francisco
Newhall
Average
38 min
34.2 min
Real Estate
The real estate market in San Francisco is highly competitive with high property values. The housing market in Newhall, in contrast, is more accessible, although still on the expensive side compared to the national average.
Neighborhoods
San Francisco offers a diverse range of neighborhoods each with unique cultural vibes such as nostalgia in Haight-Ashbury or the affluent Pacific Heights. Newhall maintains a community-focused, small town feel with family-oriented neighborhoods.
Houses and residents
Type
San Francisco
Newhall
Houses
412,269
64,094
Average household size (people)
2.3
3
Houses occupied
350,796 (85.1%)
61,472 (95.9%)
Houses occupied by owners
140,809 (40.1%)
45,056 (73.3%)
Houses occupied by renters
209,987 (59.9%)
16,416 (26.7%)
Median rent asked for vacant for-rent units
$3,809
$2,587
Median price asked for vacant for-sale houses and condos
$1,670,841
$1,138,428
Estimated median house or condo value
Over $1,000,000
$792,187
Median number of rooms in apartments
3.2
3.7
Median number of rooms in houses and condos
5.6
7.1
Renting percentage
64.2%
28.8%
Housing density (houses/condos per square mile)
8,829.1
129
Household income disparities
41.7%
34.9%
Housing units without a mortgage
1,778 (1.9%)
3,256 (8.5%)
Housing units with both a second mortgage and home equity loan
7,687 (8.3%)
166 (0.4%)
Housing units with a mortgage
91,236 (98.1%)
35,177 (91.5%)
Housing units with a home equity loan
471 (0.5%)
3,084 (8%)
Housing units with a second mortgage
9,395 (10.1%)
6,491 (16.9%)
Housing units lacking complete kitchen facilities
4.7%
0.5%
Housing units lacking complete plumbing facilities
Self-employed workers in own not incorporated business
30,288
6,940
State government workers
22,691
2,785
Unpaid family workers
399
293
Industries and Occupations
In San Francisco, information technology and finance are prevalent, attracting professionals from across the globe. The city is home to many start-ups and global corporations. Newhall's economy is diversified across several sectors including education, healthcare, and retail.
San Francisco is home to world-renowned healthcare facilities like the UCSF Medical Center, providing top-notch patient care and medical research. Newhall has quality healthcare facilities but may not offer the range of specialist services that San Francisco does.
Health (county statistics)
Type
San Francisco
Newhall
General health status score of residents in this county from 1 (poor) to 5 (excellent)
San Francisco boasts impressive infrastructure with a mix of historic and modern architecture. The city is well-planned, with efficient public utilities and services. Newhall, though smaller, offers clean, well-maintained infrastructure, exuding a more suburban charm.
Infrastructure
Type
San Francisco
Newhall
TV stations
18
6
Bank branches located here
281
4
Bank institutions located here
52
4
Schools
School facilities
Type
San Francisco
Newhall
Private elementary/middle schools
54
1
Private high schools
33
0
Public elementary/middle schools
90
6
Public high schools
31
1
Colleges/Universities
23
0
Culture and Food
San Francisco is known for its vibrant culture and diverse food scene which includes a wide international culinary experience. Newhall, whilst smaller, boasts a growing arts scene and a selection of uniquely local restaurants.
Sports Teams
San Francisco is home to major sports teams like the San Francisco 49ers (NFL) and the Giants (MLB). Newhall, however, does not host any major sports teams but local high schools have a rich tradition of sports activities.
 San Francisco, CA
 Newhall, CA