As both culturally diverse and economic locations, San Francisco and North Coast of California hold unique places in the Golden State. San Francisco is recognized for its high-paced technology-driven economy, vibrant cultural scene, and impressive landmarks. The North Coast, on the other hand, is known for its phenomenal natural beauty, wine industry, and a pace of life that's a bit slower than San Francisco's hustle and bustle. The comparison below lays emphasis on crucial aspects such as crime and safety, weather, cost of living, education, and more.
San Francisco's crime rate is higher than the national average, a factor that individuals considering relocation should note; however, the crime rate varies across the city's neighborhoods. For tourists, it's crucial to be cautious, especially in crowded and touristy areas. The North Coast, relatively speaking, has lower crime rates, however, it differs from town to town. In both areas, staying in well-lit, populated areas and being aware of your surroundings can bolster personal safety.
Cost of Living
San Francisco is one of the most expensive cities in the US in terms of cost of living, housing being the chief factor. Conversely, the cost of living in the North Coast, while higher than the national average, is significantly less than that in San Francisco, making it more appealing for some potential relocators.
Income Tax
California has a progressive income tax, so both San Francisco and North Coast residents will be taxed based on income levels. The rates can range from 1% to 13.3%, being one of the highest in the nation.
Property Tax
Property tax in San Francisco is around 0.76%, while in the North Coast, the average is around 0.63%. Despite the lower rate, the high property values in San Francisco can result in hefty tax bills.
Sales Tax
The sales tax in San Francisco is 8.5%, while in the communities of the North Coast, it can range from 7.25% to 8.75%. Both San Francisco and North Coast locales are within California, so the state sales tax remains constant at 7.25%.
Income
Type
San Francisco
North Coast
Estimated median household income
$121,826
$102,807
Estimated per capita income
$80,383
$50,809
Cost of living index (U.S. average is 100)
141.1
96.1
If you make $50,000 in North Coast, you will have to make $73,413 in San Francisco to maintain the same standard of living.
Geographical Conditions
San Francisco, situated on the tip of a peninsula surrounded by the Pacific Ocean and San Francisco Bay, is known for its hills and iconic landmarks like the Golden Gate Bridge. The North Coast boasts stunning natural beauty, with redwood forests, rugged coastline, and scenic vineyards.
Geographical information
Type
San Francisco
North Coast
Land area
46.7 sq. miles
59.4 sq. miles
Population density
17,458 people per sq. mile
6,335.5 people per sq. mile
Relative area comparison
San Francisco, CA North Coast, CA
Education
Both San Francisco and the North Coast house excellent public and private schools, as well as higher education institutions. Notably, San Francisco has prestigious universities such as the University of San Francisco and San Francisco State University. Meanwhile, North Coast is home to the notable Humboldt State University among others.
San Francisco is a vibrant economic hub with significant employment opportunities in the tech, finance, and healthcare sectors. North Coast's economy is more diverse, prominently featuring sectors like wine production, tourism, fishing, and logging.
Biggest Employers
The biggest employers in San Francisco include tech giants like Salesforce and Uber, while in the North Coast, the biggest employers come from the healthcare sector (like St. Joseph Health and Kaiser Permanente) and public sector employers such as the local county offices and schools.
In San Francisco (San Francisco County), 83.5% voted for Democrats and 13.0% for Republicans in 2012 Presidential Election. In North Coast (Orange County), 45.8% voted for Democrats and 52.0% for Republicans.
Elections
Type
Democrats
Republicans
Other
Year
San Francisco
North Coast
San Francisco
North Coast
San Francisco
North Coast
2020
85.3%
53.6%
12.7%
44.6%
2.0%
1.8%
2016
84.6%
50.9%
9.2%
42.4%
6.2%
6.7%
2012
83.5%
45.8%
13.0%
52.0%
3.4%
2.3%
2008
84.4%
47.8%
13.7%
50.3%
2.0%
1.9%
2004
83.0%
39.3%
15.2%
60.2%
1.8%
0.5%
2000
75.7%
40.4%
16.1%
55.9%
8.1%
3.7%
1996
72.2%
37.9%
15.7%
51.7%
12.1%
10.5%
Breakdown of population affiliated with a religious congregation
Type
Adherents
Congregations
Religion
San Francisco
North Coast
San Francisco
North Coast
CATHOLIC CHURCH
15.0%
26.5%
9.6%
4.4%
EPISCOPAL CHURCH
0.8%
0.4%
3.5%
1.4%
MUSLIM ESTIMATE
0.8%
0.8%
1.2%
1.3%
SOUTHERN BAPTIST CONVENTION
0.7%
2.3%
8.4%
8.8%
AMERICAN BAPTIST CHURCHES IN THE USA
0.6%
0.2%
2.5%
1.7%
EVANGELICAL LUTHERAN CHURCH IN AMERICA
0.2%
0.4%
1.7%
2.3%
LUTHERAN CHURCH
0.2%
0.6%
1.5%
2.0%
REFORMED CHURCH IN AMERICA
0.2%
0.3%
0.2%
0.2%
SEVENTH DAY ADVENTIST CHURCH
0.2%
0.4%
1.9%
1.3%
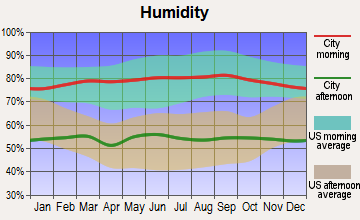
Weather
San Francisco has mild, moderate weather year-round, with cool, foggy summers and mild winters, whereas North Coast's weather is varied, offering cool coastal climates in towns like Mendocino, and warmer, more Mediterranean climates inland. This contrast offers tourists a lot of choices for vacation experiences.
Weather and climate
Type
San Francisco
North Coast
Temperature - Average
58.3°F
64.4°F
Humidity - Average morning or afternoon humidity
84.3%
70.2%
Humidity - Differences between morning and afternoon humidity
29%
26.7%
Humidity - Maximum monthly morning or afternoon humidity
91%
78.7%
Humidity - Minimum monthly morning or afternoon humidity
62%
52%
Precipitation - Yearly average
22.2 in
13 in
Snowfall - Yearly average
0 in
0 in
Clouds - Number of days clear of clouds
26.8%
26.5%
Sunshine amount - Average
73%
78.4%
Sunshine amount - Differences during a year
22%
21.9%
Sunshine amount - Maximum monthly
77%
84.9%
Sunshine amount - Minimum monthly
55%
62.9%
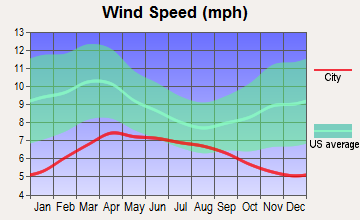
Wind speed - Average
11.4 mph
6 mph
Average climate in San Francisco, California
Average climate in North Coast, California
Air pollution
Type
AQI
CO
NO2
OZONE
PB
PM10
PM25
SO2
Year
San Francisco
North Coast
San Francisco
North Coast
San Francisco
North Coast
San Francisco
North Coast
San Francisco
North Coast
North Coast
San Francisco
North Coast
San Francisco
North Coast
2018
104
119
0.35
0.35
11.3
14.4
23.4
26.1
0.012
N/A
27.5
N/A
11.9
12.6
0.4
0.7
2017
96
116
0.40
0.34
11.4
13.8
22.5
28.8
0.008
N/A
26.7
N/A
9.9
13.8
0.6
0.5
2016
68
102
0.39
0.33
10.6
12.2
22.4
29.3
0.005
N/A
24.1
N/A
7.9
12.5
0.8
0.2
2015
85
106
0.41
0.32
12.1
13.2
22.5
29.8
0.004
N/A
25.0
N/A
7.9
14.5
0.8
0.2
2014
85
110
0.38
0.29
12.1
12.9
21.8
28.6
0.005
N/A
26.7
N/A
7.7
15.5
0.6
0.4
2013
88
107
0.40
0.34
13.9
13.9
20.4
27.8
0.004
0.003
29.5
N/A
10.2
14.2
0.5
0.3
2012
75
103
0.40
0.30
12.8
12.7
22.7
26.8
0.003
0.004
28.2
N/A
8.2
14.3
1.1
0.1
2011
86
109
0.24
0.31
14.1
14.7
21.3
27.0
0.003
0.006
27.7
N/A
9.5
15.9
1.7
0.7
2010
84
102
0.21
0.33
13.4
14.3
22.0
26.2
0.004
0.011
23.6
N/A
10.6
14.0
1.0
0.6
2009
95
118
0.30
0.35
15.1
15.5
20.4
27.6
0.005
0.009
24.3
N/A
12.8
14.5
1.1
1.1
2008
94
124
0.43
0.39
15.6
16.5
21.7
28.2
0.007
0.010
29.5
N/A
11.7
21.6
0.9
1.1
2007
84
100
0.45
0.36
15.6
16.3
20.5
27.0
0.007
0.012
N/A
N/A
8.9
N/A
1.2
0.8
2006
86
114
0.52
0.40
16.1
17.2
21.5
26.4
N/A
0.007
N/A
N/A
8.7
N/A
1.6
1.3
2005
89
95
0.39
0.39
14.8
17.7
20.5
27.9
N/A
0.012
N/A
N/A
8.8
N/A
1.3
1.3
2004
93
119
0.44
0.50
16.1
19.2
20.9
30.5
0.004
0.014
N/A
N/A
11.2
N/A
2.5
1.6
2003
65
122
0.64
0.64
18.4
21.9
19.7
28.9
N/A
0.030
N/A
N/A
N/A
N/A
1.7
1.1
2002
62
106
0.69
0.65
18.6
22.0
19.6
25.5
0.008
0.018
N/A
N/A
N/A
N/A
1.4
1.8
2001
64
116
0.72
0.73
19.2
22.0
19.0
25.4
0.008
0.033
N/A
N/A
N/A
N/A
1.4
1.5
2000
60
125
0.71
0.80
20.3
24.4
17.1
24.0
0.017
0.027
N/A
N/A
N/A
N/A
2.0
1.9
Natural disasters
Type
San Francisco
North Coast
Tornado activity compared to U.S. average
7.7%
18.6%
Earthquake activity compared to U.S. average
7,468.1%
6,843.6%
Natural disasters compared to U.S. average
6%
32%
Transportation
San Francisco boasts extensive public transportation options, including BART, Muni, and Caltrain. The North Coast, being more rural, has limited public transportation. Car travel is more common, which could significantly impact commuting times.
Transport
Type
San Francisco
North Coast
Amtrak stations
4
0
Amtrak stations nearby
3
3
FAA registered aircraft
453
0
FAA registered aircraft manufacturers and dealers
9
0
Means of transportation to work
Type
San Francisco
North Coast
Bicycle
2.7%
0.7%
Bus
11.4%
1.2%
Carpooled
9.1%
10.7%
Car alone
53.9%
81.4%
Ferryboat
0.4%
0%
Motorcycle
0.9%
0.2%
Railroad
0.7%
0%
Streetcar
7.9%
0%
Subway
1.6%
0%
Taxicab
0.4%
0%
Walked
8.3%
1.4%
Average travel time to work
Type
San Francisco
North Coast
Average
38 min
28.8 min
Real Estate
Real estate in San Francisco is notoriously expensive, with median home prices much higher than the national average. On the North Coast, while housing prices are more affordable than in San Francisco, they are still higher than the national average.
Neighborhoods
San Francisco is known for its diverse, eclectic neighborhoods, each possessing unique vibes and characteristics. The North Coast is dotted with small quaint towns —some notable ones include Arcata, Eureka, and Fort Bragg, which have distinct personalities and charm.
Houses and residents
Type
San Francisco
North Coast
Houses
412,269
137,450
Average household size (people)
2.3
2.7
Houses occupied
350,796 (85.1%)
133,254 (96.9%)
Houses occupied by owners
140,809 (40.1%)
84,546 (63.4%)
Houses occupied by renters
209,987 (59.9%)
48,708 (36.6%)
Median rent asked for vacant for-rent units
$3,809
$2,340
Median price asked for vacant for-sale houses and condos
$1,670,841
$1,099,558
Estimated median house or condo value
Over $1,000,000
$883,291
Median number of rooms in apartments
3.2
3.9
Median number of rooms in houses and condos
5.6
6.1
Renting percentage
64.2%
37.7%
Housing density (houses/condos per square mile)
8,829.1
2,312.7
Household income disparities
41.7%
41.2%
Housing units without a mortgage
1,778 (1.9%)
13,396 (19.5%)
Housing units with both a second mortgage and home equity loan
7,687 (8.3%)
282 (0.4%)
Housing units with a mortgage
91,236 (98.1%)
55,188 (80.5%)
Housing units with a home equity loan
471 (0.5%)
6,297 (9.2%)
Housing units with a second mortgage
9,395 (10.1%)
7,643 (11.1%)
Housing units lacking complete kitchen facilities
4.7%
1%
Housing units lacking complete plumbing facilities
Self-employed workers in own not incorporated business
30,288
15,532
State government workers
22,691
5,751
Unpaid family workers
399
744
Industries and Occupations
In San Francisco, the predominant industries are tech, finance, healthcare, and tourism. For the North Coast, wine production, the fishing industry, and the tourist sector are paramount.
San Francisco offers top-notch healthcare with state-of-the-art medical facilities including UCSF Medical center, and Kaiser Permanente. The North Coast has reputable healthcare facilities too, although access to specialty care can sometimes require travel to larger cities.
Health (county statistics)
Type
San Francisco
North Coast
General health status score of residents in this county from 1 (poor) to 5 (excellent)
San Francisco offers robust infrastructure, with an array of bridges, public transit options, airports, and an expansive healthcare system. North Coast's infrastructure, while not as extensive, is sufficient for its population; however, access to high-speed internet can be a challenge in some areas.
Infrastructure
Type
San Francisco
North Coast
TV stations
18
2
Culture and Food
San Francisco offers a rich, diverse cultural scene and foodie paradise, ranging from Chinatown to Michelin-starred restaurants. The North Coast offers a more laid-back, wine-and-cheese culture, with a plethora of wineries and farm-to-table restaurants.
Sports Teams
San Francisco hosts renowned sports franchises such as the 49ers (NFL) and Giants (MLB). While the North Coast does not host major league teams, college sports, particularly at Humboldt State University, have a strong following.
 San Francisco, CA
 North Coast, CA