Perris Valley and San Francisco are two distinct Californian cities with vastly different experiences and opportunities. San Francisco, a bustling city and cultural hub, is recognized for its technological advancements and cultural diversity while Perris Valley, also known as Perris, maintains a quieter, more rural lifestyle. The two cities provide contrast regarding cost of living, employment, amenities, and cultural experiences.
In general, San Francisco has a higher crime rate than Perris. Violent crime is significantly higher in San Francisco, but property crime is comparable in both cities. These statistics, however, are influenced by San Francisco's larger population and dense urban environment. Both cities have implemented community measures to enhance safety.
Cost of Living
San Francisco boasts one of the highest costs of living in the United States, driven by high housing costs, taxes, and everyday expenses. Conversely, Perris has a more affordable cost of living, although it's still higher than the national average. It’s important to note both cities have different opportunities in terms of amenities and employment which are reflected in the cost of living.
Income Tax
In California, both cities are subjected to the same state income tax; however, the higher average salary in San Francisco may push residents into a higher tax bracket.
Property Tax
Property tax also varies greatly due to the difference in home prices, with San Francisco's higher property values resulting in higher taxes than Perris.
Sales Tax
Even though California as a state imposes the same sales tax across its cities, San Francisco charges an additional district tax, making the overall sales tax higher compared to Perris.
Income
Type
San Francisco
Perris Valley
Estimated median household income
$121,826
$71,187
Estimated per capita income
$80,383
$27,699
Cost of living index (U.S. average is 100)
141.1
85.6
If you make $50,000 in Perris Valley, you will have to make $82,418 in San Francisco to maintain the same standard of living.
Geographical Conditions
San Francisco is located on a peninsula surrounded by the Pacific Ocean and San Francisco Bay, offering stunning natural beauty and outdoor activities. Perris, located inland, boasts beautiful landscapes and access to outdoor recreation in the nearby Lake Perris and the Perris Valley Skydiving School.
Geographical information
Type
San Francisco
Perris Valley
Land area
46.7 sq. miles
276.5 sq. miles
Population density
17,458 people per sq. mile
689.3 people per sq. mile
Relative area comparison
San Francisco, CA Perris Valley, CA
Education
In terms of education, San Francisco offers better opportunities with a plethora of renowned universities and public schools. However, Perris also offers quality education through public and private schools and its accessibility to nearby colleges and universities.
San Francisco’s economy is diverse, with strong sectors in technology, finance, and tourism. The city is home to numerous Fortune 500 companies. Perris's economy is based largely on logistics, manufacturing, and retail, with a significant number of jobs in local government and healthcare.
Biggest Employers
In San Francisco, Salesforce and Wells Fargo are among the biggest employers, while in Perris, Walmart and Ross Dress For Less lead the employment sector.
In San Francisco (San Francisco County), 83.5% voted for Democrats and 13.0% for Republicans in 2012 Presidential Election. In Perris Valley (Riverside County), 49.6% voted for Democrats and 48.0% for Republicans.
Elections
Type
Democrats
Republicans
Other
Year
San Francisco
Perris Valley
San Francisco
Perris Valley
San Francisco
Perris Valley
2020
85.3%
53.0%
12.7%
45.0%
2.0%
2.0%
2016
84.6%
49.7%
9.2%
44.4%
6.2%
5.9%
2012
83.5%
49.6%
13.0%
48.0%
3.4%
2.4%
2008
84.4%
50.4%
13.7%
48.1%
2.0%
1.5%
2004
83.0%
41.3%
15.2%
58.2%
1.8%
0.6%
2000
75.7%
45.0%
16.1%
51.6%
8.1%
3.4%
1996
72.2%
43.0%
15.7%
45.6%
12.1%
11.3%
Breakdown of population affiliated with a religious congregation
Type
Adherents
Congregations
Religion
San Francisco
Perris Valley
San Francisco
Perris Valley
CATHOLIC CHURCH
15.0%
27.5%
9.6%
4.5%
EPISCOPAL CHURCH
0.8%
0.2%
3.5%
1.4%
MUSLIM ESTIMATE
0.8%
0.5%
1.2%
0.7%
SOUTHERN BAPTIST CONVENTION
0.7%
1.2%
8.4%
11.2%
AMERICAN BAPTIST CHURCHES IN THE USA
0.6%
0.0%
2.5%
0.7%
SEVENTH DAY ADVENTIST CHURCH
0.2%
0.9%
1.9%
3.4%
Weather
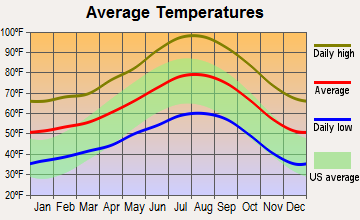
The weather also differs drastically; San Francisco has a mild climate with warm, dry summers and cool, wet winters. In contrast, Perris experiences a more severe Mediterranean climate with hotter summers and colder winters. San Francisco's coastal location ensures a regular, cooling fog whereas Perris's more inland location results in less moderating influence from the ocean.
Weather and climate
Type
San Francisco
Perris Valley
Temperature - Average
58.3°F
64.1°F
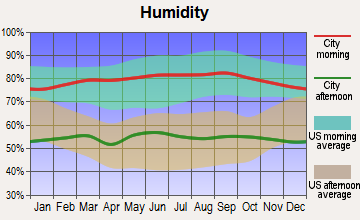
Humidity - Average morning or afternoon humidity
84.3%
68%
Humidity - Differences between morning and afternoon humidity
29%
22.4%
Humidity - Maximum monthly morning or afternoon humidity
91%
75.1%
Humidity - Minimum monthly morning or afternoon humidity
62%
52.7%
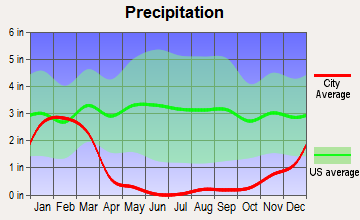
Precipitation - Yearly average
22.2 in
11.5 in
Snowfall - Yearly average
0 in
0 in
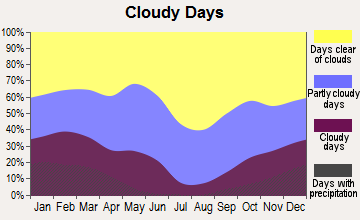
Clouds - Number of days clear of clouds
26.8%
27.1%
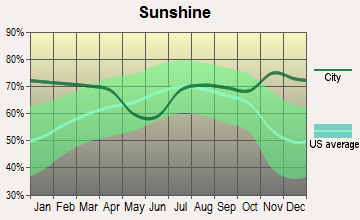
Sunshine amount - Average
73%
77.6%
Sunshine amount - Differences during a year
22%
20.5%
Sunshine amount - Maximum monthly
77%
82%
Sunshine amount - Minimum monthly
55%
61.5%
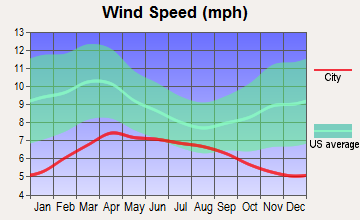
Wind speed - Average
11.4 mph
5 mph
Average climate in San Francisco, California
Average climate in Perris Valley, California
Air pollution
Type
AQI
CO
NO2
OZONE
PB
PM10
PM25
SO2
Year
San Francisco
Perris Valley
San Francisco
Perris Valley
San Francisco
Perris Valley
San Francisco
Perris Valley
San Francisco
Perris Valley
Perris Valley
San Francisco
Perris Valley
San Francisco
Perris Valley
2018
104
154
0.35
0.28
11.3
9.3
23.4
33.0
0.012
0.006
27.9
N/A
11.9
8.9
0.4
0.5
2017
96
146
0.40
0.28
11.4
8.7
22.5
33.0
0.008
0.004
28.9
N/A
9.9
11.4
0.6
0.3
2016
68
143
0.39
0.25
10.6
8.9
22.4
31.6
0.005
0.006
27.6
N/A
7.9
11.0
0.8
0.2
2015
85
145
0.41
0.22
12.1
9.0
22.5
31.6
0.004
0.004
25.5
N/A
7.9
11.6
0.8
0.3
2014
85
148
0.38
0.24
12.1
10.5
21.8
32.6
0.005
0.006
31.9
N/A
7.7
13.6
0.6
0.3
2013
88
150
0.40
0.24
13.9
10.8
20.4
32.4
0.004
0.006
30.8
N/A
10.2
11.7
0.5
0.2
2012
75
145
0.40
0.23
12.8
11.3
22.7
31.4
0.003
0.007
28.3
N/A
8.2
12.1
1.1
0.2
2011
86
149
0.24
0.26
14.1
11.7
21.3
31.0
0.003
0.006
30.1
N/A
9.5
13.2
1.7
0.3
2010
84
146
0.21
0.29
13.4
12.3
22.0
31.4
0.004
0.008
27.8
N/A
10.6
13.3
1.0
1.3
2009
95
151
0.30
0.26
15.1
14.3
20.4
31.3
0.005
0.010
30.8
N/A
12.8
13.8
1.1
1.6
2008
94
155
0.43
0.34
15.6
14.9
21.7
32.3
0.007
0.011
40.0
N/A
11.7
12.0
0.9
0.9
2007
84
125
0.45
0.41
15.6
15.6
20.5
31.8
0.007
0.013
N/A
N/A
8.9
N/A
1.2
1.5
2006
86
126
0.52
0.37
16.1
16.2
21.5
30.9
N/A
0.007
N/A
N/A
8.7
N/A
1.6
1.3
2005
89
129
0.39
0.35
14.8
15.7
20.5
25.4
N/A
0.012
N/A
N/A
8.8
N/A
1.3
3.4
2004
93
137
0.44
0.42
16.1
15.5
20.9
30.2
0.004
0.013
N/A
N/A
11.2
N/A
2.5
3.4
2003
65
140
0.64
0.57
18.4
18.3
19.7
31.9
N/A
0.020
N/A
N/A
N/A
N/A
1.7
2.2
2002
62
138
0.69
0.57
18.6
18.3
19.6
33.2
0.008
0.015
N/A
N/A
N/A
N/A
1.4
0.1
2001
64
145
0.72
0.79
19.2
19.2
19.0
32.5
0.008
0.052
N/A
N/A
N/A
N/A
1.4
0.8
2000
60
157
0.71
0.83
20.3
18.4
17.1
28.8
0.017
0.033
N/A
N/A
N/A
N/A
2.0
1.1
Natural disasters
Type
San Francisco
Perris Valley
Tornado activity compared to U.S. average
7.7%
16.2%
Earthquake activity compared to U.S. average
7,468.1%
7,175.7%
Natural disasters compared to U.S. average
6%
46%
Transportation
San Francisco boasts an excellent public transportation system, including buses, light rail, ferries and the iconic cable cars, reducing commuting stress. In Perris, public transport is less prevalent, leading to a higher dependence on cars.
Transport
Type
San Francisco
Perris Valley
Amtrak stations
4
0
Amtrak stations nearby
3
3
FAA registered aircraft
453
0
FAA registered aircraft manufacturers and dealers
9
0
Means of transportation to work
Type
San Francisco
Perris Valley
Bicycle
2.7%
0.3%
Bus
11.4%
1%
Carpooled
9.1%
18%
Car alone
53.9%
73.6%
Ferryboat
0.4%
0%
Motorcycle
0.9%
0.1%
Railroad
0.7%
0.2%
Streetcar
7.9%
0%
Subway
1.6%
0.1%
Taxicab
0.4%
0.1%
Walked
8.3%
1.4%
Average travel time to work
Type
San Francisco
Perris Valley
Average
38 min
37 min
Real Estate
San Francisco’s real estate market is one of the most expensive in the U.S., but housing in Perris is more affordable. However, both cities have seen significant growth rates in recent years.
Neighborhoods
San Francisco's neighborhoods are diverse, from the buzzing Mission District to the peaceful Presidio. Perris offers a quieter atmosphere with its suburban neighborhoods and rural scenery.
Houses and residents
Type
San Francisco
Perris Valley
Houses
412,269
51,323
Average household size (people)
2.3
3.4
Houses occupied
350,796 (85.1%)
46,991 (91.6%)
Houses occupied by owners
140,809 (40.1%)
36,693 (78.1%)
Houses occupied by renters
209,987 (59.9%)
10,298 (21.9%)
Median rent asked for vacant for-rent units
$3,809
$1,322
Median price asked for vacant for-sale houses and condos
$1,670,841
$464,486
Estimated median house or condo value
Over $1,000,000
$376,802
Median number of rooms in apartments
3.2
5.7
Median number of rooms in houses and condos
5.6
6.2
Renting percentage
64.2%
27.2%
Housing density (houses/condos per square mile)
8,829.1
185.6
Household income disparities
41.7%
42.4%
Housing units without a mortgage
1,778 (1.9%)
6,227 (22.3%)
Housing units with both a second mortgage and home equity loan
7,687 (8.3%)
116 (0.4%)
Housing units with a mortgage
91,236 (98.1%)
21,647 (77.7%)
Housing units with a home equity loan
471 (0.5%)
962 (3.5%)
Housing units with a second mortgage
9,395 (10.1%)
3,573 (12.8%)
Housing units lacking complete kitchen facilities
4.7%
1.1%
Housing units lacking complete plumbing facilities
Self-employed workers in own not incorporated business
30,288
4,282
State government workers
22,691
1,900
Unpaid family workers
399
195
Industries and Occupations
Technology, finance, and healthcare dominate the industries in San Francisco, attracting global talent while Perris's economy is pivoted around logistics, manufacturing, and public services.
San Francisco provides a range of healthcare facilities, including some of the top hospitals in the country. Perris offers quality healthcare services, although might not have the same diversity and specialty centers as can be found in San Francisco.
Health (county statistics)
Type
San Francisco
Perris Valley
General health status score of residents in this county from 1 (poor) to 5 (excellent)
San Francisco excels in infrastructure with its extensive public transit system and numerous highways, bridges, and airports. Perris has a less complex infrastructure, suitable for its comparatively smaller population, but has adequate services including highways, rail services, and airport connectivity.
Infrastructure
Type
San Francisco
Perris Valley
TV stations
18
4
Culture and Food
San Francisco is known globally for its cultural diversity and culinary scene, from vibrant food festivals to world-class restaurants. Perris has a comparatively simpler food scene, reflective of its small-town character.
Sports Teams
San Francisco boasts several professional sports teams including the San Francisco 49ers and Giants. While Perris doesn't host any professional sports teams, residents enjoy access to surrounding teams in southern California.
 San Francisco, CA
 Perris Valley, CA