San Francisco, California, and Raleigh, North Carolina, are two distinct cities offering varied experiences regarding the cost of living, education, culture, and more. San Francisco is well-known for its booming tech industry, high cost of living, cultural diversity, and scenic beauty. In contrast, Raleigh is recognized for its lower cost of living, a strong education system, and a more laid-back lifestyle. The following comparison will delve into specific areas more comprehensively.
Distance between
San Francisco, CA and
Raleigh, NC : 2,404.6 miles
San Francisco's population is larger by 74%. Its population has grown by 38,468 people (5.0%) since 2000. The population of Raleigh has grown by 193,031 people (69.9%) during that time.
San Francisco has a higher crime rate compared to Raleigh, with property crimes being the most prevalent. However, violent crimes are not uncommon. Raleigh, on the other hand, boasts a lower crime rate, contributing to a safer living environment. This makes Raleigh particularly appealing for families and retirees looking for a safer place to live. Regardless, tourists visiting either city are encouraged to stay vigilant and keep personal belongings secure.
City-data.com crime index counts serious crimes and violent crime more heavily. It adjusts for the number of visitors and daily workers commuting into cities. (higher means more crime, U.S. average = 301.1)
City-data.com crime index counts serious crimes and violent crime more heavily. It adjusts for the number of visitors and daily workers commuting into cities. (higher means more crime, U.S. average = 301.1)
Sex Offenders
According to our data, there are 586 registered sex offenders living in San Francisco and 2,165 registered sex offenders living in . The ratio of residents to sex offenders in San Francisco is 1,486 to 1; the ratio in Raleigh is 212 to 1. The number of registered sex offenders compared to the number of residents is a lot smaller in San Francisco than in Raleigh.
Cost of Living
Living in San Francisco comes with a significantly higher cost of living. Housing is notably expensive, as are general expenses, including groceries and transportation. Raleigh presents a more affordable alternative, with lower housing costs and overall living expenses, making it a more appealing option for many families and individuals.
Income Tax
California has one of the highest state income tax rates in the country, reaching up to 13.3%, whereas North Carolina has a flat rate of 5.25%. This difference could significantly impact individuals’ take-home pay and overall cost of living.
Property Tax
Property taxes in San Francisco are lower than the U.S. average at around 0.6%, but high property values raise the tax bill. In Raleigh, the property tax rate is higher at about 0.86%, but lower property values help keep overall tax bills more manageable.
Sales Tax
San Francisco has a sales tax rate of 8.5%, while Raleigh has a slightly lower rate of 7.25%. This could factor into the cost of living and influence the decision to relocate or visit these cities.
Income
Type
San Francisco
Raleigh
Estimated median household income
$121,826
$74,612
Estimated per capita income
$80,383
$44,001
Cost of living index (U.S. average is 100)
141.1
95.1
If you make $50,000 in Raleigh, you will have to make $74,185 in San Francisco to maintain the same standard of living.
Geographical Conditions
San Francisco is situated on the coast of California, with a hilly landscape that provides stunning views of the Bay Area. Raleigh offers a mix of urban and suburban settings, with proximity to both the mountains and the coast, making it an ideal spot for outdoor enthusiasts.
Both cities host strong education systems. San Francisco is home to several prestigious schools and universities, including the University of California, San Francisco. Raleigh is part of North Carolina's "Research Triangle," hosting numerous notable universities such as North Carolina State University and Duke University, making it a great place for academic pursuits.
San Francisco’s economy is strong, primarily led by the tech industry, with many renowned companies like Salesforce, Uber, and Twitter headquartered here. Raleigh's economy is also robust, with growth in areas like technology, medicine, and education, supported by the presence of Research Triangle Park, a major center for high-tech and biotech research.
Biggest Employers
In San Francisco, the biggest employers are Salesforce, the City of San Francisco, and the University of California, San Francisco. Raleigh's largest employers including North Carolina State University, WakeMed Health & Hospitals, and IBM Corporation, providing ample job opportunities.
There were 33 building permits issued in San Francisco in 2012 (2 more than in 2011) compared to 1,354 building permits issued in Raleigh in 2012 (366 more than in 2011).
In San Francisco (San Francisco County), 83.5% voted for Democrats and 13.0% for Republicans in 2012 Presidential Election. In Raleigh (Wake County), 54.9% voted for Democrats and 43.5% for Republicans.
Elections
Type
Democrats
Republicans
Other
Year
San Francisco
Raleigh
San Francisco
Raleigh
San Francisco
Raleigh
2020
85.3%
62.3%
12.7%
35.9%
2.0%
1.8%
2016
84.6%
57.4%
9.2%
37.2%
6.2%
5.5%
2012
83.5%
54.9%
13.0%
43.5%
3.4%
1.6%
2008
84.4%
56.8%
13.7%
42.3%
2.0%
0.9%
2004
83.0%
48.7%
15.2%
50.9%
1.8%
0.4%
2000
75.7%
46.1%
16.1%
53.2%
8.1%
0.7%
1996
72.2%
45.9%
15.7%
48.2%
12.1%
5.9%
Breakdown of population affiliated with a religious congregation
Type
Adherents
Congregations
Religion
San Francisco
Raleigh
San Francisco
Raleigh
CATHOLIC CHURCH
15.0%
11.0%
9.6%
2.4%
EPISCOPAL CHURCH
0.8%
1.1%
3.5%
1.8%
MUSLIM ESTIMATE
0.8%
1.1%
1.2%
1.0%
SOUTHERN BAPTIST CONVENTION
0.7%
9.0%
8.4%
22.5%
AMERICAN BAPTIST CHURCHES IN THE USA
0.6%
0.4%
2.5%
0.6%
EVANGELICAL LUTHERAN CHURCH IN AMERICA
0.2%
0.6%
1.7%
1.1%
LUTHERAN CHURCH
0.2%
0.4%
1.5%
0.6%
Weather
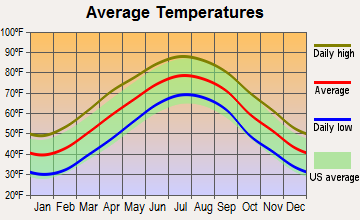
San Francisco has a mild climate with little temperature variation throughout the year. Fog and cool summers are characteristic, with temperatures rarely surpassing 70 degrees. Raleigh experiences a more varied climate, with hot, humid summers and cold winters. Spring and fall bring mild temperatures, which are generally preferred by residents and visitors alike.
Weather and climate
Type
San Francisco
Raleigh
Temperature - Average
58.3°F
59.8°F
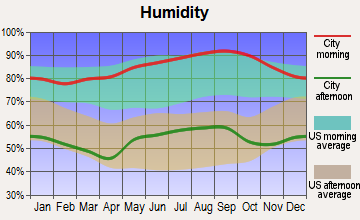
Humidity - Average morning or afternoon humidity
84.3%
73.7%
Humidity - Differences between morning and afternoon humidity
29%
44%
Humidity - Maximum monthly morning or afternoon humidity
91%
90%
Humidity - Minimum monthly morning or afternoon humidity
62%
46%
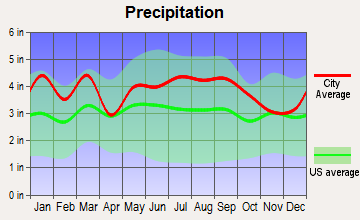
Precipitation - Yearly average
22.2 in
46.2 in
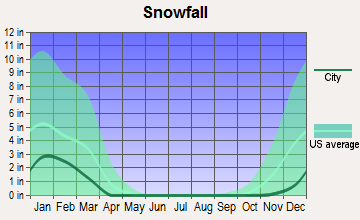
Snowfall - Yearly average
0 in
13.4 in
Clouds - Number of days clear of clouds
26.8%
18.5%
Sunshine amount - Average
73%
63.9%
Sunshine amount - Differences during a year
22%
13%
Sunshine amount - Maximum monthly
77%
64%
Sunshine amount - Minimum monthly
55%
51%
Wind speed - Average
11.4 mph
7.1 mph
Average climate in San Francisco, California
Average climate in Raleigh, North Carolina
Air pollution
Type
AQI
CO
NO2
OZONE
PB
PM10
PM25
SO2
Year
San Francisco
Raleigh
San Francisco
Raleigh
San Francisco
Raleigh
San Francisco
Raleigh
San Francisco
Raleigh
San Francisco
Raleigh
San Francisco
Raleigh
2018
104
71
0.35
0.23
11.3
4.9
23.4
27.5
0.012
N/A
14.6
N/A
11.9
9.5
0.4
0.2
2017
96
70
0.40
0.23
11.4
5.5
22.5
25.8
0.008
N/A
14.7
N/A
9.9
9.3
0.6
0.2
2016
68
80
0.39
0.23
10.6
5.6
22.4
26.9
0.005
N/A
8.7
N/A
7.9
10.0
0.8
0.3
2015
85
79
0.41
0.27
12.1
5.7
22.5
28.6
0.004
N/A
12.4
N/A
7.9
11.0
0.8
0.3
2014
85
74
0.38
0.26
12.1
6.0
21.8
29.9
0.005
N/A
N/A
N/A
7.7
11.2
0.6
0.3
2013
88
72
0.40
0.26
13.9
N/A
20.4
26.9
0.004
N/A
N/A
N/A
10.2
10.7
0.5
0.4
2012
75
80
0.40
0.28
12.8
N/A
22.7
29.7
0.003
N/A
N/A
N/A
8.2
9.5
1.1
0.6
2011
86
84
0.24
0.27
14.1
N/A
21.3
32.9
0.003
N/A
N/A
N/A
9.5
10.3
1.7
0.7
2010
84
89
0.21
0.30
13.4
N/A
22.0
32.4
0.004
N/A
N/A
N/A
10.6
10.9
1.0
1.0
2009
95
77
0.30
0.30
15.1
N/A
20.4
27.8
0.005
N/A
N/A
N/A
12.8
10.3
1.1
1.0
2008
94
99
0.43
0.36
15.6
N/A
21.7
32.3
0.007
N/A
N/A
N/A
11.7
12.5
0.9
1.4
2007
84
98
0.45
0.40
15.6
N/A
20.5
35.7
0.007
N/A
N/A
N/A
8.9
13.9
1.2
1.2
2006
86
90
0.52
0.44
16.1
N/A
21.5
31.9
N/A
N/A
N/A
N/A
8.7
13.5
1.6
0.9
2005
89
80
0.39
0.38
14.8
N/A
20.5
33.9
N/A
N/A
N/A
N/A
8.8
N/A
1.3
2.5
2004
93
82
0.44
0.40
16.1
N/A
20.9
28.4
0.004
N/A
N/A
N/A
11.2
N/A
2.5
2.6
2003
65
82
0.64
N/A
18.4
N/A
19.7
29.9
N/A
N/A
N/A
N/A
N/A
N/A
1.7
3.0
2002
62
89
0.69
N/A
18.6
N/A
19.6
36.1
0.008
N/A
N/A
N/A
N/A
N/A
1.4
2.6
2001
64
128
0.72
N/A
19.2
N/A
19.0
34.5
0.008
N/A
N/A
N/A
N/A
N/A
1.4
N/A
2000
60
115
0.71
0.64
20.3
N/A
17.1
34.1
0.017
N/A
N/A
N/A
N/A
N/A
2.0
N/A
Natural disasters
Type
San Francisco
Raleigh
Tornado activity compared to U.S. average
7.7%
95.1%
Earthquake activity compared to U.S. average
7,468.1%
52.6%
Natural disasters compared to U.S. average
6%
18%
Transportation
San Francisco offers a range of viable public transport options, including BART, Muni, and ferries, whereas Raleigh’s public transit consists mainly of buses. Both cities are bike-friendly, but San Francisco's hilly terrain may be a challenge. Traffic can be problematic in both cities, though it is more severe in San Francisco.
Transport
Type
San Francisco
Raleigh
Amtrak stations
4
1
Amtrak stations nearby
3
3
FAA registered aircraft
453
499
FAA registered aircraft manufacturers and dealers
9
12
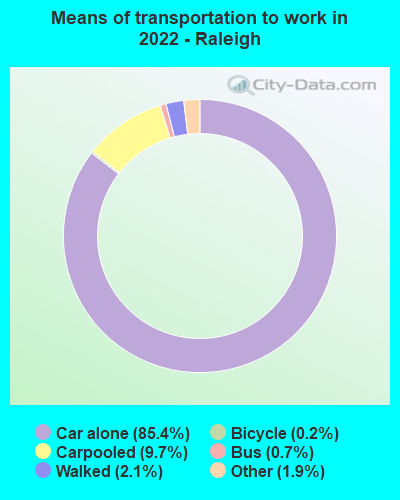
Means of transportation to work
Type
San Francisco
Raleigh
Bicycle
2.7%
0.2%
Bus
11.4%
1.1%
Carpooled
9.1%
8.5%
Car alone
53.9%
87.4%
Ferryboat
0.4%
0.1%
Motorcycle
0.9%
0.1%
Railroad
0.7%
0%
Streetcar
7.9%
0%
Subway
1.6%
0%
Taxicab
0.4%
0.3%
Walked
8.3%
1.1%
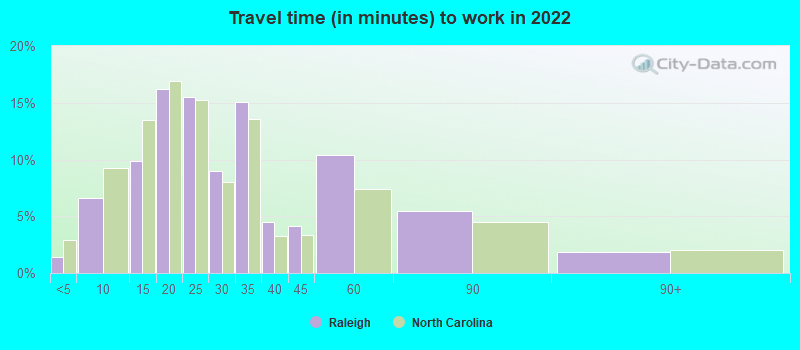
Average travel time to work
Type
San Francisco
Raleigh
Average
38 min
29.4 min
Other means
28.3 min
22.5 min
Public transportation
39.7 min
39.9 min
Private vehicle occupancy
Type
San Francisco
Raleigh
Average
1.2
1.1
Drove alone
85.5%
90.1%
In 2 person carpool
10.1%
7.6%
In 3 person carpool
3.2%
1.4%
In 4 person carpool
0.9%
0.3%
In 5-6 person carpool
0.2%
0.6%
In 7+ person carpool
0.1%
0.1%
How many people usually rode to work in the car, truck or van.
Real Estate
San Francisco's real estate market is one of the most expensive in the country, with high-demand and low-inventory making it fiercely competitive. Conversely, Raleigh's real estate market is more affordable and less competitive, providing a much greater opportunity for home ownership.
Neighborhoods
San Francisco is known for its diverse neighborhoods, each with a distinct charm, including The Mission, The Marina, and North Beach. Raleigh also boasts a number of appealing neighborhoods, such as West Raleigh, North Raleigh, and Downtown, appreciated for their security, green spaces, and family-friendly ambience.
Houses and residents
Type
San Francisco
Raleigh
Houses
412,269
217,866
Average household size (people)
2.3
2.4
Median year apartment built
1953
1995
Median year house/condo built
1942
1995
Length of stay in the house since moving in
16.3 years
11.5 years
Houses occupied
350,796 (85.1%)
194,917 (89.5%)
Houses occupied by owners
140,809 (40.1%)
103,367 (53%)
Houses occupied by renters
209,987 (59.9%)
91,550 (47%)
Median rent asked for vacant for-rent units
$3,809
$1,740
Median monthly housing costs
$2,337
$1,298
Median price asked for vacant for-sale houses and condos
$1,670,841
$302,120
Estimated median house or condo value
Over $1,000,000
$340,200
Median numbers of rooms
3.9
5.1
Median number of rooms in apartments
3.2
3.9
Median number of rooms in houses and condos
5.6
6.7
Median house price - detached houses
Over $1,000,000
$446,507
Median house price - in 2-unit structures
Over $1,000,000
$403,968
Median house price - in 3-to-4-unit structures
Over $1,000,000
$170,635
Median house price - in 5 or more unit structures
Over $1,000,000
$306,998
Median house price - mobile homes
$517,939
$31,622
Median house price - Townhouses or other attached units
Over $1,000,000
$292,086
Median house price - All housing units
Over $1,000,000
$404,828
Median house age
76
26
Renting percentage
64.2%
46.5%
Housing density (houses/condos per square mile)
8,829.1
1,901.1
House value disparities
18.7%
30.8%
Household income disparities
41.7%
45.4%
Median household income for houses/condes with a mortgage
$210,544
$114,680
Median household income for apartments without a mortgage
$99,969
$81,716
Housing units without a mortgage
1,778 (1.9%)
1,689 (2.1%)
Housing units with both a second mortgage and home equity loan
7,687 (8.3%)
6,627 (8.2%)
Housing units with a mortgage
91,236 (98.1%)
78,923 (97.9%)
Housing units with a home equity loan
471 (0.5%)
0 (0%)
Housing units with a second mortgage
9,395 (10.1%)
7,783 (9.7%)
House/condo owner moved in on average (years ago)
14
8
House/condo renter moved in on average (years ago)
4
1
Housing units lacking complete kitchen facilities
4.7%
0.6%
Housing units lacking complete plumbing facilities
2.7%
0.5%
Housing units in structures
Housing units in structures
San Francisco
Raleigh
One, detached
19.1%
45.0%
One, attached
12.1%
14.0%
Two
9.0%
1.2%
3 or 4
11.4%
4.6%
5 to 9
9.0%
6.3%
10 to 19
9.3%
12.4%
20 to 49
11.3%
6.0%
50 or more
18.7%
9.2%
Mobile homes
0.1%
1.2%
Median real estate property taxes paid for housing units
Self-employed workers in own not incorporated business
30,288
12,488
State government workers
22,691
19,792
Unpaid family workers
399
523
Industries and Occupations
In San Francisco, the prominent industries are technology, healthcare, and finance. Raleigh's leading industries include technology, healthcare, education, and public administration. Both cities offer a varied job market with opportunities for growth and advancement.
San Francisco boasts some of the top hospitals in the country, including UCSF Medical Center and Saint Francis Memorial Hospital. Meanwhile, Raleigh is home to high-performing hospitals such as Duke Health Raleigh Hospital and UNC REX Healthcare.
Health (county statistics)
Type
San Francisco
Raleigh
General health status score of residents in this county from 1 (poor) to 5 (excellent)
San Francisco, with its iconic Golden Gate Bridge, cable cars, and well-maintained highways, offers well-developed infrastructure. Raleigh also provides strong infrastructure, with well-kept roads and growing development in public and private facilities. Both cities have been investing in sustainable and green infrastructure practices.
Infrastructure
Type
San Francisco
Raleigh
Hospitals
16
19
TV stations
18
20
Arenas or stadiums
2
3
Bank branches located here
281
136
Bank institutions located here
52
27
Main business address for public companies
68
21
Nuclear power plants nearby
0
1
Drinking water stations with no reported violations in the past
5
2
Drinking water stations with reported violations in the past
HMDA - Conventional home purchase loans - Applications denied
Year
San Francisco
Raleigh
1999
1,402
1,618
2000
1,000
890
2001
733
557
2002
870
510
2003
1,576
564
2004
2,147
700
2005
2,344
1,083
2006
2,511
1,097
2007
2,117
859
2008
1,575
424
2009
952
253
Culture and Food
San Francisco is culturally diverse with influence from various cultures around the world, most notably Asia and Latin America. This diversity is reflected in its food, offering a wide variety of global cuisines. Raleigh offers southern charm, steeped with hearty southern cooking and traditional barbecue, alongside a burgeoning arts scene.
Sports Teams
San Francisco is home to popular teams such as the San Francisco Giants (MLB) and Golden State Warriors (NBA). Raleigh hosts the Carolina Hurricanes (NHL), but also enjoys close proximity to other professional sports teams in North Carolina.


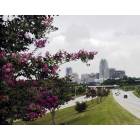
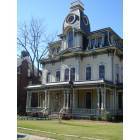
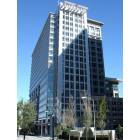
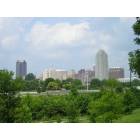
 San Francisco, CA
 Raleigh, NC