Comparing San Francisco, California to Reno, Nevada presents a study of contrasts in various aspects such as crime rate, weather, living costs, and overall lifestyle. San Francisco is a bustling, vibrant city known for its Silicon Valley linkages and scenic bay area alongside dominant industries in technology, health care, and finance. Reno, on the other hand, is renowned for its favorable business climate, outdoor recreational opportunities, and a growing technology sector. Each city offers unique experiences, amenities and challenges to both residents and tourists.
Distance between
San Francisco, CA and
Reno, NV : 186.6 miles
San Francisco's population is larger by 203%. Its population has grown by 38,468 people (5.0%) since 2000. The population of Reno has grown by 88,371 people (49.0%) during that time.
Comparatively, San Francisco has a higher crime rate than Reno. While both cities face issues with theft and property crime, San Francisco's larger population and urban environment contribute to the statistically higher crime figures. San Francisco has been tackling issues of homelessness and drug usage, which have safety implications. Meanwhile, Reno's crime rate is below the national average, but like most cities, has areas with higher incidents of crime. Residents and tourists in both cities should be mindful of their belongings and surroundings for their safety.
City-data.com crime index counts serious crimes and violent crime more heavily. It adjusts for the number of visitors and daily workers commuting into cities. (higher means more crime, U.S. average = 301.1)
City-data.com crime index counts serious crimes and violent crime more heavily. It adjusts for the number of visitors and daily workers commuting into cities. (higher means more crime, U.S. average = 301.1)
Sex Offenders
According to our data, there are 829 registered sex offenders living in San Francisco and 1,264 registered sex offenders living in . The ratio of residents to sex offenders in San Francisco is 1,051 to 1; the ratio in Reno is 194 to 1. The number of registered sex offenders compared to the number of residents is a lot smaller in San Francisco than in Reno.
Cost of Living
San Francisco is one of the most expensive cities in the U.S., marked by high housing prices, high cost of goods and services, and overall high living expenses. On the contrary, Reno's cost of living is lower, making it more affordable with housing costs significantly less than in San Francisco.
Income Tax
San Francisco residents must pay California's state income tax, which operates on a progressive system. Reno residents benefit from Nevada's lack of state income tax.
Property Tax
California has a state property tax rate of 0.77%, which applies to San Francisco residents. Nevada's property tax rate stands at 0.84%, applicable for Reno residents.
Sales Tax
San Francisco has a sales tax rate of 8.5% and benefits from California's robust economy. Reno, located in Nevada, has a higher sales tax rate of 8.265% but doesn't collect state income tax, offering a sizable tax benefit to residents.
Income
Type
San Francisco
Reno
Estimated median household income
$121,826
$67,478
Estimated per capita income
$80,383
$37,989
Cost of living index (U.S. average is 100)
141.1
99.5
If you make $50,000 in Reno, you will have to make $70,905 in San Francisco to maintain the same standard of living.
Geographical Conditions
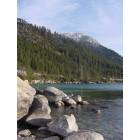
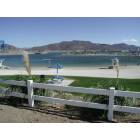
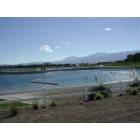
San Francisco is known for its hilly terrain and scenic coastline along the Pacific Ocean, with landmarks like the Golden Gate Bridge and Alcatraz Island. Reno lies in the high desert at the foot of the Sierra Nevada, with Lake Tahoe and numerous ski resorts nearby.
San Francisco offers superior educational opportunities, leading with school districts rated above average and home to some top-rated universities like the University of California, Berkeley and San Francisco State University. Reno too has good schools, with the University of Nevada, Reno being a prominent institution offering quality higher education.
San Francisco is at the heart of the tech industry, hosting numerous start-ups, and is home to tech giants like Facebook, Google, and Salesforce. Reno's economy pivots on tourism, manufacturing, and a growing tech sector with Tesla and Google establishing facilities in recent years.
Biggest Employers
San Francisco's biggest employers include the City of San Francisco, Kaiser Permanente, and Wells Fargo. In Reno, the top employers are the Washoe County School District, the University of Nevada, Reno, and the Renown Regional Medical Center.
There were 33 building permits issued in San Francisco in 2012 (2 more than in 2011) compared to 1,414 building permits issued in Reno in 2012 (1095 more than in 2011).
In San Francisco (San Francisco County), 83.5% voted for Democrats and 13.0% for Republicans in 2012 Presidential Election. In Reno (Washoe County), 50.8% voted for Democrats and 47.1% for Republicans.
Elections
Type
Democrats
Republicans
Other
Year
San Francisco
Reno
San Francisco
Reno
San Francisco
Reno
2020
85.3%
50.8%
12.7%
46.3%
2.0%
2.9%
2016
84.6%
46.4%
9.2%
45.1%
6.2%
8.5%
2012
83.5%
50.8%
13.0%
47.1%
3.4%
2.1%
2008
84.4%
55.2%
13.7%
42.6%
2.0%
2.1%
2004
83.0%
47.2%
15.2%
51.4%
1.8%
1.4%
2000
75.7%
42.7%
16.1%
52.1%
8.1%
5.3%
1996
72.2%
21.0%
15.7%
72.1%
12.1%
7.0%
Breakdown of population affiliated with a religious congregation
Type
Adherents
Congregations
Religion
San Francisco
Reno
San Francisco
Reno
CATHOLIC CHURCH
15.0%
14.4%
9.6%
6.1%
EPISCOPAL CHURCH
0.8%
0.4%
3.5%
3.3%
MUSLIM ESTIMATE
0.8%
0.1%
1.2%
0.5%
SOUTHERN BAPTIST CONVENTION
0.7%
1.1%
8.4%
12.2%
AMERICAN BAPTIST CHURCHES IN THE USA
0.6%
0.1%
2.5%
1.4%
EVANGELICAL LUTHERAN CHURCH IN AMERICA
0.2%
0.3%
1.7%
1.9%
LUTHERAN CHURCH
0.2%
0.4%
1.5%
0.9%
SEVENTH DAY ADVENTIST CHURCH
0.2%
0.4%
1.9%
1.9%
Weather
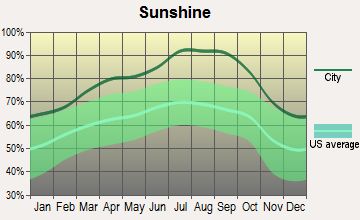
San Francisco enjoys a temperate Mediterranean climate, with mild wet winters and dry summers, which appeals to many people. The famous fog, referred to as "Karl the Fog," offers a unique weather element. On the other hand, Reno has a semi-arid climate with cold, snowy winters and hot, dry summers. Reno also receives a substantial amount of sunshine throughout the year, making it perfect for outdoor activities.
Weather and climate
Type
San Francisco
Reno
Temperature - Average
58.3°F
51.1°F
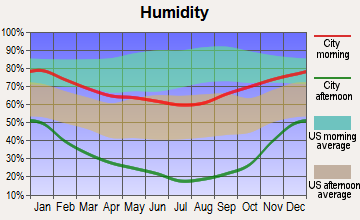
Humidity - Average morning or afternoon humidity
84.3%
51.3%
Humidity - Differences between morning and afternoon humidity
29%
57%
Humidity - Maximum monthly morning or afternoon humidity
91%
75%
Humidity - Minimum monthly morning or afternoon humidity
62%
18%
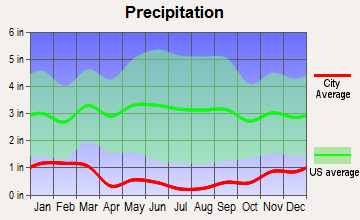
Precipitation - Yearly average
22.2 in
8.1 in
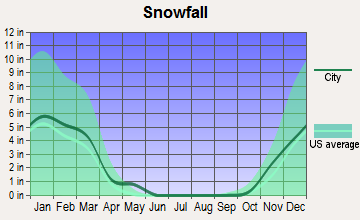
Snowfall - Yearly average
0 in
45 in
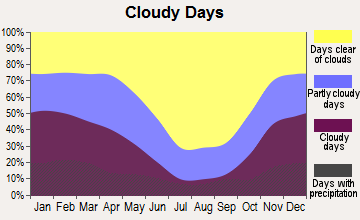
Clouds - Number of days clear of clouds
26.8%
26.3%
Sunshine amount - Average
73%
88.3%
Sunshine amount - Differences during a year
22%
30%
Sunshine amount - Maximum monthly
77%
95%
Sunshine amount - Minimum monthly
55%
65%
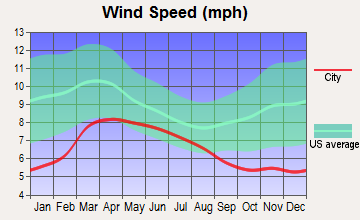
Wind speed - Average
11.4 mph
6.9 mph
Average climate in San Francisco, California
Average climate in Reno, Nevada
Air pollution
Type
AQI
CO
NO2
OZONE
PB
PM10
PM25
SO2
Year
San Francisco
Reno
San Francisco
Reno
San Francisco
Reno
San Francisco
Reno
San Francisco
Reno
San Francisco
Reno
San Francisco
Reno
2018
104
80
0.35
0.22
11.3
12.8
23.4
31.6
0.012
N/A
20.3
N/A
11.9
8.2
0.4
0.2
2017
96
87
0.40
0.22
11.4
12.9
22.5
31.7
0.008
N/A
19.0
N/A
9.9
7.5
0.6
0.3
2016
68
77
0.39
0.20
10.6
12.7
22.4
31.9
0.005
N/A
17.8
N/A
7.9
6.7
0.8
0.2
2015
85
90
0.41
0.21
12.1
14.1
22.5
30.8
0.004
N/A
18.5
N/A
7.9
7.8
0.8
0.4
2014
85
130
0.38
0.22
12.1
13.7
21.8
31.7
0.005
N/A
21.8
N/A
7.7
7.8
0.6
0.4
2013
88
166
0.40
0.27
13.9
16.0
20.4
29.4
0.004
N/A
27.0
N/A
10.2
10.8
0.5
0.5
2012
75
121
0.40
0.27
12.8
14.1
22.7
32.7
0.003
N/A
18.1
N/A
8.2
6.2
1.1
0.4
2011
86
76
0.24
0.27
14.1
16.7
21.3
29.5
0.003
N/A
N/A
N/A
9.5
6.8
1.7
0.5
2010
84
73
0.21
0.23
13.4
16.3
22.0
31.4
0.004
N/A
N/A
N/A
10.6
N/A
1.0
N/A
2009
95
68
0.30
0.32
15.1
17.4
20.4
28.5
0.005
N/A
N/A
N/A
12.8
N/A
1.1
N/A
2008
94
81
0.43
0.27
15.6
17.9
21.7
28.3
0.007
N/A
N/A
N/A
11.7
N/A
0.9
N/A
2007
84
85
0.45
0.34
15.6
18.9
20.5
28.0
0.007
N/A
N/A
N/A
8.9
11.2
1.2
N/A
2006
86
88
0.52
0.38
16.1
19.3
21.5
29.0
N/A
N/A
29.3
N/A
8.7
N/A
1.6
N/A
2005
89
76
0.39
0.45
14.8
18.0
20.5
27.2
N/A
N/A
30.1
N/A
8.8
N/A
1.3
N/A
2004
93
76
0.44
0.38
16.1
N/A
20.9
27.2
0.004
N/A
33.1
N/A
11.2
N/A
2.5
N/A
2003
65
69
0.64
0.44
18.4
N/A
19.7
27.5
N/A
N/A
19.9
N/A
N/A
N/A
1.7
N/A
2002
62
77
0.69
0.53
18.6
N/A
19.6
27.1
0.008
N/A
N/A
N/A
N/A
N/A
1.4
N/A
2001
64
68
0.72
0.77
19.2
7.4
19.0
25.5
0.008
N/A
16.9
N/A
N/A
N/A
1.4
N/A
2000
60
66
0.71
0.75
20.3
7.9
17.1
24.1
0.017
N/A
N/A
N/A
N/A
N/A
2.0
N/A
Natural disasters
Type
San Francisco
Reno
Tornado activity compared to U.S. average
7.7%
2.4%
Earthquake activity compared to U.S. average
7,468.1%
6,879.2%
Natural disasters compared to U.S. average
6%
28%
Transportation
San Francisco boasts extensive public transportation, including buses, cable cars, and BART. Commuting can still be challenging due to traffic. Reno's public transit is more limited but is complemented by robust highway access for commuting.
Transport
Type
San Francisco
Reno
Amtrak stations
4
1
Amtrak stations nearby
3
2
FAA registered aircraft
453
758
FAA registered aircraft manufacturers and dealers
9
16
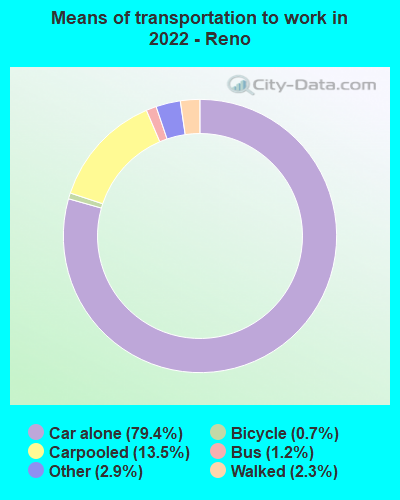
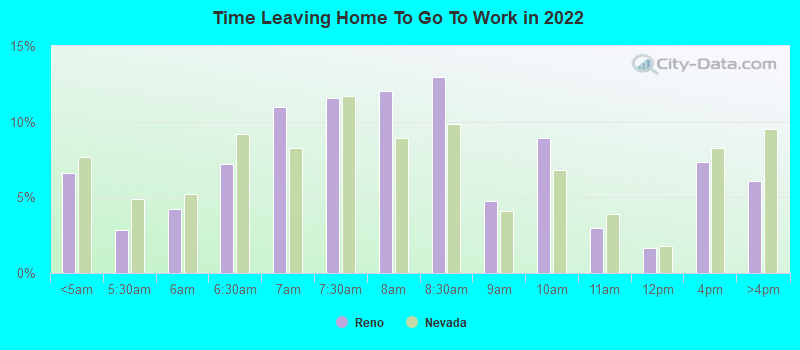
Means of transportation to work
Type
San Francisco
Reno
Bicycle
2.7%
0.1%
Bus
11.4%
1.8%
Carpooled
9.1%
10.2%
Car alone
53.9%
81.6%
Ferryboat
0.4%
0%
Motorcycle
0.9%
0.2%
Railroad
0.7%
0%
Streetcar
7.9%
0%
Subway
1.6%
0%
Taxicab
0.4%
0.2%
Walked
8.3%
1.7%
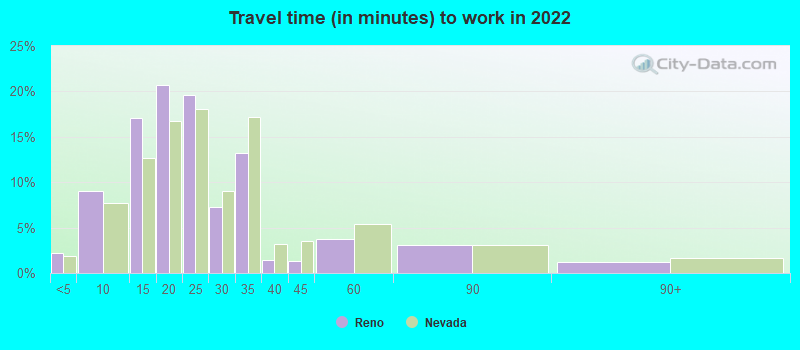
Average travel time to work
Type
San Francisco
Reno
Average
38 min
24.2 min
Other means
28.3 min
18.6 min
Public transportation
39.7 min
36.8 min
Private vehicle occupancy
Type
San Francisco
Reno
Average
1.2
1.2
Drove alone
85.5%
87.1%
In 2 person carpool
10.1%
10.2%
In 3 person carpool
3.2%
1.6%
In 4 person carpool
0.9%
0.6%
In 5-6 person carpool
0.2%
0.3%
In 7+ person carpool
0.1%
0.2%
How many people usually rode to work in the car, truck or van.
Real Estate
Real estate in San Francisco is notoriously expensive with limited availability, contributing to its high cost of living. Reno's real estate market, on the other hand, is more reasonable, offering a range of options for potential home buyers from condos to single-family homes.
Neighborhoods
San Francisco's neighborhoods each bring unique character and cultural flavor, from Lombard Street's crooked path to Chinatown's vibrant offerings. While in Reno, neighborhoods like Midtown offer a mix of commercial and residential spaces, and South Reno is popular for its upscale homes and shopping.
Houses and residents
Type
San Francisco
Reno
Houses
412,269
116,918
Average household size (people)
2.3
2.4
Median year apartment built
1953
1984
Median year house/condo built
1942
1993
Length of stay in the house since moving in
16.3 years
10.5 years
Houses occupied
350,796 (85.1%)
110,993 (94.9%)
Houses occupied by owners
140,809 (40.1%)
54,158 (48.8%)
Houses occupied by renters
209,987 (59.9%)
56,835 (51.2%)
Median rent asked for vacant for-rent units
$3,809
$1,306
Median monthly housing costs
$2,337
$1,307
Median price asked for vacant for-sale houses and condos
$1,670,841
$797,037
Estimated median house or condo value
Over $1,000,000
$469,100
Median numbers of rooms
3.9
5
Median number of rooms in apartments
3.2
3.9
Median number of rooms in houses and condos
5.6
6.2
Median house price - detached houses
Over $1,000,000
$560,745
Median house price - in 2-unit structures
Over $1,000,000
Over $1,000,000
Median house price - in 3-to-4-unit structures
Over $1,000,000
$273,291
Median house price - in 5 or more unit structures
Over $1,000,000
$239,159
Median house price - mobile homes
$517,939
$115,836
Median house price - Townhouses or other attached units
Over $1,000,000
$364,237
Median house price - All housing units
Over $1,000,000
$513,401
Median house age
76
33
Renting percentage
64.2%
52%
Housing density (houses/condos per square mile)
8,829.1
1,691.7
House value disparities
18.7%
27.4%
Household income disparities
41.7%
44.4%
Median household income for houses/condes with a mortgage
$210,544
$114,336
Median household income for apartments without a mortgage
$99,969
$64,370
Housing units without a mortgage
1,778 (1.9%)
616 (1.7%)
Housing units with both a second mortgage and home equity loan
7,687 (8.3%)
1,679 (4.6%)
Housing units with a mortgage
91,236 (98.1%)
35,814 (98.3%)
Housing units with a home equity loan
471 (0.5%)
129 (0.4%)
Housing units with a second mortgage
9,395 (10.1%)
1,980 (5.4%)
House/condo owner moved in on average (years ago)
14
7
House/condo renter moved in on average (years ago)
4
1
Housing units lacking complete kitchen facilities
4.7%
3.7%
Housing units lacking complete plumbing facilities
2.7%
2.3%
Housing units in structures
Housing units in structures
San Francisco
Reno
One, detached
19.1%
51.5%
One, attached
12.1%
5.7%
Two
9.0%
1.1%
3 or 4
11.4%
5.0%
5 to 9
9.0%
9.7%
10 to 19
9.3%
9.2%
20 to 49
11.3%
5.7%
50 or more
18.7%
8.1%
Mobile homes
0.1%
3.7%
Boats, RVs, vans, etc.
0.0%
0.3%
Median real estate property taxes paid for housing units
Self-employed workers in own not incorporated business
30,288
5,944
State government workers
22,691
7,119
Unpaid family workers
399
127
Industries and Occupations
In San Francisco, the leading industries are technology, healthcare, and finance, providing a wide range of occupations to its residents. Reno’s dominant industries are tourism, entertainment, technology, and logistics, offering a mix of jobs from casino roles to tech positions.
Both cities have competent healthcare systems. San Francisco residents have access to top-rated hospitals like UCSF Medical Center and Kaiser Permanente San Francisco Medical Center. In Reno, Renown Health and Saint Mary's Regional Medical Center are among the top healthcare providers.
Health (county statistics)
Type
San Francisco
Reno
General health status score of residents in this county from 1 (poor) to 5 (excellent)
San Francisco's infrastructure is characterized by well-developed transport, healthcare, and utility networks. Its iconic Golden Gate Bridge and cable cars are famous worldwide. Reno's infrastructure, while not as robust as San Francisco, is steadily improving particularly with the city's rapid growth and increased investments in its tech sector.
Infrastructure
Type
San Francisco
Reno
Hospitals
16
11
TV stations
18
15
Arenas or stadiums
2
2
Bank branches located here
281
60
Bank institutions located here
52
11
Main business address for public companies
68
12
Drinking water stations with no reported violations in the past
5
20
Drinking water stations with reported violations in the past
HMDA - Conventional home purchase loans - Applications denied
Year
San Francisco
Reno
1999
1,402
668
2000
1,000
565
2001
733
362
2002
870
305
2003
1,576
478
2004
2,147
725
2005
2,344
944
2006
2,511
1,006
2007
2,117
572
2008
1,575
220
2009
952
123
Culture and Food
San Francisco is a cultural and gastronomic hub, famous for its thriving arts scene and diverse food offerings, from seafood at Fisherman's Wharf to dim sum in Chinatown. Reno offers a more laid-back cultural scene but has a growing food and craft beer scene, as well as numerous city-wide festivals.
Sports Teams
San Francisco is home to several professional sports teams like the 49ers (NFL), the Giants (MLB), and the Warriors (NBA). Reno doesn't have any major league sports teams but has AAA baseball with the Reno Aces and USL Championship soccer with Reno 1868 FC.


 San Francisco, CA
 Reno, NV