San Francisco, CA vs Southwest San Gabriel Valley, CA
San Francisco, California, and the Southwest San Gabriel Valley, California, each have their unique charm and characteristics. They offer different experiences in terms of safety, weather, living costs, education, job opportunities, infrastructure, and many other factors. San Francisco is a cosmopolitan city known for its cultural diversity, technology sector, and stunning views of the Pacific Ocean. The Southwest San Gabriel Valley, on the other hand, is a more suburban region known for its quiet communities and proximity to both urban and natural attractions.
San Francisco's crime rates are higher than those in the Southwest San Gabriel Valley. However, the city maintains a diligent police presence and some neighborhoods like the Marina District and Richmond District are quite safe. The Southwest San Gabriel Valley, on the other hand, is generally considered safer, as crime rates are low.
Cost of Living
San Francisco is one of the most expensive cities in the United States. High housing costs are the main contributor to the city's high cost of living. In contrast, the Southwest San Gabriel Valley is less expensive, though still pricier compared to other parts of the country.
Income Tax
Both locations are in California and subject to the same state income tax which ranges from 1% to 13.3% depending on income level.
Property Tax
San Francisco has a slightly higher average property tax rate (0.66%) than the Southwest San Gabriel Valley (0.61%).
Sales Tax
San Francisco has a city sales tax rate of 8.5%, compared to the 9.5% sales tax in the Southwest San Gabriel Valley.
Income
Type
San Francisco
Southwest San Gabriel Valley
Estimated median household income
$121,826
$73,720
Estimated per capita income
$80,383
$29,945
Cost of living index (U.S. average is 100)
141.1
161.2
If you make $50,000 in San Francisco, you will have to make $57,123 in Southwest San Gabriel Valley to maintain the same standard of living.
Geographical Conditions
San Francisco is a coastal city interspersed with rolling hills and stunning views of the Pacific Ocean. The Southwest San Gabriel Valley is a suburban locale close to both city attractions and beautiful natural surroundings, including Los Angeles National Forest.
Geographical information
Type
San Francisco
Southwest San Gabriel Valley
Land area
46.7 sq. miles
35.3 sq. miles
Population density
17,458 people per sq. mile
9,252.7 people per sq. mile
Relative area comparison
San Francisco, CA Southwest San Gabriel Valley, CA
Education
San Francisco boasts numerous prestigious universities and has a strong public school system. The Southwest San Gabriel Valley also offers quality education, including public and private schools, and easy access to higher learning institutions such as the California Institute of Technology.
San Francisco is a major hub for the tech industry, tourism, and finance, offering many job opportunities. The Southwest San Gabriel Valley's economy is primarily based on health care, retail trade, and manufacturing.
Biggest Employers
Some of the biggest employers in San Francisco are Salesforce, Uber, and Wells Fargo. Southwest San Gabriel Valley's top employers include Kaiser Permanente, Huntington Hospital, and Pasadena Unified School District.
In San Francisco (San Francisco County), 83.5% voted for Democrats and 13.0% for Republicans in 2012 Presidential Election. In Southwest San Gabriel Valley (Los Angeles County), 69.7% voted for Democrats and 27.8% for Republicans.
Elections
Type
Democrats
Republicans
Other
Year
San Francisco
Southwest San Gabriel Valley
San Francisco
Southwest San Gabriel Valley
San Francisco
Southwest San Gabriel Valley
2020
85.3%
71.0%
12.7%
26.9%
2.0%
2.1%
2016
84.6%
72.0%
9.2%
22.5%
6.2%
5.5%
2012
83.5%
69.7%
13.0%
27.8%
3.4%
2.4%
2008
84.4%
69.2%
13.7%
28.8%
2.0%
1.9%
2004
83.0%
63.3%
15.2%
35.7%
1.8%
1.0%
2000
75.7%
63.6%
16.1%
32.4%
8.1%
4.0%
1996
72.2%
59.3%
15.7%
31.0%
12.1%
9.7%
Breakdown of population affiliated with a religious congregation
Type
Adherents
Congregations
Religion
San Francisco
Southwest San Gabriel Valley
San Francisco
Southwest San Gabriel Valley
CATHOLIC CHURCH
15.0%
36.1%
9.6%
4.7%
EPISCOPAL CHURCH
0.8%
0.4%
3.5%
1.4%
MUSLIM ESTIMATE
0.8%
0.7%
1.2%
1.0%
SOUTHERN BAPTIST CONVENTION
0.7%
1.0%
8.4%
9.0%
AMERICAN BAPTIST CHURCHES IN THE USA
0.6%
0.5%
2.5%
3.1%
SEVENTH DAY ADVENTIST CHURCH
0.2%
0.5%
1.9%
2.4%
Weather
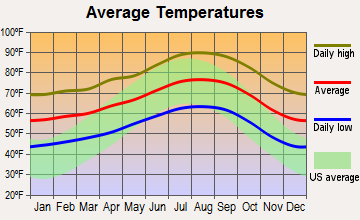
In terms of weather, San Francisco features a Mediterranean-like climate with mild, wet winters, and warm, dry summers. The city is known for its famous fog, aptly named "Karl". The Southwest San Gabriel Valley has a similar Mediterranean climate but it's typically hotter in summer and cooler in winter compared to San Francisco.
Weather and climate
Type
San Francisco
Southwest San Gabriel Valley
Temperature - Average
58.3°F
66.3°F
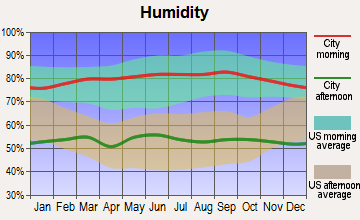
Humidity - Average morning or afternoon humidity
84.3%
61.4%
Humidity - Differences between morning and afternoon humidity
29%
16.5%
Humidity - Maximum monthly morning or afternoon humidity
91%
65.8%
Humidity - Minimum monthly morning or afternoon humidity
62%
49.3%
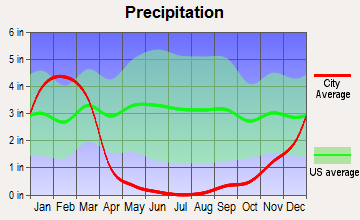
Precipitation - Yearly average
22.2 in
17.6 in
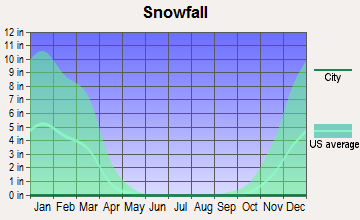
Snowfall - Yearly average
0 in
0 in
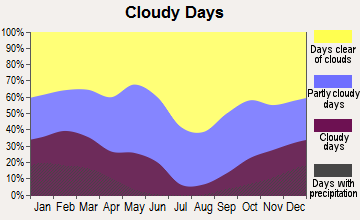
Clouds - Number of days clear of clouds
26.8%
30.1%
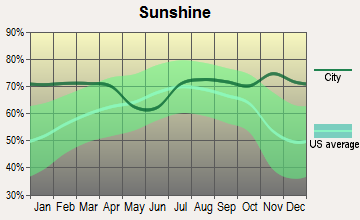
Sunshine amount - Average
73%
78.4%
Sunshine amount - Differences during a year
22%
22%
Sunshine amount - Maximum monthly
77%
85%
Sunshine amount - Minimum monthly
55%
63%
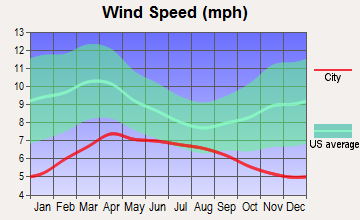
Wind speed - Average
11.4 mph
2.3 mph
Average climate in San Francisco, California
Average climate in Southwest San Gabriel Valley, California
Air pollution
Type
AQI
CO
NO2
OZONE
PB
PM10
PM25
SO2
Year
San Francisco
Southwest San Gabriel Valley
San Francisco
Southwest San Gabriel Valley
San Francisco
Southwest San Gabriel Valley
San Francisco
Southwest San Gabriel Valley
San Francisco
Southwest San Gabriel Valley
Southwest San Gabriel Valley
San Francisco
Southwest San Gabriel Valley
San Francisco
Southwest San Gabriel Valley
2018
104
140
0.35
0.39
11.3
14.2
23.4
26.6
0.012
0.008
27.5
N/A
11.9
15.1
0.4
0.4
2017
96
142
0.40
0.38
11.4
15.1
22.5
27.8
0.008
0.007
30.2
N/A
9.9
15.3
0.6
0.5
2016
68
128
0.39
0.36
10.6
15.2
22.4
26.5
0.005
0.007
27.8
N/A
7.9
14.3
0.8
0.4
2015
85
137
0.41
0.36
12.1
15.3
22.5
26.7
0.004
0.006
27.6
N/A
7.9
16.4
0.8
0.3
2014
85
138
0.38
0.39
12.1
16.3
21.8
26.8
0.005
0.007
29.9
N/A
7.7
18.0
0.6
0.4
2013
88
140
0.40
0.44
13.9
17.5
20.4
25.2
0.004
0.007
28.3
N/A
10.2
17.0
0.5
0.4
2012
75
144
0.40
0.47
12.8
17.7
22.7
25.0
0.003
0.007
27.6
N/A
8.2
18.1
1.1
0.5
2011
86
142
0.24
0.50
14.1
19.3
21.3
23.6
0.003
0.008
29.8
N/A
9.5
17.6
1.7
0.4
2010
84
128
0.21
0.52
13.4
19.4
22.0
22.9
0.004
0.020
30.0
N/A
10.6
16.3
1.0
0.5
2009
95
150
0.30
0.43
15.1
21.5
20.4
23.5
0.005
0.011
40.0
N/A
12.8
18.0
1.1
0.5
2008
94
152
0.43
0.53
15.6
23.5
21.7
22.8
0.007
0.014
39.1
N/A
11.7
18.3
0.9
0.6
2007
84
128
0.45
0.58
15.6
24.2
20.5
21.8
0.007
0.017
N/A
N/A
8.9
N/A
1.2
1.1
2006
86
125
0.52
0.63
16.1
24.6
21.5
22.1
N/A
0.009
N/A
N/A
8.7
N/A
1.6
1.7
2005
89
123
0.39
0.66
14.8
25.6
20.5
20.5
N/A
0.015
N/A
N/A
8.8
N/A
1.3
2.1
2004
93
132
0.44
0.77
16.1
27.7
20.9
22.9
0.004
0.019
N/A
N/A
11.2
N/A
2.5
2.4
2003
65
143
0.64
0.98
18.4
31.8
19.7
22.0
N/A
0.027
N/A
N/A
N/A
N/A
1.7
1.8
2002
62
137
0.69
1.00
18.6
33.0
19.6
21.1
0.008
0.025
N/A
N/A
N/A
N/A
1.4
2.4
2001
64
143
0.72
1.11
19.2
34.2
19.0
18.9
0.008
0.039
N/A
N/A
N/A
N/A
1.4
2.4
2000
60
147
0.71
1.12
20.3
33.4
17.1
18.9
0.017
0.033
N/A
N/A
N/A
N/A
2.0
1.4
Natural disasters
Type
San Francisco
Southwest San Gabriel Valley
Tornado activity compared to U.S. average
7.7%
18%
Earthquake activity compared to U.S. average
7,468.1%
7,182.3%
Natural disasters compared to U.S. average
6%
57%
Transportation
San Francisco has excellent public transportation, including the famous cable cars, BART, and Muni. The Southwest San Gabriel Valley relies more on car commuting, though it offers bus services and access to Metrolink trains.
Transport
Type
San Francisco
Southwest San Gabriel Valley
Amtrak stations
4
0
Amtrak stations nearby
3
3
FAA registered aircraft
453
0
FAA registered aircraft manufacturers and dealers
9
0
Means of transportation to work
Type
San Francisco
Southwest San Gabriel Valley
Bicycle
2.7%
0.5%
Bus
11.4%
4.7%
Carpooled
9.1%
16.1%
Car alone
53.9%
73%
Ferryboat
0.4%
0%
Motorcycle
0.9%
0.1%
Railroad
0.7%
0%
Streetcar
7.9%
0%
Subway
1.6%
0%
Taxicab
0.4%
0%
Walked
8.3%
2.5%
Average travel time to work
Type
San Francisco
Southwest San Gabriel Valley
Average
38 min
29.1 min
Real Estate
Real estate in San Francisco is notoriously expensive, with median home prices far exceeding the national average. The Southwest San Gabriel Valley also sees high real estate prices, but they are moderate compared to San Francisco.
Neighborhoods
From its hipster Mission District to the affluent Pacific Heights, San Francisco has a wealth of diverse neighborhoods. The Southwest San Gabriel Valley, on the other hand, is known for its quiet suburban neighborhoods.
Houses and residents
Type
San Francisco
Southwest San Gabriel Valley
Houses
412,269
102,656
Average household size (people)
2.3
3.1
Houses occupied
350,796 (85.1%)
99,543 (97%)
Houses occupied by owners
140,809 (40.1%)
47,333 (47.6%)
Houses occupied by renters
209,987 (59.9%)
52,210 (52.5%)
Median rent asked for vacant for-rent units
$3,809
$1,828
Median price asked for vacant for-sale houses and condos
$1,670,841
$1,138,428
Estimated median house or condo value
Over $1,000,000
$723,161
Median number of rooms in apartments
3.2
3.7
Median number of rooms in houses and condos
5.6
5.9
Renting percentage
64.2%
51.7%
Housing density (houses/condos per square mile)
8,829.1
2,909.6
Household income disparities
41.7%
44%
Housing units without a mortgage
1,778 (1.9%)
13,166 (31.1%)
Housing units with both a second mortgage and home equity loan
7,687 (8.3%)
88 (0.2%)
Housing units with a mortgage
91,236 (98.1%)
29,118 (68.9%)
Housing units with a home equity loan
471 (0.5%)
2,557 (6%)
Housing units with a second mortgage
9,395 (10.1%)
2,975 (7%)
Housing units lacking complete kitchen facilities
4.7%
1.5%
Housing units lacking complete plumbing facilities
Self-employed workers in own not incorporated business
30,288
8,660
State government workers
22,691
4,158
Unpaid family workers
399
639
Industries and Occupations
Key industries in San Francisco include technology, finance, and tourism, while the Southwest San Gabriel Valley is dominated by health care, education, and manufacturing.
San Francisco is home to world-class healthcare facilities like UCSF Medical Center. Southwest San Gabriel Valley residents have access to quality healthcare services, including the highly rated Huntington Hospital.
Health (county statistics)
Type
San Francisco
Southwest San Gabriel Valley
General health status score of residents in this county from 1 (poor) to 5 (excellent)
San Francisco has extensive infrastructure, with myriad transportation options, strong internet connectivity, and numerous public facilities. In contrast, the Southwest San Gabriel Valley has a less developed but still reliable infrastructure compared to San Francisco.
Infrastructure
Type
San Francisco
Southwest San Gabriel Valley
TV stations
18
26
Culture and Food
San Francisco is famous for its vibrant culture, significant LGBT community, and diverse culinary scene featuring everything from seafood to Asian cuisine. The Southwest San Gabriel Valley is known for its multicultural communities, with strong Asian influences represented in its culinary scene.
Sports Teams
San Francisco boasts professional sports teams like the San Francisco Giants (MLB) and the San Francisco 49ers (NFL). The Southwest San Gabriel Valley doesn't have professional teams but Los Angeles teams are easily accessible.
 San Francisco, CA
 Southwest San Gabriel Valley, CA