San Francisco, California, and St. Louis, Missouri, offer different experiences for both residents and visitors. San Francisco, a bustling metropolis known for its tech scene, boasts a higher cost of living, but also more robust work opportunities and a pleasing climate. St. Louis, on the other hand, is known for its cheaper cost of living, strong sports culture, and Midwest charm. While each city has its unique pros and cons, your preference may room to lifestyle, budget, or professional needs.
Distance between
San Francisco, CA and
St. Louis, MO : 1,740.2 miles
San Francisco's population is larger by 178%. Its population has grown by 38,468 people (5.0%) since 2000. The population of St. Louis has decreased by 54,879 people (15.8%) during that time.
San Francisco generally has a higher crime rate compared to the national average, especially in property crimes. The city is working on improvements, and some parts are safer than others. On the other hand, St. Louis also struggles with crime, particularly with violent crime rates above the national average. However, just like San Francisco, safety can greatly vary by neighborhood. It's important for both residents and tourists to stay informed about the safer areas in both cities.
City-data.com crime index counts serious crimes and violent crime more heavily. It adjusts for the number of visitors and daily workers commuting into cities. (higher means more crime, U.S. average = 301.1)
City-data.com crime index counts serious crimes and violent crime more heavily. It adjusts for the number of visitors and daily workers commuting into cities. (higher means more crime, U.S. average = 301.1)
Sex Offenders
According to our data, there are 829 registered sex offenders living in San Francisco and 2,528 registered sex offenders living in . The ratio of residents to sex offenders in San Francisco is 1,051 to 1; the ratio in St. Louis is 123 to 1. The number of registered sex offenders compared to the number of residents is a lot smaller in San Francisco than in St. Louis.
Cost of Living
San Francisco is one of the most expensive cities in the U.S., with high costs in housing, food, and utilities. St. Louis, on the other hand, possesses a lower than average cost of living, making it a more affordable option for both residents and tourists.
Income Tax
California has higher income tax rates, directly affecting San Francisco residents. Missouri offers lower income tax rates, which could be beneficial for those moving to St. Louis.
Property Tax
San Francisco residents face high property taxes due to the expensive real estate market. In contrast, St. Louis property taxes are significantly lower, reflecting the affordable housing market.
Sales Tax
California has a higher state sales tax compared to Missouri. San Francisco also imposes city sales taxes on top of the state rate. St. Louis benefits from a lower sales tax, making shopping generally more affordable.
Income
Type
San Francisco
St. Louis
Estimated median household income
$121,826
$49,965
Estimated per capita income
$80,383
$33,810
Cost of living index (U.S. average is 100)
141.1
96.5
If you make $50,000 in St. Louis, you will have to make $73,109 in San Francisco to maintain the same standard of living.
Geographical Conditions
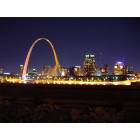
San Francisco is known for its hilly topography, beautiful coastline, and iconic landmarks like the Golden Gate Bridge. St. Louis, located near the confluence of the Mississippi and Missouri rivers, offers plenty of flatlands and green spaces, including the famous Gateway Arch.
Both cities have a solid educational system. San Francisco is known for some top-rated public and private schools, and it's near several prestigious universities like Stanford and UC Berkeley. St. Louis also has strong educational institutions, including Washington University and St. Louis University that are well-regarded.
San Francisco has a thriving economy, grounded in technology, finance, and tourism sectors. It's a hotbed for startups and tech companies, including global behemoths like Twitter and Uber. St. Louis' economy is diverse, with healthcare, biotechnology, manufacturing, and education sectors. The city also has opportunities in aerospace and river transport.
Biggest Employers
In San Francisco, the biggest employers are Salesforce, the City and County of San Francisco, and Wells Fargo. In contrast, BJC HealthCare, Washington University, and Boeing are the biggest employers in St. Louis.
There were 33 building permits issued in San Francisco in 2012 (2 more than in 2011) compared to 146 building permits issued in St. Louis in 2012 (105 more than in 2011).
In San Francisco (San Francisco County), 83.5% voted for Democrats and 13.0% for Republicans in 2012 Presidential Election. In St. Louis (St. Louis city), 82.4% voted for Democrats and 15.9% for Republicans.
Elections
Type
Democrats
Republicans
Other
Year
San Francisco
St. Louis
San Francisco
St. Louis
San Francisco
St. Louis
2020
85.3%
82.4%
12.7%
16.1%
2.0%
1.6%
2016
84.6%
79.0%
9.2%
15.8%
6.2%
5.2%
2012
83.5%
82.4%
13.0%
15.9%
3.4%
1.6%
2008
84.4%
83.8%
13.7%
15.5%
2.0%
0.7%
2004
83.0%
80.4%
15.2%
19.2%
1.8%
0.3%
2000
75.7%
77.5%
16.1%
19.9%
8.1%
2.6%
1996
72.2%
74.8%
15.7%
18.1%
12.1%
7.1%
Breakdown of population affiliated with a religious congregation
Type
Adherents
Congregations
Religion
San Francisco
St. Louis
San Francisco
St. Louis
CATHOLIC CHURCH
15.0%
15.4%
9.6%
9.5%
EPISCOPAL CHURCH
0.8%
0.5%
3.5%
1.5%
MUSLIM ESTIMATE
0.8%
1.1%
1.2%
2.4%
SOUTHERN BAPTIST CONVENTION
0.7%
2.5%
8.4%
9.0%
AMERICAN BAPTIST CHURCHES IN THE USA
0.6%
1.8%
2.5%
2.4%
LUTHERAN CHURCH
0.2%
2.2%
1.5%
6.1%
SEVENTH DAY ADVENTIST CHURCH
0.2%
0.3%
1.9%
0.5%
Weather
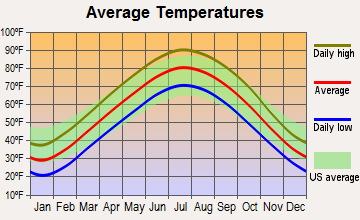
San Francisco enjoys a Mediterranean climate with mild, wet winters, and warm, dry summers. The temperature seldom goes to extremes, making it pleasant year-round. In contrast, St. Louis experiences all four seasons distinctly, with hot, humid summers, and cold winters. It's essential for potential residents and visitors to consider their weather preferences before making a decision.
Weather and climate
Type
San Francisco
St. Louis
Temperature - Average
58.3°F
56.5°F
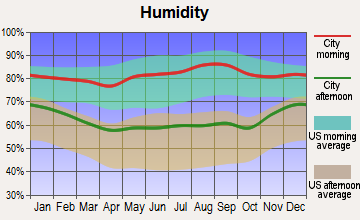
Humidity - Average morning or afternoon humidity
84.3%
74.8%
Humidity - Differences between morning and afternoon humidity
29%
32%
Humidity - Maximum monthly morning or afternoon humidity
91%
85%
Humidity - Minimum monthly morning or afternoon humidity
62%
53%
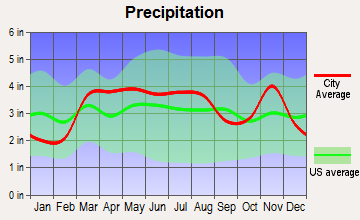
Precipitation - Yearly average
22.2 in
39 in
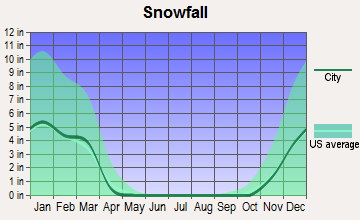
Snowfall - Yearly average
0 in
37.2 in
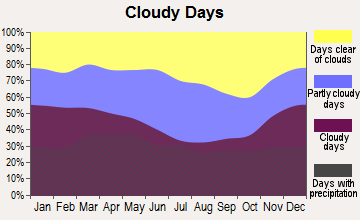
Clouds - Number of days clear of clouds
26.8%
16.7%
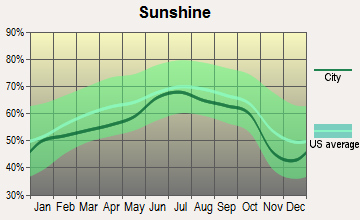
Sunshine amount - Average
73%
62.2%
Sunshine amount - Differences during a year
22%
30%
Sunshine amount - Maximum monthly
77%
71%
Sunshine amount - Minimum monthly
55%
41%
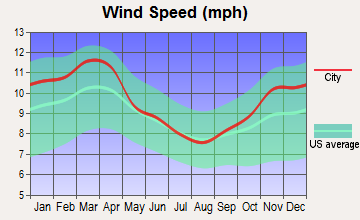
Wind speed - Average
11.4 mph
9.8 mph
Average climate in San Francisco, California
Average climate in St. Louis, Missouri
Air pollution
Type
AQI
CO
NO2
OZONE
PB
PM10
PM25
SO2
Year
San Francisco
St. Louis
San Francisco
St. Louis
San Francisco
St. Louis
San Francisco
St. Louis
San Francisco
St. Louis
St. Louis
San Francisco
St. Louis
San Francisco
St. Louis
2018
104
101
0.35
0.26
11.3
10.7
23.4
27.5
0.012
N/A
19.7
N/A
11.9
9.8
0.4
0.8
2017
96
90
0.40
0.25
11.4
10.4
22.5
28.5
0.008
N/A
16.2
N/A
9.9
8.0
0.6
1.4
2016
68
96
0.39
0.29
10.6
11.1
22.4
25.8
0.005
N/A
15.5
N/A
7.9
8.5
0.8
1.2
2015
85
97
0.41
0.28
12.1
11.8
22.5
22.2
0.004
N/A
16.6
N/A
7.9
10.5
0.8
1.6
2014
85
97
0.38
0.27
12.1
12.2
21.8
25.5
0.005
N/A
17.8
N/A
7.7
10.5
0.6
1.8
2013
88
92
0.40
0.27
13.9
12.2
20.4
26.2
0.004
N/A
16.3
N/A
10.2
10.6
0.5
2.1
2012
75
114
0.40
0.27
12.8
14.4
22.7
27.9
0.003
N/A
17.5
N/A
8.2
10.2
1.1
2.3
2011
86
107
0.24
0.27
14.1
13.2
21.3
27.0
0.003
N/A
17.3
N/A
9.5
12.4
1.7
2.7
2010
84
110
0.21
0.31
13.4
12.8
22.0
23.1
0.004
N/A
16.2
N/A
10.6
12.9
1.0
3.3
2009
95
101
0.30
0.31
15.1
12.5
20.4
22.2
0.005
0.039
21.6
N/A
12.8
12.4
1.1
2.8
2008
94
98
0.43
0.32
15.6
12.9
21.7
22.9
0.007
0.054
32.4
N/A
11.7
12.8
0.9
2.6
2007
84
125
0.45
0.37
15.6
14.1
20.5
24.3
0.007
0.055
38.8
N/A
8.9
14.6
1.2
2.9
2006
86
109
0.52
0.38
16.1
15.2
21.5
23.3
N/A
0.044
38.2
N/A
8.7
14.7
1.6
3.1
2005
89
110
0.39
0.39
14.8
16.3
20.5
24.4
N/A
0.056
41.4
N/A
8.8
N/A
1.3
4.1
2004
93
92
0.44
0.49
16.1
20.0
20.9
19.6
0.004
0.013
38.3
N/A
11.2
N/A
2.5
3.7
2003
65
106
0.64
0.49
18.4
19.6
19.7
21.7
N/A
0.044
37.8
N/A
N/A
N/A
1.7
3.7
2002
62
117
0.69
0.56
18.6
21.7
19.6
21.1
0.008
0.022
45.4
N/A
N/A
N/A
1.4
4.4
2001
64
100
0.72
0.57
19.2
22.4
19.0
20.4
0.008
0.057
46.6
N/A
N/A
N/A
1.4
5.0
2000
60
98
0.71
0.78
20.3
23.8
17.1
20.6
0.017
0.057
N/A
N/A
N/A
N/A
2.0
5.5
Natural disasters
Type
San Francisco
St. Louis
Tornado activity compared to U.S. average
7.7%
182.4%
Earthquake activity compared to U.S. average
7,468.1%
413.3%
Natural disasters compared to U.S. average
6%
0%
Transportation
San Francisco has a robust public transportation system, including buses, light rail, and the famous cable cars. However, traffic can be intense, impacting commuting time. St. Louis has less crowded public transport with the MetroLink light rail and buses. Traffic is typically much easier to navigate than in San Francisco.
Transport
Type
San Francisco
St. Louis
Amtrak stations
4
1
Amtrak stations nearby
3
2
FAA registered aircraft
453
0
FAA registered aircraft manufacturers and dealers
9
0
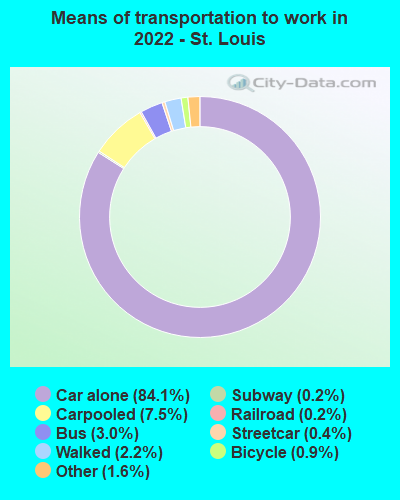
Means of transportation to work
Type
San Francisco
St. Louis
Bicycle
2.7%
0.5%
Bus
11.4%
3.7%
Carpooled
9.1%
7.5%
Car alone
53.9%
83.9%
Ferryboat
0.4%
0%
Motorcycle
0.9%
0.1%
Railroad
0.7%
0.3%
Streetcar
7.9%
0.2%
Subway
1.6%
0.3%
Taxicab
0.4%
0.3%
Walked
8.3%
2.5%
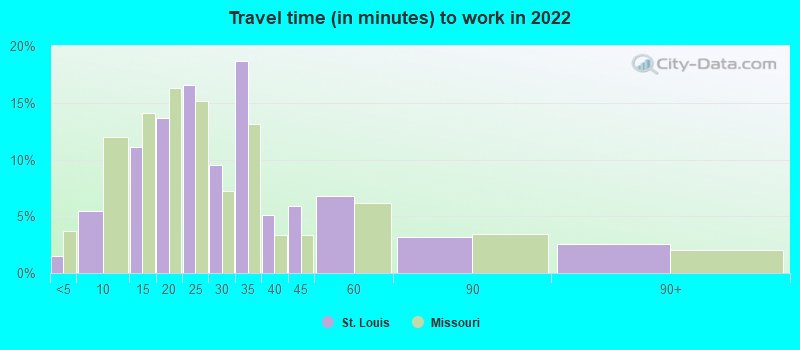
Average travel time to work
Type
San Francisco
St. Louis
Average
38 min
29.4 min
Other means
28.3 min
22.9 min
Public transportation
39.7 min
42.8 min
Private vehicle occupancy
Type
San Francisco
St. Louis
Average
1.2
1.1
Drove alone
85.5%
91.6%
In 2 person carpool
10.1%
6.5%
In 3 person carpool
3.2%
1%
In 4 person carpool
0.9%
0.1%
In 5-6 person carpool
0.2%
0.1%
In 7+ person carpool
0.1%
0.7%
How many people usually rode to work in the car, truck or van.
Real Estate
San Francisco has a sky-high real estate market, both for buying and renting. St. Louis offers affordable real estate options, generally well below the national average.
Neighborhoods
San Francisco is known for its diverse and unique neighborhoods each with its culture and vibe, like Haight Ashbury, Mission District, and Nob Hill. St. Louis also features diverse neighborhoods, such as The Central West End, Soulard, and The Hill, each with its charm.
Houses and residents
Type
San Francisco
St. Louis
Houses
412,269
173,493
Average household size (people)
2.3
2.2
Median year apartment built
1953
1943
Length of stay in the house since moving in
16.3 years
14.2 years
Houses occupied
350,796 (85.1%)
139,736 (80.5%)
Houses occupied by owners
140,809 (40.1%)
63,653 (45.6%)
Houses occupied by renters
209,987 (59.9%)
76,083 (54.4%)
Median rent asked for vacant for-rent units
$3,809
$923.98
Median monthly housing costs
$2,337
$883
Median price asked for vacant for-sale houses and condos
$1,670,841
$56,913
Estimated median house or condo value
Over $1,000,000
$170,800
Median numbers of rooms
3.9
4.8
Median number of rooms in apartments
3.2
4
Median number of rooms in houses and condos
5.6
5.9
Median house price - detached houses
Over $1,000,000
$196,007
Median house price - in 2-unit structures
Over $1,000,000
$166,673
Median house price - in 3-to-4-unit structures
Over $1,000,000
$155,363
Median house price - in 5 or more unit structures
Over $1,000,000
$260,843
Median house price - mobile homes
$517,939
$35,054
Median house price - Townhouses or other attached units
Over $1,000,000
$272,667
Median house price - All housing units
Over $1,000,000
$200,041
Median house age
76
2,021
Renting percentage
64.2%
54.6%
Housing density (houses/condos per square mile)
8,829.1
2,801.7
House value disparities
18.7%
38.7%
Household income disparities
41.7%
48.3%
Median household income for houses/condes with a mortgage
$210,544
$87,762
Median household income for apartments without a mortgage
$99,969
$55,824
Housing units without a mortgage
1,778 (1.9%)
1,236 (2.9%)
Housing units with both a second mortgage and home equity loan
7,687 (8.3%)
2,537 (6%)
Housing units with a mortgage
91,236 (98.1%)
41,018 (97.1%)
Housing units with a home equity loan
471 (0.5%)
188 (0.4%)
Housing units with a second mortgage
9,395 (10.1%)
3,349 (7.9%)
House/condo owner moved in on average (years ago)
14
10
House/condo renter moved in on average (years ago)
4
2
Housing units lacking complete kitchen facilities
4.7%
9.2%
Housing units lacking complete plumbing facilities
2.7%
5.8%
Housing units in structures
Housing units in structures
San Francisco
St. Louis
One, detached
19.1%
43.2%
One, attached
12.1%
4.1%
Two
9.0%
14.2%
3 or 4
11.4%
13.5%
5 to 9
9.0%
4.9%
10 to 19
9.3%
2.2%
20 to 49
11.3%
3.8%
50 or more
18.7%
13.5%
Mobile homes
0.1%
0.5%
Median real estate property taxes paid for housing units
Self-employed workers in own not incorporated business
30,288
8,126
State government workers
22,691
2,962
Unpaid family workers
399
315
Industries and Occupations
San Francisco excels in the technology and finance industries while St. Louis leads in healthcare, biotechnology, and education sectors. Additionally, San Francisco is known for its arts and entertainment segment, while St. Louis for manufacturing and aerospace.
San Francisco is known for its high-quality healthcare with access to excellent facilities like UCSF Medical Center. St. Louis, too, is renowned for its healthcare facilities, with Barnes-Jewish Hospital rated among the top hospitals in the nation.
Health (county statistics)
Type
San Francisco
St. Louis
General health status score of residents in this county from 1 (poor) to 5 (excellent)
San Francisco is densely populated and offers advanced infrastructure. It experiences issues such as traffic congestion. St. Louis boasts a solid infrastructure with less congestion, but aging infrastructure is a concern.
HMDA - Conventional home purchase loans - Applications denied
Year
San Francisco
St. Louis
1999
1,402
0
2000
1,000
0
2001
733
0
2002
870
0
2003
1,576
1,583
2004
2,147
2,101
2005
2,344
2,853
2006
2,511
3,391
2007
2,117
2,022
2008
1,575
841
2009
952
247
Culture and Food
San Francisco's culture is diverse, with influences from all over the world reflected in its food scene. The city is known for its seafood, sourdough bread, and thriving wine scene. St. Louis offers up a Midwest charm, and its food scene is known for BBQ, toasted ravioli, and gooey butter cake.
Sports Teams
San Francisco residents are fiercely devoted to their sports teams, including the Giants (MLB), 49ers (NFL), and Golden State Warriors (NBA). St. Louis supports the Cardinals (MLB), Blues (NHL), and has a rich history in football.


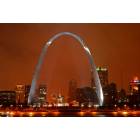
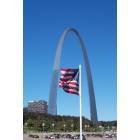
 San Francisco, CA
 St. Louis, MO