San Jose, CA vs Aurora, IL - Advanced U.S. city comparison tool

San Jose, CA vs Aurora, IL

San Jose, CA and Aurora, IL vary widely in terms of climate, cost of living, economy, and cultural facets. San Jose, in the heart of Silicon Valley, is known for its tech-driven economy, Mediterranean climate, and substantial cost of living. Conversely, Aurora has a lower cost of living, a more diversified economy, and experiences all four seasons. Lifestyle, educational opportunities, tax structure, and infrastructure need to be considered when deciding between these two cities, making both cities offer unique opportunities for residents and tourists alike.
 
 
Distance between San Jose, CA and Aurora, IL : 1,803.6 miles

San Jose's population is larger by 449%. Its population has grown by 88,546 people (9.9%) since 2000. The population of Aurora has grown by 36,276 people (25.4%) during that time.

Population
Type San Jose Aurora
Population 983,489 179,266
Female / male percentage 48.6% / 51.4%
48.6%
51.4%
50.1% / 49.9%
50.1%
49.9%
Racial makeup - percentage
Ethnicity San JoseAurora
Asian 38.8% 11.8%
Hispanic 30.6% 43.5%
White Non-Hispanic 22.6% 33.4%
Two or more 3.8% 2.1%
Black 2.9% 8.8%
Pacific Islander 0.5% 0.0%
American Indian 0.2% 0.1%
Racial makeup - absolute values
Ethnicity San JoseAurora
Asian 381,573 21,568
Hispanic 301,143 79,885
White Non-Hispanic 222,495 61,278
Two or more 37,533 3,941
Black 28,786 16,181
Pacific Islander 5,001 0
American Indian 1,631 203

Crime and Safety

San Jose has a lower crime rate overall compared to national averages, making it relatively safe for residents and tourists. However, property crime rates are higher than average. On the other hand, Aurora has made significant progress in reducing crime and is now considered one of the safest cities in Illinois. Both cities devote substantial resources to public safety, with proactive policing strategies and community engagement.

Crime by year per 100,000 residents
Type City-data.com crime indexRobberies per 100,000Murders per 100,000Rapes per 100,000Assaults per 100,000Burglaries per 100,000Theft per 100,000Auto theft per 100,000Arson per 100,000
Year San JoseAuroraSan JoseAuroraSan JoseAuroraSan JoseAuroraSan JoseAuroraSan JoseAuroraSan JoseAuroraSan JoseAuroraSan JoseAurora
2020 268.4 154.3 115.1 39.5 3.9 5.6 55.0 34.4 251.0 253.9 392.9 113.8 1,237.2 952.9 686.2 86.5 24.5 16.2
2019 277.0 131.3 128.7 44.5 3.1 6.0 64.5 29.5 242.0 178.2 395.6 116.1 1,435.0 819.9 589.0 72.1 13.0 8.5
2018 280.9 134.8 152.1 46.7 2.7 2.0 58.7 33.8 210.8 184.7 433.4 158.4 1,290.0 923.7 735.6 60.6 11.6 4.5
2017 272.7 141.2 132.6 53.6 3.1 3.0 55.0 28.3 212.9 173.6 378.4 181.5 1,284.7 1,053.1 777.6 87.3 16.7 9.9
2016 257.2 159.4 116.5 64.6 4.5 3.5 43.3 28.3 208.8 217.2 408.9 219.2 1,227.2 1,123.0 739.4 83.0 13.2 10.4
2015 242.5 168.8 110.5 64.7 2.9 4.5 36.4 29.8 179.8 224.3 474.7 234.3 1,273.7 1,222.7 678.7 79.6 9.0 6.0
2014 241.4 150.6 106.2 53.9 3.2 4.0 30.3 21.5 181.4 199.1 511.7 254.0 1,173.6 1,175.5 748.8 58.4 12.2 9.5
2013 249.5 155.4 110.4 59.3 3.8 2.0 27.2 26.4 182.6 211.9 521.4 287.2 1,250.9 1,139.4 798.9 55.3 13.4 10.0
2012 279.0 170.2 123.7 62.6 4.6 0.0 28.7 32.5 206.3 186.7 533.2 472.6 1,484.8 1,249.0 897.0 63.1 18.0 14.5
2011 226.5 185.4 115.0 79.6 4.1 1.0 23.6 29.2 192.3 210.6 441.2 477.1 1,319.5 1,380.4 535.1 67.5 17.2 10.1
2010 226.9 184.2 103.2 57.1 2.1 2.0 26.7 32.3 207.8 228.9 416.5 414.4 1,345.7 1,419.4 572.0 69.7 19.1 15.7
2009 234.1 203.8 107.4 78.8 2.9 2.9 27.0 0.0 223.1 303.2 392.1 431.1 1,429.2 1,868.3 563.8 111.3 25.5 12.0
2008 236.3 210.9 118.9 88.3 3.3 1.1 23.3 0.0 240.0 307.8 365.7 503.8 1,440.1 1,843.1 553.2 144.4 30.5 18.9
2007 256.9 235.7 114.3 98.4 3.5 6.9 23.2 0.0 261.2 337.1 476.1 527.1 1,412.4 1,900.7 686.2 151.7 36.3 13.2
2006 259.1 238.9 111.9 105.3 3.2 2.4 23.6 0.0 248.2 314.0 480.5 542.3 1,377.2 2,208.4 775.5 168.6 47.5 14.2
2005 234.0 231.1 97.1 105.2 2.9 8.4 28.9 0.0 254.7 287.0 444.7 527.9 1,468.8 2,177.4 604.8 183.5 42.6 18.5
2004 222.2 244.2 86.4 93.9 2.6 10.4 28.2 0.0 254.6 299.5 397.9 541.3 1,558.8 2,384.1 497.1 200.7 27.3 22.7
2003 213.6 257.4 89.6 136.4 3.2 8.2 30.7 0.0 247.8 301.3 364.2 597.6 1,513.4 2,372.0 402.7 222.7 22.9 27.9

City-data.com crime index counts serious crimes and violent crime more heavily. It adjusts for the number of visitors and daily workers commuting into cities. (higher means more crime, U.S. average = 301.1)


Crime per year
Type City-data.com crime indexRobberiesMurdersRapesAssaultsBurglariesTheftAuto theftArson
Year San JoseAuroraSan JoseAuroraSan JoseAuroraSan JoseAuroraSan JoseAuroraSan JoseAuroraSan JoseAuroraSan JoseAuroraSan JoseAurora
2019 277.0 131.3 1,339 89 32 12 671 59 2,517 356 4,114 232 14,924 1,638 6,126 144 135 17
2018 280.9 134.8 1,593 94 28 4 615 68 2,208 372 4,539 319 13,510 1,860 7,704 122 121 9
2017 272.7 141.2 1,376 108 32 6 571 57 2,209 350 3,926 366 13,329 2,123 8,068 176 173 20
2016 257.2 159.4 1,214 130 47 7 451 57 2,175 437 4,260 441 12,786 2,259 7,703 167 137 21
2015 242.5 168.8 1,140 130 30 9 375 60 1,855 451 4,896 471 13,138 2,458 7,001 160 93 12
2014 241.4 150.6 1,072 108 32 8 306 43 1,832 399 5,167 509 11,850 2,356 7,560 117 123 19
2013 249.5 155.4 1,095 119 38 4 270 53 1,812 425 5,173 576 12,411 2,285 7,926 111 133 20
2012 279.0 170.2 1,208 125 45 0 280 65 2,014 373 5,206 944 14,498 2,495 8,759 126 176 29
2011 226.5 185.4 1,101 158 39 2 226 58 1,840 418 4,223 947 12,628 2,740 5,121 134 165 20
2010 226.9 184.2 976 113 20 4 253 64 1,966 453 3,940 820 12,730 2,809 5,411 138 181 31
2009 234.1 203.8 1,025 138 28 5 258 0 2,128 531 3,741 755 13,635 3,272 5,379 195 243 21
2008 236.3 210.9 1,124 154 31 2 220 0 2,268 537 3,457 879 13,612 3,216 5,229 252 288 33
2007 256.9 235.7 1,068 172 33 12 217 0 2,441 589 4,449 921 13,200 3,321 6,413 265 339 23
2006 259.1 238.9 1,030 178 29 4 217 0 2,285 531 4,423 917 12,678 3,734 7,139 285 437 24
2005 234.0 231.1 884 176 26 14 263 0 2,319 480 4,049 883 13,374 3,642 5,507 307 388 31
2004 222.2 244.2 785 153 24 17 256 0 2,314 488 3,616 882 14,165 3,885 4,517 327 248 37
2003 213.6 257.4 815 215 29 13 279 0 2,255 475 3,314 942 13,770 3,739 3,664 351 208 44

City-data.com crime index counts serious crimes and violent crime more heavily. It adjusts for the number of visitors and daily workers commuting into cities. (higher means more crime, U.S. average = 301.1)

Sex Offenders

According to our data, there are 1,806 registered sex offenders living in San Jose and 247 registered sex offenders living in .
The ratio of residents to sex offenders in San Jose is 568 to 1; the ratio in Aurora is 798 to 1.
The number of registered sex offenders compared to the number of residents is larger in San Jose than in Aurora.

Cost of Living

San Jose is one of the most expensive cities to live in the United States, primarily driven by the high cost of housing. Living in Aurora is significantly less expensive, with housing costs well below the national average. Related expenses such as groceries, healthcare, and transportation are also less expensive in Aurora.

Income Tax

California's income tax rates are among the highest in the U.S., which impacts residents of San Jose. Illinois' income tax system is a flat rate, making it lower for most income levels compared to California.

Property Tax

Property taxes in both San Jose and Aurora are relatively high. However, because housing prices are lower in Aurora, most homeowners tend to pay less in property taxes than they would for a similarly sized property in San Jose.

Sales Tax

San Jose has a higher sales tax compared to Aurora. The combined sales tax rate for San Jose is about 9.25%, while in Aurora it's at about 8%. However, shopping in California is more expensive generally due to the high cost of goods and services.
Income
Type San Jose Aurora
Estimated median household income $126,377 $83,996
Estimated per capita income $57,357 $34,054
Cost of living index (U.S. average is 100) 127.4 100.6

If you make $50,000 in Aurora, you will have to make $63,320 in San Jose to maintain the same standard of living.

Geographical Conditions

San Jose, surrounded by mountains, offers outdoor enthusiasts numerous hiking and biking trails. Aurora, sitting along the Fox River, provides a variety of recreational opportunities including boating, fishing, and scenic parks.
Geographical information
Type San Jose Aurora
Land area 174.9 sq. miles 38.5 sq. miles
Population density 5,624.3 people per sq. mile 4,653.1 people per sq. mile
Elevation 87 feet 676 feet
Relative area comparison
San Jose, CA Aurora, IL
First ancestry reported - percentage
Ancestry San JoseAurora
English 1.4% 1.3%
German 1.4% 5.4%
Italian 1.4% 2.4%
Irish 1.1% 2.4%
Portuguese 0.7% 0.0%
Russian 0.7% 0.6%
Polish 0.4% 1.9%
Ukrainian 0.3% 0.2%
French 0.2% 0.1%
Greek 0.2% 0.3%
Norwegian 0.2% 0.6%
Scottish 0.2% 0.2%
Swedish 0.2% 0.3%
Population origin - absolute values
Ancestry San JoseAurora
Italian 9,340 2,439
English 8,865 1,320
German 8,771 5,493
Irish 7,368 2,427
Portuguese 4,318 0
Russian 4,221 627
Polish 2,310 1,971
Ukrainian 1,617 252
Scottish 1,579 183
French 1,551 143
Swedish 1,265 322
Greek 1,143 275
Norwegian 1,109 566
Dutch 1,052 95
Scotch-Irish 774 202
Danish 529 43
Arab 465 5
Hungarian 446 54
French Canadian 430 144
Lithuanian 341 127
Foreign born residents - absolute values
Type Count
Region San JoseAurora
All 405,569 47,514
Africa 7,882 1,143
Asia 261,138 13,649
Europe 22,903 2,847
Latin America 104,982 29,251
North America 3,409 270
Oceania 1,982 39
Foreign born residents - percentage
Type Percentage
Region San JoseAurora
All 41.0% 26.1%
Africa 0.8% 0.6%
Asia 26.4% 7.5%
Europe 2.3% 1.6%
Latin America 10.6% 16.0%
North America 0.3% 0.1%
Oceania 0.2% 0.0%

Education

San Jose's robust educational environment includes a number of high-ranking public and private schools, as well as renowned universities like San Jose State University. Aurora also offers quality education, including a top-notch school district and access to higher education facilities in nearby Chicago. Both cities value education and offer a wide range of opportunities for students.
School enrollment
Type San Jose Aurora
Nursery, preschool 12,614 (5%) 2,560 (5%)
Kindergarten 11,028 (4.4%) 2,154 (4.2%)
Grade 1 to 4 43,599 (17.4%) 11,118 (21.5%)
Grade 5 to 8 48,820 (19.5%) 10,654 (20.6%)
Grade 9 to 12 53,891 (21.5%) 12,585 (24.4%)
College undergrad 63,451 (25.4%) 9,005 (17.4%)
Graduate or professional 16,871 (6.7%) 3,586 (6.9%)
Students in private schools - absolute values
Type Count
Grade San JoseAurora
Grades 1 to 8 (elementary and middle school) 12,274 1,526
Grades 9 to 12 (high school) 6,754 1,138
Undergraduate colleges 5,716 3,559
Students in private schools - percentage
Type Percentage
Grade San JoseAurora
Grades 1 to 8 (elementary and middle school) 13.3% 7.0%
Grades 9 to 12 (high school) 12.5% 9.0%
Undergraduate colleges 9.0% 39.5%
Educational attainment
Type San Jose Aurora
Less than high school 14.1% 16.8%
High school or equiv. 16.3% 22%
Less than 1 year of college 4.8% 5.9%
1 or more years of college 11.4% 11.2%
Associate degree 7.5% 6.5%
Bachelor's degree 26.4% 23.3%
Master's degree 14.7% 12.3%
Profess. school degree 2.1% 1.5%
Doctorate degree 2.6% 0.7%
Education level (25-year-olds and older)
Type San Jose Aurora
Bachelor's degree or higher 45.8% 37.7%
Graduate or professional degree 19.4% 14.4%
High school or higher 85.9% 83.2%

Work and Economy

San Jose's economy is driven by the tech industry, with many global tech companies headquartered here. Conversely, Aurora has a more diversified economy, with healthcare, education, and manufacturing among the top industries. Unemployment rates are low in both cities, and job opportunities are plentiful, but the high wages in San Jose's tech sector significantly increase the city's median income.

Biggest Employers

Some of the biggest employers in San Jose include Cisco Systems, eBay, and Adobe Systems. Aurora is home to several major employers including the Caterpillar Inc., Rush-Copley Medical Center, and the West Aurora School District. Both cities offer a stable job market with major employers in various sectors.
Employment and residency - absolute values
Kind San JoseAurora
Work and live in this city 212,187 20,326
Work and live in this county 441,542 59,882
Workers who work outside the city they live in 682,756 122,664
Workers who work outside the county they live in 42,216 34,808
Working at home 143,618 20,380
Not working at home 340,140 74,310
Employment and residency - percentage
Kind San JoseAurora
Work and live in this city 49.6% 30.3%
Work and live in this county 91.3% 63.2%
Workers who work outside the city they live in 50.4% 69.7%
Workers who work outside the county they live in 8.7% 36.8%
Working at home 29.7% 21.5%
Not working at home 70.3% 78.5%
Geographical mobility: all
Type all
Mobility San JoseAurora
Same house 1 year ago 87.6% 86.9%
Moved from abroad 0.7% 0.4%
Moved within same county 8.8% 6.2%
Moved from different state 0.9% 1.3%
Moved within same state 2.1% 5.2%
Geographical mobility: Asian
Type Asian
Mobility San JoseAurora
Same house 1 year ago 87.7% 88.4%
Moved from abroad 1.1% 2.1%
Moved within same county 8.2% 6.8%
Moved from different state 1.4% 1.3%
Moved within same state 1.6% 1.4%
Geographical mobility: Black
Type Black
Mobility San JoseAurora
Same house 1 year ago 81.4% 87.1%
Moved from abroad 0.2% 0%
Moved within same county 11.5% 4.2%
Moved from different state 0.6% 2.7%
Moved within same state 6.3% 6.0%
Geographical mobility: White
Type White
Mobility San JoseAurora
Same house 1 year ago 88.6% 90.8%
Moved from abroad 0.4% 0.4%
Moved within same county 8.0% 2.4%
Moved from different state 0.9% 0.7%
Moved within same state 2.1% 5.7%
Building permits
Type Average valueCount
City San JoseAuroraSan JoseAurora
1997 $152,100 $106,800 2,329 908
1998 $158,500 $107,800 1,963 1,183
1999 $160,700 $97,800 1,596 1,284
2000 $162,200 $109,800 1,336 1,030
2001 $158,800 $137,900 540 1,156
2002 $187,000 $112,900 620 1,067
2003 $164,800 $106,900 1,135 836
2004 $188,800 $105,900 946 843
2005 $166,100 $137,800 805 989
2006 $154,600 $102,600 602 696
2007 $151,700 $130,100 325 338
2008 $163,800 $143,000 214 127
2009 $240,400 $129,500 31 49
2010 $245,300 $136,000 74 71
2011 $241,300 $261,000 83 67
2012 $286,600 $252,100 186 74
2013 $259,300 $284,500 274 154
2014 $262,900 $260,200 384 101
2015 $305,300 $284,000 155 95
2016 $265,900 $282,900 222 155
2017 $227,700 $295,500 177 127
2018 $193,700 $278,100 238 121
2019 $162,900 $281,500 514 72
2020 $277,800 $322,000 312 91
2021 $275,200 $322,000 299 55

There were 299 building permits issued in San Jose in 2012 (216 more than in 2011) compared to 55 building permits issued in Aurora in 2012 (12 less than in 2011).

In San Jose (Santa Clara County), 70.0% voted for Democrats and 27.1% for Republicans in 2012 Presidential Election. In Aurora (Kane County), 49.7% voted for Democrats and 48.6% for Republicans.

Elections
Type DemocratsRepublicansOther
Year San JoseAuroraSan JoseAuroraSan JoseAurora
2020 72.7% 56.3% 25.2% 41.9% 2.1% 1.8%
2016 72.7% 52.0% 20.6% 41.5% 6.7% 6.4%
2012 70.0% 49.7% 27.1% 48.6% 2.9% 1.6%
2008 69.6% 55.4% 28.6% 43.6% 1.8% 1.0%
2004 64.3% 44.1% 34.8% 55.1% 0.9% 0.8%
2000 60.7% 42.5% 34.4% 54.5% 4.9% 3.0%
1996 56.9% 41.8% 32.2% 47.4% 11.0% 10.8%
Breakdown of population affiliated with a religious congregation
Type AdherentsCongregations
Religion San JoseAuroraSan JoseAurora
CATHOLIC CHURCH 25.1% 30.2% 6.0% 8.6%
MUSLIM ESTIMATE 1.1% 2.6% 1.8% 1.2%
SOUTHERN BAPTIST CONVENTION 0.9% 0.5% 7.7% 4.9%
EPISCOPAL CHURCH 0.5% 0.6% 2.3% 2.5%
SEVENTH DAY ADVENTIST CHURCH 0.4% 0.3% 2.6% 2.8%
EVANGELICAL LUTHERAN CHURCH IN AMERICA 0.3% 1.8% 2.3% 4.3%
LUTHERAN CHURCH 0.2% 2.6% 1.4% 6.1%
AMERICAN BAPTIST CHURCHES IN THE USA 0.1% 0.9% 1.1% 3.1%

Weather

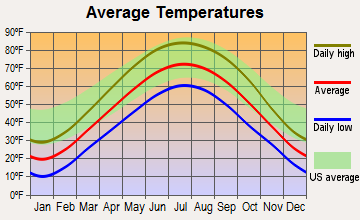
The weather in San Jose is of a Mediterranean type, with dry, hot summers and mild, wet winters. On the other hand, Aurora experiences a typical midwestern climate with hot summers and very cold winters. San Jose offers a more consistent climate enjoyed by both residents and tourists, whilst Aurora's four distinct seasons can offer a variety of experiences.
Weather and climate
Type San Jose Aurora
Temperature - Average 60.9°F 48°F
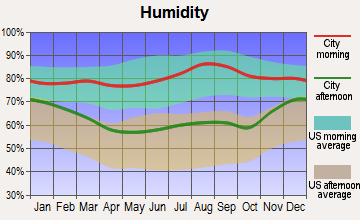
Humidity - Average morning or afternoon humidity 77.3% 75.7%
Humidity - Differences between morning and afternoon humidity 35.5% 31.3%
Humidity - Maximum monthly morning or afternoon humidity 87% 85.3%
Humidity - Minimum monthly morning or afternoon humidity 51.6% 54%
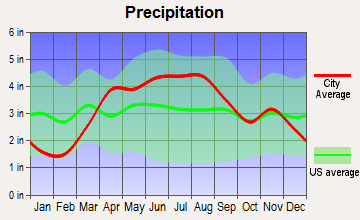
Precipitation - Yearly average 16.1 in 38.4 in
Snowfall - Yearly average 0 in 77.2 in
Clouds - Number of days clear of clouds 27.4% 14.1%
Sunshine amount - Average 73.8% 56.8%
Sunshine amount - Differences during a year 23% 33%
Sunshine amount - Maximum monthly 77.4% 68%
Sunshine amount - Minimum monthly 54.4% 35%
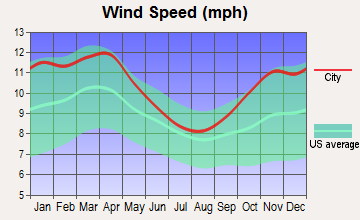
Wind speed - Average 10.3 mph 10.7 mph

Average climate in San Jose, California

Chicago, Illinois average temperatures Chicago, Illinois average precipitation Chicago, Illinois humidity Chicago, Illinois wind speed Chicago, Illinois snowfall Chicago, Illinois sunshine Chicago, Illinois clear and cloudy days
 

Average climate in Aurora, Illinois

Chicago, Illinois average temperatures Chicago, Illinois average precipitation Chicago, Illinois humidity Chicago, Illinois wind speed Chicago, Illinois snowfall Chicago, Illinois sunshine Chicago, Illinois clear and cloudy days
 

Air pollution
Type AQICONO2OZONEPBPM10PM25SO2
Year San JoseAuroraSan Jose San Jose San JoseAuroraSan Jose Aurora San JoseAuroraSan JoseAurora
2018 94 85 0.49 N/A 14.5 N/A 22.2 26.6 0.006 N/A 23.9 N/A 12.5 10.6 0.2 0.9
2017 91 76 0.50 N/A 14.6 N/A 23.5 27.8 0.004 N/A 26.2 N/A 10.2 N/A 0.2 1.0
2016 69 77 0.47 N/A 13.7 N/A 22.4 27.6 0.003 N/A 27.7 N/A 8.8 N/A 0.2 0.5
2015 84 76 0.52 N/A 15.4 N/A 22.3 26.3 0.004 N/A 36.0 N/A 9.2 N/A 0.3 1.5
2014 83 72 0.40 N/A 13.9 N/A 21.5 24.8 0.004 N/A 46.2 N/A 8.2 N/A 0.2 1.0
2013 90 72 0.41 N/A 15.2 N/A 20.8 24.3 0.005 N/A N/A N/A 12.4 N/A 0.3 2.1
2012 74 87 0.35 N/A 13.3 N/A 21.8 25.7 0.003 N/A N/A N/A 10.1 10.3 0.3 2.5
2011 83 82 0.37 N/A 14.8 N/A 20.6 24.6 0.003 N/A 26.9 N/A 12.3 12.8 0.3 3.1
2010 88 87 0.35 N/A 14.4 N/A 20.4 24.3 0.004 N/A 26.5 N/A 9.0 12.6 0.4 2.7
2009 89 94 0.40 N/A 14.7 N/A 18.2 21.7 0.004 N/A 26.4 N/A 9.3 13.2 0.3 2.7
2008 100 87 0.45 N/A 16.7 N/A 20.6 22.4 N/A N/A 29.0 N/A 12.6 11.8 N/A 4.2
2007 92 111 0.44 N/A 16.6 N/A 20.0 23.6 0.009 N/A 32.6 N/A 11.1 12.7 N/A 4.8
2006 100 68 0.46 N/A 18.0 N/A 21.8 20.2 N/A N/A 32.1 N/A 11.1 N/A N/A 4.3
2005 95 84 0.68 N/A 18.6 N/A 20.0 22.7 N/A N/A 32.0 N/A 11.6 N/A N/A 4.7
2004 98 71 0.63 N/A 18.5 N/A 20.4 19.8 N/A N/A 32.8 N/A 9.9 N/A N/A 4.5
2003 87 80 0.73 N/A 20.6 N/A 19.1 20.2 N/A N/A 31.8 N/A N/A N/A N/A 4.0
2002 78 90 0.65 N/A 19.5 N/A 18.0 21.2 0.006 N/A 37.1 N/A N/A N/A N/A 4.6
2001 75 85 0.61 N/A 18.5 N/A 16.8 20.6 0.008 N/A 37.8 N/A N/A N/A N/A 5.4
2000 65 64 0.66 N/A 18.9 N/A 15.6 19.4 0.009 N/A N/A N/A N/A N/A N/A 4.2
Natural disasters
Type San Jose Aurora
Tornado activity compared to U.S. average 9% 153.1%
Earthquake activity compared to U.S. average 7,785.3% 154.4%
Natural disasters compared to U.S. average 19% 15%

Transportation

Transportation in San Jose is highly developed with a network of freeways, public transit options including VTA light-rail and bus services, and numerous bike lanes. Aurora also has solid infrastructure including Metra rail service to Chicago and a comprehensive local bus system. Commuting times in both cities are fairly average, with many residents commuting 30-45 minutes each way to work.
Transport
Type San Jose Aurora
Amtrak stations 1 0
Amtrak stations nearby 3 3
FAA registered aircraft 553 30
FAA registered aircraft manufacturers and dealers 13 0
Means of transportation to work
Type San Jose Aurora
Bicycle 1% 0.2%
Bus 1.1% 0.3%
Carpooled 11.4% 11%
Car alone 80.5% 85.1%
Motorcycle 0.2% 0.1%
Railroad 0.2% 0.1%
Subway 0.2% 0.3%
Walked 3.3% 1.8%
Means of transportation to work
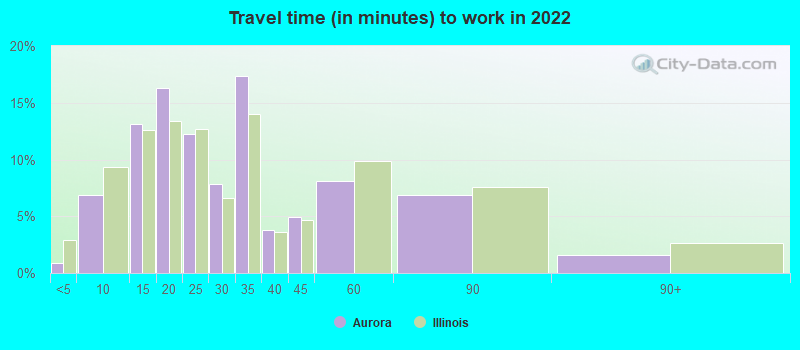
Average travel time to work
Type San Jose Aurora
Average 29.2 min 27 min
Other means 27.9 min 28.1 min
Public transportation 48.5 min 61.4 min
Travel time to work
Time leaving to work
Travel time to work
Time leaving to work
Private vehicle occupancy
Type San Jose Aurora
Average 1.2 1.3
Drove alone 87.3% 86.1%
In 2 person carpool 8.9% 9.7%
In 3 person carpool 1.9% 0.6%
In 4 person carpool 1.1% 1%
In 5-6 person carpool 0.6% 2.5%
In 7+ person carpool 0.2% 0%

How many people usually rode to work in the car, truck or van.

Real Estate

The real estate market in San Jose is extremely expensive, with median home prices considerably higher than the national average. On the flip side, real estate in Aurora is quite affordable, with the cost of housing well below the national average. Both cities offer a variety of housing options, from apartments to single-family homes.

Neighborhoods

San Jose offers diverse neighborhoods, each offering a unique blend of cultures, food, and experiences. Downtown San Jose is known for its bustling nightlife and dining scene. Aurora's neighborhoods cater to a variety of lifestyles and budgets, with historic houses, suburban-style developments, and modern apartments available.
Houses and residents
Type San Jose Aurora
Houses 340,561 64,677
Average household size (people) 3.1 3.1
Median year apartment built 1979 1977
Median year house/condo built 1973 1990
Length of stay in the house since moving in 15.6 years 13.1 years
Houses occupied 322,881 (94.8%) 62,379 (96.4%)
Houses occupied by owners 179,797 (55.7%) 43,361 (69.5%)
Houses occupied by renters 143,084 (44.3%) 19,018 (30.5%)
Median rent asked for vacant for-rent units $3,214 $1,534
Median monthly housing costs $2,463 $1,408
Median price asked for vacant for-sale houses and condos $1,197,016 $92,244
Estimated median house or condo value Over $1,000,000 $232,400
Median numbers of rooms 4.9 5.7
Median number of rooms in apartments 3.6 4.3
Median number of rooms in houses and condos 6 6.4
Median house price - detached houses Over $1,000,000 $255,964
Median house price - in 2-unit structures $753,788 $145,729
Median house price - in 3-to-4-unit structures $680,453 $141,854
Median house price - in 5 or more unit structures $688,625 $103,693
Median house price - mobile homes $240,963 $317,080
Median house price - Townhouses or other attached units $892,629 $202,183
Median house price - All housing units Over $1,000,000 $240,490
Median house age 45 34
Renting percentage 41.5% 30.4%
Housing density (houses/condos per square mile) 1,947.6 1,678.8
House value disparities 21.2% 26.4%
Household income disparities 38.3% 40.1%
Median household income for houses/condes with a mortgage $197,583 $112,817
Median household income for apartments without a mortgage $103,711 $76,448
Housing units without a mortgage 2,632 (2.1%) 296 (1%)
Housing units with both a second mortgage and home equity loan 13,499 (10.6%) 1,148 (3.8%)
Housing units with a mortgage 124,224 (97.9%) 30,127 (99%)
Housing units with a home equity loan 346 (0.3%) 0 (0%)
Housing units with a second mortgage 16,249 (12.8%) 1,552 (5.1%)
House/condo owner moved in on average (years ago) 14 11
House/condo renter moved in on average (years ago) 3 1
Housing units lacking complete kitchen facilities 1.2% 1.3%
Housing units lacking complete plumbing facilities 0.6% 0.5%
Housing units in structures
Housing units in structures San JoseAurora
One, detached 50.9% 59.3%
One, attached 11.5% 16.8%
Two 1.1% 3.6%
3 or 4 5.0% 3.4%
5 to 9 5.1% 3.5%
10 to 19 4.5% 6.0%
20 to 49 4.5% 2.2%
50 or more 14.2% 4.8%
Mobile homes 3.1% 0.3%
Boats, RVs, vans, etc. 0.1% 0.0%
Median real estate property taxes paid for housing units
Type San Jose Aurora
With mortgages $9,868 (0.9%) $6,128 (2.6%)
With no mortgages $5,520 (0.5%) $5,414 (2.4%)
Marital status
Type San Jose Aurora
Divorced 7.3% 11%
Never married 37.3% 33.8%
Now married 49.6% 49.1%
Separated 1.7% 1.6%
Widowed 4.1% 4.5%
Class of workers - percentage
Class of Workers San JoseAurora
Employee of private company 73.7% 74.9%
Local government workers 8.2% 7.8%
Private not-for-profit wage and salary workers 6.2% 6.4%
Self-employed workers in own not incorporated business 5.7% 3.7%
Self-employed in own incorporated business 2.9% 3.9%
State government workers 2.0% 1.5%
Federal government workers 1.3% 1.8%
Class of workers - absolute values
Class of Workers San JoseAurora
Employee of private company 370,849 71,814
Federal government workers 6,457 1,728
Local government workers 41,343 7,463
Private not-for-profit wage and salary workers 31,011 6,159
Self-employed in own incorporated business 14,513 3,692
Self-employed workers in own not incorporated business 28,517 3,558
State government workers 10,222 1,410
Unpaid family workers 472 54

Industries and Occupations

The tech industry dominates San Jose, with software engineers and developers among the most common occupations. Aurora's economy is more diverse, with healthcare workers, educators, and manufacturing workers making up a significant portion of the workforce. The tech influence in San Jose attracts highly educated professionals, while Aurora's diversified economy provides opportunities for a wide variety of skills and education levels.
Most common male industries
Industry San JoseAurora
Manufacturing 20.8% 18.2%
Professional, scientific, and technical services 14.6% 8.6%
Construction 11.1% 6.1%
Retail trade 9.2% 11.4%
Information 6.5% 1.5%
Health care and social assistance 5.5% 4.3%
Administrative and support and waste management services 5.4% 8.1%
Accommodation and food services 5.3% 5.6%
Transportation and warehousing 4.4% 14.4%
Educational services 4.2% 4.6%
Finance and insurance 2.9% 5.0%
Other services, except public administration 2.5% 3.5%
Public administration 2.2% 1.9%
Real estate and rental and leasing 1.6% 1.1%
Wholesale trade 1.5% 3.1%
Arts, entertainment, and recreation 1.4% 1.6%
Utilities 0.5% 0.8%
Agriculture, forestry, fishing and hunting 0.4% 0.0%
Most common female industries
Industry San JoseAurora
Health care and social assistance 20.3% 17.8%
Professional, scientific, and technical services 13.6% 5.3%
Manufacturing 12.8% 10.7%
Educational services 11.0% 13.5%
Retail trade 8.3% 9.6%
Accommodation and food services 5.9% 9.2%
Other services, except public administration 4.9% 4.1%
Administrative and support and waste management services 4.6% 6.4%
Finance and insurance 4.0% 6.6%
Public administration 3.7% 3.1%
Information 3.2% 1.4%
Real estate and rental and leasing 1.8% 2.0%
Transportation and warehousing 1.7% 5.9%
Construction 1.2% 0.4%
Arts, entertainment, and recreation 1.1% 0.6%
Wholesale trade 1.1% 2.6%
Agriculture, forestry, fishing and hunting 0.4% 0.4%
Utilities 0.3% 0.3%
Mining, quarrying, and oil and gas extraction 0.1% 0.0%
Most common male occupations
Occupation San JoseAurora
Computer and mathematical occupations 13.1% 6.0%
Management occupations 13.0% 11.9%
Architecture and engineering occupations 11.1% 3.0%
Construction and extraction occupations 8.6% 5.8%
Sales and related occupations 7.5% 8.0%
Office and administrative support occupations 6.2% 7.4%
Production occupations 4.8% 10.9%
Business and financial operations occupations 4.6% 5.1%
Food preparation and serving related occupations 3.9% 3.6%
Transportation occupations 3.6% 7.6%
Building and grounds cleaning and maintenance occupations 3.4% 5.0%
Installation, maintenance, and repair occupations 3.3% 4.0%
Material moving occupations 2.4% 9.2%
Educational instruction, and library occupations 2.4% 3.9%
Arts, design, entertainment, sports, and media occupations 2.2% 0.0%
Firefighting and prevention, and other protective service workers including supervisors 2.0% 1.5%
Healthcare support occupations 1.7% 1.2%
Health diagnosing and treating practitioners and other technical occupations 1.4% 0.9%
Life, physical, and social science occupations 1.2% 1.7%
Personal care and service occupations 0.9% 1.2%
Most common female occupations
Occupation San JoseAurora
Office and administrative support occupations 14.4% 17.5%
Management occupations 11.2% 6.4%
Business and financial operations occupations 9.2% 8.0%
Educational instruction, and library occupations 8.6% 8.7%
Sales and related occupations 7.2% 9.2%
Healthcare support occupations 5.8% 4.9%
Health diagnosing and treating practitioners and other technical occupations 5.5% 4.7%
Computer and mathematical occupations 5.0% 1.8%
Food preparation and serving related occupations 5.0% 6.7%
Production occupations 4.1% 6.5%
Personal care and service occupations 3.7% 5.3%
Building and grounds cleaning and maintenance occupations 3.5% 3.6%
Architecture and engineering occupations 3.3% 0.4%
Community and social service occupations 2.3% 2.8%
Arts, design, entertainment, sports, and media occupations 2.1% 1.1%
Material moving occupations 2.1% 4.1%
Health technologists and technicians 1.7% 2.6%
Life, physical, and social science occupations 1.7% 0.8%
Legal occupations 1.3% 1.3%
Transportation occupations 0.7% 1.5%
Food environment data per 10,000 residents
Food environment statistics San JoseAurora
Number of convenience stores (no gas) 1.4 2.0
Number of convenience stores (with gas) 0.7 0.5
Number of full-service restaurants 8.6 5.9
Number of grocery stores 2.0 1.6
Food environment - absolute values
Food environment statistics San JoseAurora
Number of convenience stores (no gas) 239 97
Number of convenience stores (with gas) 117 27
Number of full-service restaurants 1,488 294
Number of grocery stores 345 80
Number of supercenters and club stores 7 4
Obesity and diabetes
Food environment statistics rate San JoseAurora
Adult diabetes rate 7.1% 7.2%
Adult obesity rate 19.0% 27.2%
Low-income preschool obesity rate 16.6% 15.1%

Health Care

San Jose is home to several world-class health care facilities, including Stanford Health Care and El Camino Hospital. Aurora also offers high-quality health care with several hospitals and specialty care clinics serving the area.
Health (county statistics)
Type San Jose Aurora
General health status score of residents in this county from 1 (poor) to 5 (excellent) 3.6 3.5
Average weight of females (lbs) 151 lbs 164.3 lbs
Average weight of males (lbs) 182.6 lbs 197.3 lbs
Residents visited a dentist within the past year 73.5% 68%
Residents exercised in the past month 76.1% 73%
Adult residents drank alcohol in the past 30 days 61.3% 58.1%
Residents smoked 100+ cigarettes in their lives 30.2% 40.5%

Fatal vehicle accidents per 100,000 residents
Type Total count per 100,000Drunk per 100,000Fatal count per 100,000Pedestrian count per 100,000Person count per 100,000Vehicle count per 100,000
Year San JoseAuroraSan JoseAuroraSan JoseAuroraSan JoseAuroraSan JoseAuroraSan JoseAurora
2021 7.7 3.3 0.0 0.0 7.8 3.9 3.6 1.7 14.0 6.7 12.4 5.6
2020 5.6 4.4 1.2 2.2 5.7 5.0 2.6 0.6 10.8 11.1 8.8 7.2
2019 7.2 4.6 1.7 2.0 7.8 4.6 3.5 2.0 15.7 7.6 10.8 5.6
2018 6.0 1.0 1.5 0.0 6.3 1.0 3.0 1.0 11.9 1.5 9.1 1.0
2017 4.4 2.0 1.3 1.0 4.5 2.0 1.7 1.0 8.0 2.0 6.1 2.0
2016 5.7 4.0 2.0 1.5 6.2 4.0 2.5 1.0 12.7 9.0 8.4 5.5
2015 6.9 2.0 1.4 0.5 7.4 2.5 2.6 0.5 15.8 7.0 10.5 3.0
2014 5.5 2.0 2.4 1.0 5.5 2.0 2.6 1.5 11.6 3.5 9.3 3.0
2013 5.0 1.5 1.8 0.5 5.3 2.5 3.3 2.0 10.5 4.5 7.2 2.5
2012 4.0 0.5 0.8 0.0 4.3 0.5 1.6 0.0 10.2 1.0 6.6 1.0
2011 3.9 2.5 0.9 1.5 3.9 2.5 2.2 0.5 7.5 4.0 6.0 3.5
2010 3.7 1.0 1.3 0.0 3.9 1.0 1.0 0.0 8.7 1.5 6.8 1.0
2009 4.6 2.9 1.2 0.6 4.8 2.9 1.7 1.2 10.1 5.8 6.2 4.0
2008 4.4 2.3 2.8 1.8 4.5 2.3 1.6 0.6 10.6 4.7 6.3 2.9
2007 4.7 3.0 2.0 0.0 5.4 3.0 1.8 1.2 11.9 9.5 7.2 4.7
2006 5.0 3.6 1.4 1.8 5.4 3.6 2.6 0.6 13.9 10.8 7.5 7.2
2005 5.1 3.6 2.4 0.0 5.7 3.6 1.9 0.0 11.9 10.3 8.1 7.8
2004 4.5 1.8 1.3 0.0 4.9 1.8 2.9 0.0 11.8 5.5 7.3 3.0
2003 4.1 3.1 1.3 1.2 4.3 3.7 1.3 0.6 11.7 7.5 5.6 4.4
2002 6.1 5.1 2.3 2.6 6.5 5.1 2.9 1.3 16.0 9.6 8.2 6.4
2001 5.9 3.3 1.5 1.3 6.2 3.3 2.0 1.3 13.0 11.3 7.8 5.3
2000 5.7 6.3 2.9 2.8 5.8 6.3 2.6 1.4 15.6 19.6 8.5 12.6
1999 5.3 3.1 1.3 0.0 5.8 3.1 2.1 0.8 14.3 13.9 8.3 7.0
1998 5.2 4.0 1.2 1.6 5.3 6.4 2.8 3.2 16.1 15.2 8.1 5.6
1997 6.0 3.3 2.1 1.7 6.3 3.3 2.5 0.0 16.1 5.8 8.3 5.8
1996 5.4 9.4 2.2 4.3 5.5 9.4 2.6 2.6 14.5 21.4 7.8 12.8
1995 4.6 7.0 1.2 3.5 5.1 7.0 2.8 8.8 12.3 27.2 6.3 8.8
1994 4.2 6.3 1.2 1.8 4.3 6.3 1.7 3.6 12.2 13.5 7.0 9.0
1993 5.1 8.3 1.5 2.8 5.1 8.3 2.2 2.8 11.8 20.3 7.0 12.0
1992 6.5 8.5 2.8 7.6 6.7 8.5 3.0 1.9 15.0 21.7 8.2 11.3
1991 7.2 5.8 3.7 3.9 8.3 6.8 2.5 0.0 19.3 14.5 10.3 8.7
1990 8.3 6.9 3.6 1.0 9.3 8.9 0.0 0.0 22.9 14.9 10.9 8.9
1989 8.7 9.2 4.3 4.1 9.0 9.2 0.0 0.0 20.3 22.5 12.5 10.2
1988 10.2 5.2 4.1 2.1 11.0 6.3 0.0 0.0 25.7 12.5 14.5 7.3
1987 8.1 6.4 4.5 5.3 9.2 9.6 0.0 0.0 20.9 24.4 10.6 13.8
1986 8.7 6.5 3.2 2.2 9.2 6.5 0.0 0.0 19.8 14.1 12.8 8.7
1985 11.9 7.7 5.7 3.3 13.7 10.0 0.0 0.0 33.3 21.0 17.0 12.2
1984 9.4 10.2 3.8 5.6 11.0 10.2 0.0 0.0 25.9 19.2 15.4 15.8
1983 8.9 6.9 3.1 3.5 9.3 6.9 0.0 0.0 24.1 12.7 13.8 9.2
1982 11.1 7.1 6.2 5.9 12.0 7.1 0.0 0.0 27.6 18.8 15.3 10.6
1981 14.3 7.2 8.4 2.4 14.7 7.2 0.0 0.0 35.7 18.0 20.8 10.8
1980 15.3 11.1 8.1 3.7 16.2 12.3 0.0 0.0 35.9 32.0 22.1 13.5
1979 17.8 6.2 8.3 3.7 18.8 8.7 0.0 0.0 41.5 13.6 24.2 8.7
1978 12.6 10.0 7.2 3.8 14.1 10.0 0.0 0.0 32.2 31.3 20.5 15.0
1977 12.8 10.1 6.1 5.0 14.2 12.6 0.0 0.0 30.8 22.7 18.8 12.6
1976 13.0 3.8 5.9 2.5 13.9 5.1 0.0 0.0 30.1 12.7 17.6 5.1
1975 13.4 3.9 6.1 2.6 14.3 5.1 0.0 0.0 31.0 12.8 18.2 5.1

Fatal vehicle accidents
Type Total countDrunkFatal countPedestrian countPerson countVehicle count
Year San JoseAuroraSan JoseAuroraSan JoseAuroraSan JoseAuroraSan JoseAuroraSan JoseAurora
1975 73 3 33 2 78 4 0 0 169 10 99 4
1976 73 3 33 2 78 4 0 0 169 10 99 4
1977 74 8 35 4 82 10 0 0 178 18 109 10
1978 75 8 43 3 84 8 0 0 192 25 122 12
1979 109 5 51 3 115 7 0 0 254 11 148 7
1980 96 9 51 3 102 10 0 0 226 26 139 11
1981 92 6 54 2 95 6 0 0 230 15 134 9
1982 73 6 41 5 79 6 0 0 182 16 101 9
1983 60 6 21 3 63 6 0 0 163 11 93 8
1984 65 9 26 5 76 9 0 0 179 17 106 14
1985 84 7 40 3 97 9 0 0 235 19 120 11
1986 63 6 23 2 66 6 0 0 143 13 92 8
1987 60 6 33 5 68 9 0 0 154 23 78 13
1988 77 5 31 2 83 6 0 0 193 12 109 7
1989 67 9 33 4 69 9 0 0 156 22 96 10
1990 65 7 28 1 73 9 0 0 179 15 85 9
1991 57 6 29 4 65 7 20 0 152 15 81 9
1992 52 9 22 8 53 9 24 2 119 23 65 12
1993 41 9 12 3 41 9 18 3 95 22 56 13
1994 34 7 10 2 35 7 14 4 99 15 57 10
1995 38 8 10 4 42 8 23 10 101 31 52 10
1996 45 11 18 5 46 11 22 3 121 25 65 15
1997 51 4 18 2 54 4 21 0 137 7 71 7
1998 45 5 10 2 46 8 24 4 139 19 70 7
1999 46 4 11 0 50 4 18 1 124 18 72 9
2000 51 9 26 4 52 9 23 2 140 28 76 18
2001 54 5 14 2 56 5 18 2 118 17 71 8
2002 55 8 21 4 59 8 26 2 144 15 74 10
2003 37 5 12 2 39 6 12 1 105 12 50 7
2004 41 3 12 0 44 3 26 0 106 9 66 5
2005 46 6 22 0 52 6 17 0 108 17 74 13
2006 46 6 13 3 50 6 24 1 128 18 69 12
2007 44 5 19 0 50 5 17 2 111 16 67 8
2008 42 4 27 3 43 4 15 1 101 8 60 5
2009 44 5 12 1 46 5 16 2 97 10 60 7
2010 35 2 12 0 37 2 9 0 82 3 64 2
2011 38 5 9 3 38 5 21 1 73 8 58 7
2012 39 1 8 0 42 1 16 0 100 2 65 2
2013 50 3 18 1 53 5 33 4 105 9 72 5
2014 56 4 24 2 56 4 26 3 118 7 94 6
2015 71 4 14 1 76 5 27 1 162 14 108 6
2016 59 8 21 3 64 8 26 2 131 18 87 11
2017 46 4 13 2 47 4 18 2 83 4 63 4
2018 62 2 16 0 65 2 31 2 123 3 94 2
2019 74 9 17 4 80 9 36 4 161 15 111 11
2020 57 8 12 4 58 9 26 1 109 20 89 13
2021 76 6 0 0 77 7 35 3 138 12 122 10
Police full-time law enforcement employees
Year San JoseAurora
2021 1,624 0
2020 1,631 352
2019 1,607 362
2018 1,550 0
2017 1,346 0
2016 1,352 0
2015 1,325 0
2014 1,377 0
2013 1,424 0
2012 1,435 351
2011 1,456 347
2010 1,624 356
2009 1,749 371
2008 1,754 371
2007 1,784 367
2006 1,749 360
2005 1,715 365
2004 1,721 356
2003 1,792 356
Police full-time law enforcement employees (per 1,000 residents)
Year San JoseAurora
2021 1.6 0.0
2020 1.6 1.8
2019 1.5 1.8
2018 1.5 0.0
2017 1.3 0.0
2016 1.3 0.0
2015 1.3 0.0
2014 1.4 0.0
2013 1.4 0.0
2012 1.5 1.8
2011 1.5 1.7
2010 1.7 1.8
2009 1.8 2.1
2008 1.9 2.1
2007 1.9 2.1
2006 1.9 2.1
2005 1.9 2.2
2004 1.9 2.2
2003 2.0 2.3
Local government: full-time employees
Job San JoseAurora
Airports 194 2
Financial administration 236 56
Firefighters 655 191
Fire - other 115 5
Health 31 9
Judicial and legal 78 4
Local libraries 217 102
Natural resources 237 0
Other and unallocable 376 50
Other government administration 357 71
Parks and recreation 392 25
Police - other 465 107
Police protection - officers 1,072 262
Sewerage 0 39
Solid waste management 113 48
Streets and highways 407 82
Totals for government 5,204 1,228
Water supply 129 77
Local government: part-time employees
Job San JoseAurora
Airports 12 0
Financial administration 17 2
Fire - other 5 1
Health 36 0
Judicial and legal 3 0
Local libraries 337 37
Natural resources 4 0
Other and unallocable 45 15
Other government administration 38 38
Parks and recreation 732 5
Police - other 256 59
Streets and highways 44 0
Totals for government 1,538 182
Place of birth - Foreign born
Residents San JoseAurora
All residents 40.8% 25.5%
American Indian / Alaska Native residents 27.2% 29.5%
Asian residents 65.8% 64.4%
Black or African American residents 24.8% 8.1%
Native Hawaiian / Pacific Islander residents 22.2% 23.3%
Other race residents 39.4% 45.0%
Two or more races residents 23.8% 27.7%
White residents 15.8% 8.6%
White alone, not Hispanic / Latino residents 16.5% 5.8%
Place of birth - Native, outside of US
Residents San JoseAurora
All residents 1.6% 3.3%
American Indian / Alaska Native residents 0.0% 3.1%
Asian residents 1.8% 0.8%
Black or African American residents 1.2% 1.7%
Native Hawaiian / Pacific Islander residents 2.9% 1.5%
Other race residents 1.5% 2.1%
Two or more races residents 1.5% 6.0%
White residents 1.8% 0.8%
White alone, not Hispanic / Latino residents 1.5% 0.4%
Place of birth - Born in state of residence
Residents San JoseAurora
All residents 47.8% 55.5%
American Indian / Alaska Native residents 59.3% 60.4%
Asian residents 29.0% 28.1%
Black or African American residents 52.1% 68.8%
Native Hawaiian / Pacific Islander residents 69.3% 62.9%
Other race residents 55.7% 45.6%
Two or more races residents 66.8% 55.1%
White residents 58.2% 67.7%
White alone, not Hispanic / Latino residents 53.4% 70.1%
Place of birth - Born in other state
Residents San JoseAurora
All residents 9.9% 15.7%
American Indian / Alaska Native residents 13.6% 7.0%
Asian residents 3.4% 6.8%
Black or African American residents 21.9% 21.4%
Native Hawaiian / Pacific Islander residents 5.6% 12.2%
Other race residents 3.5% 7.3%
Two or more races residents 7.8% 11.2%
White residents 24.3% 22.9%
White alone, not Hispanic / Latino residents 28.7% 23.7%
English speakers (speaking English at home)
Type San Jose Aurora
Born in the United States residents 85.4% 80.4%
Foreign born residents 9.2% 8.4%
Native, born elsewhere residents 50.7% 41.3%
Total residents 42.1% 54.6%
Mechanisms of homicide
Mechanism San JoseAurora
Homicides from 2000 to 2006 305 129
Cut / Pierce 63 0
Firearm 154 86
Mechanisms of homicide per 1,000,000 residents
Mechanism San JoseAurora
Homicides from 2000 to 2006 25.9 41.0
Cut / Pierce 5.4 0
Firearm 13.1 27.3
Mechanisms of suicide per 1,000,000 residents
Mechanism San JoseAurora
Suicides from 2000 to 2006 73.8 73.0
Cut / Pierce 2.1 0
Fall 3.8 0
Firearm 24.1 27.0
Poisoning 14.1 15.6
Suffocation 24.1 25.1

Infrastructure

San Jose offers robust infrastructure, including a comprehensive public transit system and extensive biking and walking trails. Aurora also offers good infrastructure, with easy access to Chicago via public transportation and highways. Both cities have made substantial investments in maintaining and improving their infrastructure to meet the needs of their growing populations.
Infrastructure
Type San Jose Aurora
Hospitals 20 5
TV stations 9 27
Bank branches located here 145 45
Bank institutions located here 25 19
Main business address for public companies 74 3
Drinking water stations with no reported violations in the past 21 4
Drinking water stations with reported violations in the past 10 2

Schools

School facilities
Type San Jose Aurora
Private elementary/middle schools 31 11
Private high schools 16 4
Public elementary/middle schools 189 39
Public high schools 56 10
Colleges/Universities 12 2
HMDA - Conventional home purchase loans - Applications denied
Year San JoseAurora
1999 3,839 182
2000 2,577 240
2001 1,953 182
2002 1,908 191
2003 3,578 363
2004 5,489 683
2005 6,994 1,038
2006 6,324 1,182
2007 4,298 627
2008 2,419 211
2009 1,631 89

Culture and Food

San Jose boasts a vibrant mix of cultures, reflected in its culinary scene. The city hosts a variety of ethnic festivals and has a thriving arts scene. Aurora, while smaller, also offers a diverse culinary scene and hosts various cultural and music festivals throughout the year, adding to its charm.

Sports Teams

San Jose is home to major sports teams like the San Jose Sharks (NHL) and the Earthquakes (MLS). Aurora, being close to Chicago, gives access to popular teams such as the Chicago Bulls (NBA), the Chicago Cubs and White Sox (MLB), and the Chicago Bears (NFL).
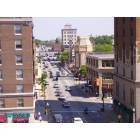