San Jose, CA vs Boise, ID - Advanced U.S. city comparison tool

San Jose, CA vs Boise, ID

San Jose, California, located in the heart of Silicon Valley, is a bustling tech hub known for its high cost of living, diverse culture, milder weather and robust infrastructure. Excellent education facilities and high-paying jobs cater to those seeking advancement in their careers. On the contrary, Boise, Idaho, offers a more affordable and slower-paced life, with an emphasis on outdoor activities, lower taxes, fewer crowds, as well as a blossoming tech industry. The following sections provide a detailed comparison between the two cities.
 
 
Distance between San Jose, CA and Boise, ID : 526.8 miles

San Jose's population is larger by 314%. Its population has grown by 88,546 people (9.9%) since 2000. The population of Boise has grown by 51,659 people (27.8%) during that time.

Population
Type San Jose Boise
Population 983,489 237,446
Female / male percentage 48.6% / 51.4%
48.6%
51.4%
50.1% / 49.9%
50.1%
49.9%
Racial makeup - percentage
Ethnicity San JoseBoise
Asian 38.8% 4.3%
Hispanic 30.6% 9.5%
White Non-Hispanic 22.6% 78.9%
Two or more 3.8% 4.2%
Black 2.9% 2.2%
Pacific Islander 0.5% 0.3%
American Indian 0.2% 0.2%
Racial makeup - absolute values
Ethnicity San JoseBoise
Asian 381,573 10,100
Hispanic 301,143 22,526
White Non-Hispanic 222,495 187,262
Two or more 37,533 9,878
Black 28,786 5,126
Pacific Islander 5,001 728
American Indian 1,631 419

Crime and Safety

In terms of safety, Boise is generally considered safer than San Jose. According to neighborhoodscout.com, Boise's crime rate is considerably lower than the national average while San Jose falls slightly higher than the average. However, the crime rates vary depending on the neighborhood in both cities so it's always advisable to research specific neighborhoods when considering safety.

Crime by year per 100,000 residents
Type City-data.com crime indexRobberies per 100,000Murders per 100,000Rapes per 100,000Assaults per 100,000Burglaries per 100,000Theft per 100,000Auto theft per 100,000Arson per 100,000
Year San JoseBoiseSan JoseBoiseSan JoseBoiseSan JoseBoiseSan JoseBoiseSan JoseBoiseSan JoseBoiseSan JoseBoiseSan JoseBoise
2020 268.4 184.8 115.1 23.8 3.9 1.7 55.0 73.5 251.0 193.8 392.9 207.2 1,237.2 1,312.6 686.2 120.7 24.5 15.1
2019 277.0 189.5 128.7 19.5 3.1 1.7 64.5 87.3 242.0 176.4 395.6 205.8 1,435.0 1,305.6 589.0 105.9 13.0 9.9
2018 280.9 209.2 152.1 22.7 2.7 0.4 58.7 89.9 210.8 178.4 433.4 276.1 1,290.0 1,633.9 735.6 115.6 11.6 17.9
2017 272.7 226.2 132.6 29.2 3.1 0.9 55.0 76.2 212.9 199.8 378.4 329.2 1,284.7 1,983.8 777.6 154.2 16.7 19.1
2016 257.2 214.7 116.5 23.1 4.5 2.7 43.3 64.8 208.8 207.0 408.9 331.6 1,227.2 1,841.9 739.4 152.2 13.2 20.4
2015 242.5 211.1 110.5 20.1 2.9 0.5 36.4 69.0 179.8 218.9 474.7 306.6 1,273.7 1,847.9 678.7 122.0 9.0 21.0
2014 241.4 193.6 106.2 25.9 3.2 1.9 30.3 55.5 181.4 205.3 511.7 320.4 1,173.6 1,677.6 748.8 88.8 12.2 21.3
2013 249.5 195.4 110.4 21.0 3.8 1.4 27.2 57.4 182.6 180.6 521.4 384.9 1,250.9 1,731.9 798.9 100.8 13.4 22.4
2012 279.0 197.9 123.7 29.8 4.6 0.5 28.7 37.3 206.3 202.8 533.2 433.9 1,484.8 2,031.5 897.0 74.2 18.0 26.9
2011 226.5 192.6 115.0 29.3 4.1 0.5 23.6 32.7 192.3 185.1 441.2 395.8 1,319.5 2,134.2 535.1 82.2 17.2 26.4
2010 226.9 213.2 103.2 28.2 2.1 1.5 26.7 45.2 207.8 189.6 416.5 433.7 1,345.7 2,279.4 572.0 77.8 19.1 24.3
2009 234.1 219.3 107.4 31.0 2.9 2.9 27.0 35.8 223.1 216.0 392.1 513.5 1,429.2 2,239.4 563.8 84.3 25.5 29.5
2008 236.3 220.6 118.9 31.4 3.3 0.5 23.3 40.7 240.0 201.2 365.7 546.2 1,440.1 2,264.3 553.2 106.5 30.5 23.6
2007 256.9 264.3 114.3 34.7 3.5 5.0 23.2 63.3 261.2 226.0 476.1 513.8 1,412.4 2,416.8 686.2 191.9 36.3 41.2
2006 259.1 291.1 111.9 56.0 3.2 3.0 23.6 68.1 248.2 267.4 480.5 593.3 1,377.2 2,582.1 775.5 193.2 47.5 26.2
2005 234.0 255.6 97.1 43.1 2.9 2.6 28.9 62.0 254.7 276.4 444.7 697.4 1,468.8 2,901.9 604.8 242.5 42.6 37.4
2004 222.2 254.0 86.4 41.3 2.6 0.0 28.2 68.1 254.6 279.6 397.9 641.7 1,558.8 2,887.1 497.1 276.5 27.3 36.1
2003 213.6 259.4 89.6 40.3 3.2 1.6 30.7 60.5 247.8 231.1 364.2 741.9 1,513.4 3,251.1 402.7 249.7 22.9 54.8

City-data.com crime index counts serious crimes and violent crime more heavily. It adjusts for the number of visitors and daily workers commuting into cities. (higher means more crime, U.S. average = 301.1)


Crime per year
Type City-data.com crime indexRobberiesMurdersRapesAssaultsBurglariesTheftAuto theftArson
Year San JoseBoiseSan JoseBoiseSan JoseBoiseSan JoseBoiseSan JoseBoiseSan JoseBoiseSan JoseBoiseSan JoseBoiseSan JoseBoise
2019 277.0 189.5 1,339 45 32 4 671 202 2,517 408 4,114 476 14,924 3,020 6,126 245 135 23
2018 280.9 209.2 1,593 52 28 1 615 206 2,208 409 4,539 633 13,510 3,746 7,704 265 121 41
2017 272.7 226.2 1,376 66 32 2 571 172 2,209 451 3,926 743 13,329 4,477 8,068 348 173 43
2016 257.2 214.7 1,214 51 47 6 451 143 2,175 457 4,260 732 12,786 4,066 7,703 336 137 45
2015 242.5 211.1 1,140 44 30 1 375 151 1,855 479 4,896 671 13,138 4,044 7,001 267 93 46
2014 241.4 193.6 1,072 56 32 4 306 120 1,832 444 5,167 693 11,850 3,628 7,560 192 123 46
2013 249.5 195.4 1,095 45 38 3 270 123 1,812 387 5,173 825 12,411 3,712 7,926 216 133 48
2012 279.0 197.9 1,208 63 45 1 280 79 2,014 429 5,206 918 14,498 4,298 8,759 157 176 57
2011 226.5 192.6 1,101 61 39 1 226 68 1,840 385 4,223 823 12,628 4,438 5,121 171 165 55
2010 226.9 213.2 976 58 20 3 253 93 1,966 390 3,940 892 12,730 4,688 5,411 160 181 50
2009 234.1 219.3 1,025 64 28 6 258 74 2,128 446 3,741 1,060 13,635 4,623 5,379 174 243 61
2008 236.3 220.6 1,124 64 31 1 220 83 2,268 410 3,457 1,113 13,612 4,614 5,229 217 288 48
2007 256.9 264.3 1,068 69 33 10 217 126 2,441 450 4,449 1,023 13,200 4,812 6,413 382 339 82
2006 259.1 291.1 1,030 111 29 6 217 135 2,285 530 4,423 1,176 12,678 5,118 7,139 383 437 52
2005 234.0 255.6 884 84 26 5 263 121 2,319 539 4,049 1,360 13,374 5,659 5,507 473 388 73
2004 222.2 254.0 785 80 24 0 256 132 2,314 542 3,616 1,244 14,165 5,597 4,517 536 248 70
2003 213.6 259.4 815 78 29 3 279 117 2,255 447 3,314 1,435 13,770 6,288 3,664 483 208 106

City-data.com crime index counts serious crimes and violent crime more heavily. It adjusts for the number of visitors and daily workers commuting into cities. (higher means more crime, U.S. average = 301.1)

Sex Offenders

According to our data, there are 1,806 registered sex offenders living in San Jose and 782 registered sex offenders living in .
The ratio of residents to sex offenders in San Jose is 568 to 1; the ratio in Boise is 285 to 1.
The number of registered sex offenders compared to the number of residents is a smaller in San Jose than in Boise.

Cost of Living

The cost of living in San Jose is significantly higher than in Boise. Factors such as housing, groceries, transportation, and health care are all more expensive in San Jose as it is known to be one of the most expensive cities in the U.S. Boise, on the other hand, is much more affordable, making it an attractive option for people looking for a lower cost of living.

Income Tax

California has progressive income tax rates which make it one of the highest-taxed states in the U.S. Meanwhile, Idaho's progressive income tax rates are much lower.

Property Tax

The property tax in San Jose, while higher than in Boise, is average for California. Idaho has lower property tax rates, which can be attractive for homebuyers.

Sales Tax

California has a higher sales tax rate than Idaho, with San Jose's combined city and state sales tax rate sitting at 9.25%. Boise has a combined rate of approximately 6%.
Income
Type San Jose Boise
Estimated median household income $126,377 $70,217
Estimated per capita income $57,357 $42,814
Cost of living index (U.S. average is 100) 127.4 95.8

If you make $50,000 in Boise, you will have to make $66,493 in San Jose to maintain the same standard of living.

Geographical Conditions

San Jose is surrounded by hills and enjoys proximity to the Pacific Coast and San Francisco Bay. Boise, often referred to as the City of Trees, is bordered by the Boise Mountains and the Snake River, providing ample opportunities for outdoor recreation.
Geographical information
Type San Jose Boise
Land area 174.9 sq. miles 63.8 sq. miles
Population density 5,624.3 people per sq. mile 3,723.1 people per sq. mile
Elevation 87 feet 2,730 feet
First ancestry reported - percentage
Ancestry San JoseBoise
Italian 1.4% 2.6%
English 1.4% 16.1%
German 1.4% 10.6%
Irish 1.1% 6.5%
Russian 0.7% 0.2%
Portuguese 0.7% 0.1%
Polish 0.4% 0.7%
Ukrainian 0.3% 0.3%
Greek 0.2% 0.3%
Norwegian 0.2% 1.9%
French 0.2% 0.8%
Dutch 0.2% 0.8%
Scottish 0.2% 1.8%
Swedish 0.2% 1.1%
Hungarian 0.1% 0.3%
Danish 0.1% 0.4%
French Canadian 0.1% 0.7%
Scotch-Irish 0.1% 0.6%
Arab 0.1% 0.2%
Swiss 0.0% 0.2%
Population origin - absolute values
Ancestry San JoseBoise
Italian 9,340 2,725
English 8,865 16,590
German 8,771 10,934
Irish 7,368 6,674
Portuguese 4,318 131
Russian 4,221 203
Polish 2,310 763
Ukrainian 1,617 323
Scottish 1,579 1,822
French 1,551 855
Swedish 1,265 1,083
Greek 1,143 318
Norwegian 1,109 1,971
Dutch 1,052 849
Scotch-Irish 774 583
Danish 529 423
Arab 465 211
Hungarian 446 329
French Canadian 430 676
Lithuanian 341 100
Foreign born residents - absolute values
Type Count
Region San JoseBoise
All 405,569 15,164
Africa 7,882 1,317
Asia 261,138 6,761
Europe 22,903 2,887
Latin America 104,982 3,604
North America 3,409 1,124
Oceania 1,982 151
Foreign born residents - percentage
Type Percentage
Region San JoseBoise
All 41.0% 6.2%
Africa 0.8% 0.5%
Asia 26.4% 2.8%
Europe 2.3% 1.2%
Latin America 10.6% 1.5%
North America 0.3% 0.5%
Oceania 0.2% 0.1%

Education

Both cities have excellent educational opportunities. San Jose is home to some of the best higher education institutes in the country like San Jose State University and Santa Clara University. Boise offers great public schooling options and colleges like Boise State University. Both cities support a highly educated workforce.
School enrollment
Type San Jose Boise
Nursery, preschool 12,614 (5%) 2,547 (4.2%)
Kindergarten 11,028 (4.4%) 3,034 (5.1%)
Grade 1 to 4 43,599 (17.4%) 10,705 (17.9%)
Grade 5 to 8 48,820 (19.5%) 13,594 (22.7%)
Grade 9 to 12 53,891 (21.5%) 11,037 (18.4%)
College undergrad 63,451 (25.4%) 14,462 (24.1%)
Graduate or professional 16,871 (6.7%) 4,570 (7.6%)
Students in private schools - absolute values
Type Count
Grade San JoseBoise
Grades 1 to 8 (elementary and middle school) 12,274 3,352
Grades 9 to 12 (high school) 6,754 1,364
Undergraduate colleges 5,716 2,497
Students in private schools - percentage
Type Percentage
Grade San JoseBoise
Grades 1 to 8 (elementary and middle school) 13.3% 13.8%
Grades 9 to 12 (high school) 12.5% 12.4%
Undergraduate colleges 9.0% 17.3%
Educational attainment
Type San Jose Boise
Less than high school 14.1% 5%
High school or equiv. 16.3% 19.5%
Less than 1 year of college 4.8% 5.9%
1 or more years of college 11.4% 14.1%
Associate degree 7.5% 7.5%
Bachelor's degree 26.4% 29.5%
Master's degree 14.7% 13.3%
Profess. school degree 2.1% 3.3%
Doctorate degree 2.6% 1.8%
Education level (25-year-olds and older)
Type San Jose Boise
Bachelor's degree or higher 45.8% 48%
Graduate or professional degree 19.4% 18.5%
High school or higher 85.9% 95%

Work and Economy

San Jose's economy is centered around the tech industry, hosting many world-renowned tech giants like Apple and Google. Boise has a more diversified economy with industries ranging from technology to healthcare and agriculture, with a growing tech sector.

Biggest Employers

The biggest employers in San Jose are tech companies like Apple, Google, and Cisco Systems. In Boise, St. Luke's Health System and Micron Technology are among the biggest employers.
Employment and residency - absolute values
Kind San JoseBoise
Work and live in this city 212,187 79,431
Work and live in this county 441,542 114,491
Workers who work outside the city they live in 682,756 106,356
Workers who work outside the county they live in 42,216 9,140
Working at home 143,618 26,271
Not working at home 340,140 97,360
Daytime population change due to commuting N/A 30,874
Employment and residency - percentage
Kind San JoseBoise
Work and live in this city 49.6% 80.2%
Work and live in this county 91.3% 92.6%
Workers who work outside the city they live in 50.4% 19.8%
Workers who work outside the county they live in 8.7% 7.4%
Working at home 29.7% 21.3%
Not working at home 70.3% 78.8%
Daytime population change due to commuting N/A 16.6%
Geographical mobility: all
Type all
Mobility San JoseBoise
Same house 1 year ago 87.6% 83.1%
Moved from abroad 0.7% 0.4%
Moved within same county 8.8% 9.3%
Moved from different state 0.9% 5.0%
Moved within same state 2.1% 2.2%
Geographical mobility: Asian
Type Asian
Mobility San JoseBoise
Same house 1 year ago 87.7% 86.6%
Moved from abroad 1.1% 2.3%
Moved within same county 8.2% 5.5%
Moved from different state 1.4% 5.3%
Moved within same state 1.6% 1.9%
Geographical mobility: Black
Type Black
Mobility San JoseBoise
Same house 1 year ago 81.4% 97.3%
Moved from abroad 0.2% 0.2%
Moved within same county 11.5% 2.4%
Moved from different state 0.6% 1.1%
Moved within same state 6.3% 3.6%
Geographical mobility: White
Type White
Mobility San JoseBoise
Same house 1 year ago 88.6% 82.8%
Moved from abroad 0.4% 0.3%
Moved within same county 8.0% 9.0%
Moved from different state 0.9% 5.6%
Moved within same state 2.1% 2.3%
Building permits
Type Average valueCount
City San JoseBoiseSan JoseBoise
1997 $152,100 $126,800 2,329 985
1998 $158,500 $132,700 1,963 1,103
1999 $160,700 $135,500 1,596 992
2000 $162,200 $148,400 1,336 988
2001 $158,800 $159,200 540 797
2002 $187,000 $168,000 620 718
2003 $164,800 $155,800 1,135 738
2004 $188,800 $175,300 946 674
2005 $166,100 $176,800 805 955
2006 $154,600 $242,700 602 588
2007 $151,700 $209,000 325 426
2008 $163,800 $245,800 214 183
2009 $240,400 $149,500 31 177
2010 $245,300 $177,700 74 352
2011 $241,300 $223,600 83 359
2012 $286,600 $218,400 186 580
2013 $259,300 $248,700 274 498
2014 $262,900 $248,300 384 467
2015 $305,300 $258,000 155 675
2016 $265,900 $275,200 222 682
2017 $227,700 $273,700 177 810
2018 $193,700 $282,200 238 844
2019 $162,900 $291,100 514 698
2020 $277,800 $281,200 312 756
2021 $275,200 $307,200 299 856

There were 299 building permits issued in San Jose in 2012 (216 more than in 2011) compared to 856 building permits issued in Boise in 2012 (497 more than in 2011).

In San Jose (Santa Clara County), 70.0% voted for Democrats and 27.1% for Republicans in 2012 Presidential Election. In Boise (Ada County), 42.3% voted for Democrats and 53.5% for Republicans.

Elections
Type DemocratsRepublicansOther
Year San JoseBoiseSan JoseBoiseSan JoseBoise
2020 72.7% 46.6% 25.2% 50.5% 2.1% 2.8%
2016 72.7% 38.8% 20.6% 48.1% 6.7% 13.0%
2012 70.0% 42.3% 27.1% 53.5% 2.9% 4.1%
2008 69.6% 45.5% 28.6% 51.6% 1.8% 2.9%
2004 64.3% 37.8% 34.8% 61.2% 0.9% 1.0%
2000 60.7% 33.1% 34.4% 61.0% 4.9% 5.9%
1996 56.9% 36.6% 32.2% 52.5% 11.0% 10.9%
Breakdown of population affiliated with a religious congregation
Type AdherentsCongregations
Religion San JoseBoiseSan JoseBoise
CATHOLIC CHURCH 25.1% 6.7% 6.0% 2.5%
MUSLIM ESTIMATE 1.1% 0.2% 1.8% 0.8%
SOUTHERN BAPTIST CONVENTION 0.9% 0.6% 7.7% 3.1%
EPISCOPAL CHURCH 0.5% 0.6% 2.3% 1.1%
SEVENTH DAY ADVENTIST CHURCH 0.4% 0.6% 2.6% 2.3%
EVANGELICAL LUTHERAN CHURCH IN AMERICA 0.3% 0.6% 2.3% 1.4%
LUTHERAN CHURCH 0.2% 0.5% 1.4% 1.1%
AMERICAN BAPTIST CHURCHES IN THE USA 0.1% 0.7% 1.1% 2.0%
VINEYARD USA 0.0% 0.9% 0.1% 0.6%

Weather

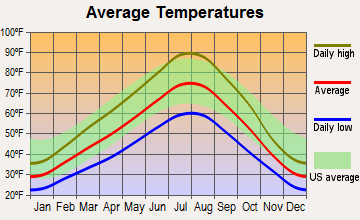
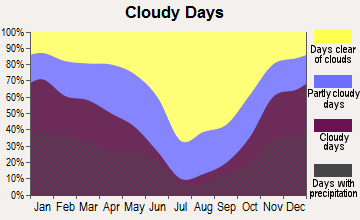
San Jose experiences a Mediterranean climate with warm sunny days and cool nights. Winters in San Jose are mild compared to many U.S states. Boise experiences a more extreme climate, with hot summers and cold winters. Snowfall is common in Boise, making it a great destination for winter sports enthusiasts.
Weather and climate
Type San Jose Boise
Temperature - Average 60.9°F 51.6°F
Humidity - Average morning or afternoon humidity 77.3% 57.8%
Humidity - Differences between morning and afternoon humidity 35.5% 59%
Humidity - Maximum monthly morning or afternoon humidity 87% 79%
Humidity - Minimum monthly morning or afternoon humidity 51.6% 20%
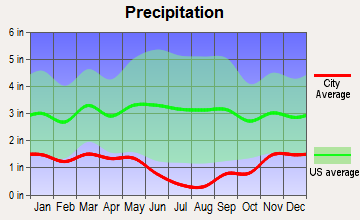
Precipitation - Yearly average 16.1 in 13.1 in
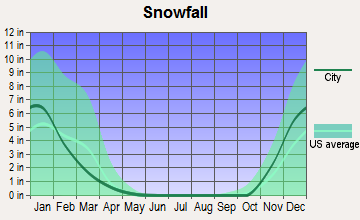
Snowfall - Yearly average 0 in 40 in
Clouds - Number of days clear of clouds 27.4% 20%
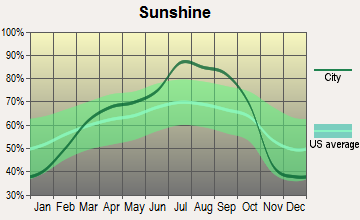
Sunshine amount - Average 73.8% 68.3%
Sunshine amount - Differences during a year 23% 53%
Sunshine amount - Maximum monthly 77.4% 85%
Sunshine amount - Minimum monthly 54.4% 32%
Wind speed - Average 10.3 mph 8.2 mph

Average climate in San Jose, California

Chicago, Illinois average temperatures Chicago, Illinois average precipitation Chicago, Illinois humidity Chicago, Illinois wind speed Chicago, Illinois snowfall Chicago, Illinois sunshine Chicago, Illinois clear and cloudy days
 

Average climate in Boise, Idaho

Chicago, Illinois average temperatures Chicago, Illinois average precipitation Chicago, Illinois humidity Chicago, Illinois wind speed Chicago, Illinois snowfall Chicago, Illinois sunshine Chicago, Illinois clear and cloudy days
 

Air pollution
Type AQICONO2OZONEPBPM10PM25SO2
Year San JoseBoiseSan JoseBoiseSan JoseBoiseSan JoseBoiseSan Jose Boise San JoseBoiseSan JoseBoise
2018 94 89 0.49 0.63 14.5 N/A 22.2 27.2 0.006 N/A 21.3 N/A 12.5 8.0 0.2 0.3
2017 91 107 0.50 0.43 14.6 N/A 23.5 28.0 0.004 N/A 23.2 N/A 10.2 10.3 0.2 0.3
2016 69 85 0.47 0.39 13.7 N/A 22.4 25.5 0.003 N/A 21.6 N/A 8.8 6.0 0.2 0.7
2015 84 93 0.52 0.50 15.4 N/A 22.3 24.7 0.004 N/A 24.7 N/A 9.2 6.9 0.3 0.6
2014 83 49 0.40 0.39 13.9 N/A 21.5 24.7 0.004 N/A 20.1 N/A 8.2 N/A 0.2 0.7
2013 90 58 0.41 0.35 15.2 N/A 20.8 24.3 0.005 N/A 25.6 N/A 12.4 N/A 0.3 2.6
2012 74 89 0.35 0.39 13.3 N/A 21.8 27.0 0.003 N/A 26.4 N/A 10.1 N/A 0.3 1.2
2011 83 67 0.37 0.35 14.8 N/A 20.6 31.1 0.003 N/A 20.5 N/A 12.3 N/A 0.3 0.9
2010 88 81 0.35 0.40 14.4 9.0 20.4 26.7 0.004 N/A 18.8 N/A 9.0 12.8 0.4 0.3
2009 89 75 0.40 0.62 14.7 9.8 18.2 27.2 0.004 N/A 21.5 N/A 9.3 6.1 0.3 0.3
2008 100 82 0.45 0.67 16.7 N/A 20.6 N/A N/A N/A 22.7 N/A 12.6 9.3 N/A N/A
2007 92 105 0.44 0.55 16.6 N/A 20.0 N/A 0.009 N/A 24.2 N/A 11.1 11.2 N/A N/A
2006 100 96 0.46 0.64 18.0 N/A 21.8 N/A N/A N/A 23.9 N/A 11.1 8.7 N/A N/A
2005 95 92 0.68 0.81 18.6 N/A 20.0 N/A N/A N/A 21.7 N/A 11.6 8.1 N/A N/A
2004 98 89 0.63 0.89 18.5 N/A 20.4 31.7 N/A N/A 23.3 N/A 9.9 7.2 N/A N/A
2003 87 72 0.73 1.02 20.6 N/A 19.1 28.4 N/A N/A 27.5 N/A N/A N/A N/A N/A
2002 78 78 0.65 1.04 19.5 N/A 18.0 32.2 0.006 N/A 30.7 N/A N/A N/A N/A N/A
2001 75 75 0.61 1.06 18.5 N/A 16.8 N/A 0.008 N/A 30.7 N/A N/A N/A N/A N/A
2000 65 59 0.66 1.05 18.9 18.3 15.6 N/A 0.009 N/A 28.6 N/A N/A N/A N/A N/A
Natural disasters
Type San Jose Boise
Tornado activity compared to U.S. average 9% 5.8%
Earthquake activity compared to U.S. average 7,785.3% 2,314.9%
Natural disasters compared to U.S. average 19% 5%

Transportation

San Jose has a well-developed public transportation system including buses, light rail, and Bart. Commuting can be a challenge due to high traffic. Boise's public transit is not as comprehensive, but traffic is typically much lighter making commuting easier by car.
Transport
Type San Jose Boise
Amtrak stations 1 1
Amtrak stations nearby 3 2
FAA registered aircraft 553 737
FAA registered aircraft manufacturers and dealers 13 19
Means of transportation to work
Type San Jose Boise
Bicycle 1% 2.5%
Bus 1.1% 0.2%
Carpooled 11.4% 5.4%
Car alone 80.5% 89.1%
Motorcycle 0.2% 0.1%
Railroad 0.2% 0%
Subway 0.2% 0%
Walked 3.3% 1.5%
Means of transportation to work
Average travel time to work
Type San Jose Boise
Average 29.2 min 23.5 min
Other means 27.9 min 18.9 min
Public transportation 48.5 min 36 min
Travel time to work
Time leaving to work
Travel time to work
Time leaving to work
Private vehicle occupancy
Type San Jose Boise
Average 1.2 1.1
Drove alone 87.3% 91.9%
In 2 person carpool 8.9% 6.7%
In 3 person carpool 1.9% 1%
In 4 person carpool 1.1% 0.2%
In 5-6 person carpool 0.6% 0.2%
In 7+ person carpool 0.2% 0.1%

How many people usually rode to work in the car, truck or van.

Real Estate

San Jose's real estate market is significantly higher priced than Boise's. The median home price in San Jose is well over a million dollars, compared to Boise's more reasonable average of about $400,000.

Neighborhoods

San Jose's neighborhoods cater to various lifestyles, from the vibrant Downtown for young professionals to the family-friendly Willow Glen. Boise's North End is popular for its historic homes and Hyde Park, while the Downtown area offers a more urban lifestyle.
Houses and residents
Type San Jose Boise
Houses 340,561 104,110
Average household size (people) 3.1 2.4
Median year apartment built 1979 1985
Median year house/condo built 1973 1983
Length of stay in the house since moving in 15.6 years 11.2 years
Houses occupied 322,881 (94.8%) 99,250 (95.3%)
Houses occupied by owners 179,797 (55.7%) 62,684 (63.2%)
Houses occupied by renters 143,084 (44.3%) 36,566 (36.8%)
Median rent asked for vacant for-rent units $3,214 $965.22
Median monthly housing costs $2,463 $1,184
Median price asked for vacant for-sale houses and condos $1,197,016 $290,076
Estimated median house or condo value Over $1,000,000 $460,200
Median numbers of rooms 4.9 5.4
Median number of rooms in apartments 3.6 4
Median number of rooms in houses and condos 6 6.4
Median house price - detached houses Over $1,000,000 $511,096
Median house price - in 2-unit structures $753,788 $444,814
Median house price - in 3-to-4-unit structures $680,453 Over $1,000,000
Median house price - in 5 or more unit structures $688,625 $369,189
Median house price - mobile homes $240,963 $79,284
Median house price - occupied boats, rvs, vans etc. $55,872 $34,120
Median house price - Townhouses or other attached units $892,629 $421,814
Median house price - All housing units Over $1,000,000 $486,650
Median house age 45 38
Renting percentage 41.5% 38.9%
Housing density (houses/condos per square mile) 1,947.6 1,632.4
House value disparities 21.2% 27.1%
Household income disparities 38.3% 43.3%
Median household income for houses/condes with a mortgage $197,583 $101,590
Median household income for apartments without a mortgage $103,711 $62,286
Housing units without a mortgage 2,632 (2.1%) 1,657 (3.8%)
Housing units with both a second mortgage and home equity loan 13,499 (10.6%) 4,888 (11.2%)
Housing units with a mortgage 124,224 (97.9%) 41,976 (96.2%)
Housing units with a home equity loan 346 (0.3%) 51 (0.1%)
Housing units with a second mortgage 16,249 (12.8%) 5,293 (12.1%)
House/condo owner moved in on average (years ago) 14 8
House/condo renter moved in on average (years ago) 3 1
Housing units lacking complete kitchen facilities 1.2% 2%
Housing units lacking complete plumbing facilities 0.6% 0.5%
Housing units in structures
Housing units in structures San JoseBoise
One, detached 50.9% 63.8%
One, attached 11.5% 7.2%
Two 1.1% 2.0%
3 or 4 5.0% 6.5%
5 to 9 5.1% 4.2%
10 to 19 4.5% 5.4%
20 to 49 4.5% 3.7%
50 or more 14.2% 3.7%
Mobile homes 3.1% 3.4%
Boats, RVs, vans, etc. 0.1% 0.0%
Median real estate property taxes paid for housing units
Type San Jose Boise
With mortgages $9,868 (0.9%) $2,560 (0.5%)
With no mortgages $5,520 (0.5%) $2,748 (0.7%)
Marital status
Type San Jose Boise
Divorced 7.3% 12.1%
Never married 37.3% 31.9%
Now married 49.6% 50.9%
Separated 1.7% 1.3%
Widowed 4.1% 3.7%
Class of workers - percentage
Class of Workers San JoseBoise
Employee of private company 73.7% 66.1%
Local government workers 8.2% 6.3%
Private not-for-profit wage and salary workers 6.2% 7.3%
Self-employed workers in own not incorporated business 5.7% 7.3%
Self-employed in own incorporated business 2.9% 4.2%
State government workers 2.0% 6.5%
Federal government workers 1.3% 2.1%
Unpaid family workers 0.1% 0.1%
Class of workers - absolute values
Class of Workers San JoseBoise
Employee of private company 370,849 83,016
Federal government workers 6,457 2,633
Local government workers 41,343 7,956
Private not-for-profit wage and salary workers 31,011 9,202
Self-employed in own incorporated business 14,513 5,239
Self-employed workers in own not incorporated business 28,517 9,168
State government workers 10,222 8,189
Unpaid family workers 472 172

Industries and Occupations

In San Jose, the tech industry dominates with many opportunities in software development, IT, and engineering. In Boise, the most prominent industries are healthcare, education, and tech, with growing opportunities in software development and IT roles.
Most common male industries
Industry San JoseBoise
Manufacturing 20.8% 13.1%
Professional, scientific, and technical services 14.6% 10.7%
Construction 11.1% 12.3%
Retail trade 9.2% 11.1%
Information 6.5% 2.4%
Health care and social assistance 5.5% 6.3%
Administrative and support and waste management services 5.4% 4.0%
Accommodation and food services 5.3% 6.6%
Transportation and warehousing 4.4% 3.8%
Educational services 4.2% 5.8%
Finance and insurance 2.9% 5.2%
Other services, except public administration 2.5% 3.7%
Public administration 2.2% 5.8%
Real estate and rental and leasing 1.6% 1.7%
Wholesale trade 1.5% 3.9%
Arts, entertainment, and recreation 1.4% 1.1%
Utilities 0.5% 1.6%
Agriculture, forestry, fishing and hunting 0.4% 0.6%
Management of companies and enterprises 0.0% 0.1%
Mining, quarrying, and oil and gas extraction 0.0% 0.2%
Most common female industries
Industry San JoseBoise
Health care and social assistance 20.3% 21.0%
Professional, scientific, and technical services 13.6% 10.3%
Manufacturing 12.8% 7.3%
Educational services 11.0% 11.6%
Retail trade 8.3% 11.2%
Accommodation and food services 5.9% 6.0%
Other services, except public administration 4.9% 4.9%
Administrative and support and waste management services 4.6% 3.3%
Finance and insurance 4.0% 4.8%
Public administration 3.7% 5.1%
Information 3.2% 2.4%
Real estate and rental and leasing 1.8% 3.0%
Transportation and warehousing 1.7% 2.0%
Construction 1.2% 2.1%
Arts, entertainment, and recreation 1.1% 1.9%
Wholesale trade 1.1% 1.5%
Agriculture, forestry, fishing and hunting 0.4% 0.1%
Utilities 0.3% 1.1%
Management of companies and enterprises 0.1% 0.4%
Mining, quarrying, and oil and gas extraction 0.1% 0.0%
Most common male occupations
Occupation San JoseBoise
Computer and mathematical occupations 13.1% 5.6%
Management occupations 13.0% 14.3%
Architecture and engineering occupations 11.1% 6.1%
Construction and extraction occupations 8.6% 7.4%
Sales and related occupations 7.5% 10.4%
Office and administrative support occupations 6.2% 7.1%
Production occupations 4.8% 5.9%
Business and financial operations occupations 4.6% 5.2%
Food preparation and serving related occupations 3.9% 4.9%
Transportation occupations 3.6% 2.8%
Building and grounds cleaning and maintenance occupations 3.4% 3.3%
Installation, maintenance, and repair occupations 3.3% 3.6%
Material moving occupations 2.4% 4.6%
Educational instruction, and library occupations 2.4% 5.1%
Arts, design, entertainment, sports, and media occupations 2.2% 1.3%
Firefighting and prevention, and other protective service workers including supervisors 2.0% 1.3%
Healthcare support occupations 1.7% 0.7%
Health diagnosing and treating practitioners and other technical occupations 1.4% 3.2%
Life, physical, and social science occupations 1.2% 1.8%
Legal occupations 0.7% 2.0%
Most common female occupations
Occupation San JoseBoise
Office and administrative support occupations 14.4% 13.7%
Management occupations 11.2% 11.3%
Business and financial operations occupations 9.2% 8.5%
Educational instruction, and library occupations 8.6% 9.4%
Sales and related occupations 7.2% 6.7%
Healthcare support occupations 5.8% 3.6%
Health diagnosing and treating practitioners and other technical occupations 5.5% 10.8%
Computer and mathematical occupations 5.0% 3.6%
Food preparation and serving related occupations 5.0% 6.2%
Production occupations 4.1% 4.1%
Personal care and service occupations 3.7% 4.3%
Building and grounds cleaning and maintenance occupations 3.5% 1.7%
Architecture and engineering occupations 3.3% 1.1%
Community and social service occupations 2.3% 2.7%
Arts, design, entertainment, sports, and media occupations 2.1% 2.8%
Material moving occupations 2.1% 1.7%
Health technologists and technicians 1.7% 2.1%
Life, physical, and social science occupations 1.7% 0.9%
Legal occupations 1.3% 1.7%
Transportation occupations 0.7% 1.4%
Food environment data per 10,000 residents
Food environment statistics San JoseBoise
Number of convenience stores (no gas) 1.4 2.7
Number of convenience stores (with gas) 0.7 0.2
Number of full-service restaurants 8.6 7.8
Number of grocery stores 2.0 1.2
Number of supercenters and club stores 0.0 0.3
Food environment - absolute values
Food environment statistics San JoseBoise
Number of convenience stores (no gas) 239 99
Number of convenience stores (with gas) 117 7
Number of full-service restaurants 1,488 291
Number of grocery stores 345 46
Number of supercenters and club stores 7 10
Obesity and diabetes
Food environment statistics rate San JoseBoise
Adult diabetes rate 7.1% 6.7%
Adult obesity rate 19.0% 22.1%
Low-income preschool obesity rate 16.6% 10.1%

Health Care

San Jose has exceptional healthcare facilities like the Stanford Health Care. Boise also provides excellent healthcare with St. Luke’s Boise Medical Center and Saint Alphonsus Regional Medical Center being top facilities.
Health (county statistics)
Type San Jose Boise
General health status score of residents in this county from 1 (poor) to 5 (excellent) 3.6 3.5
Average weight of females (lbs) 151 lbs 163.5 lbs
Average weight of males (lbs) 182.6 lbs 199.8 lbs
Residents visited a dentist within the past year 73.5% 67.9%
Residents exercised in the past month 76.1% 76.1%
Adult residents drank alcohol in the past 30 days 61.3% 49%
Residents smoked 100+ cigarettes in their lives 30.2% 39.7%

Fatal vehicle accidents per 100,000 residents
Type Total count per 100,000Drunk per 100,000Fatal count per 100,000Pedestrian count per 100,000Person count per 100,000Vehicle count per 100,000
Year San JoseBoiseSan JoseBoiseSan JoseBoiseSan JoseBoiseSan JoseBoiseSan JoseBoise
2021 7.7 2.9 0.0 0.0 7.8 2.9 3.6 0.8 14.0 8.8 12.4 7.6
2020 5.6 3.8 1.2 2.1 5.7 4.7 2.6 0.4 10.8 8.5 8.8 5.9
2019 7.2 3.1 1.7 0.9 7.8 3.5 3.5 2.2 15.7 5.2 10.8 3.9
2018 6.0 3.9 1.5 0.9 6.3 5.2 3.0 1.3 11.9 11.4 9.1 8.7
2017 4.4 9.2 1.3 1.8 4.5 9.7 1.7 2.2 8.0 19.3 6.1 14.5
2016 5.7 4.4 2.0 1.3 6.2 4.9 2.5 1.8 12.7 6.2 8.4 5.3
2015 6.9 5.0 1.4 3.2 7.4 5.4 2.6 0.5 15.8 9.5 10.5 7.7
2014 5.5 3.7 2.4 0.9 5.5 3.7 2.6 1.4 11.6 10.2 9.3 5.5
2013 5.0 5.1 1.8 1.9 5.3 5.1 3.3 2.3 10.5 7.9 7.2 6.5
2012 4.0 1.9 0.8 0.5 4.3 2.4 1.6 0.0 10.2 6.6 6.6 3.3
2011 3.9 2.4 0.9 1.0 3.9 2.4 2.2 0.0 7.5 5.2 6.0 3.8
2010 3.7 3.4 1.3 0.5 3.9 3.4 1.0 0.5 8.7 6.3 6.8 4.9
2009 4.6 3.9 1.2 0.5 4.8 4.9 1.7 2.9 10.1 9.2 6.2 4.9
2008 4.4 2.9 2.8 1.0 4.5 3.4 1.6 0.0 10.6 8.3 6.3 7.3
2007 4.7 4.4 2.0 1.5 5.4 4.4 1.8 2.0 11.9 12.8 7.2 6.9
2006 5.0 7.0 1.4 2.5 5.4 8.5 2.6 1.0 13.9 15.5 7.5 10.5
2005 5.1 3.5 2.4 1.0 5.7 3.5 1.9 1.0 11.9 8.5 8.1 5.5
2004 4.5 4.5 1.3 2.0 4.9 4.5 2.9 0.5 11.8 12.6 7.3 7.5
2003 4.1 3.0 1.3 0.5 4.3 3.0 1.3 2.0 11.7 7.0 5.6 4.0
2002 6.1 5.5 2.3 2.5 6.5 5.5 2.9 1.5 16.0 15.0 8.2 9.5
2001 5.9 3.5 1.5 1.5 6.2 4.0 2.0 0.0 13.0 8.6 7.8 5.6
2000 5.7 3.2 2.9 1.6 5.8 3.2 2.6 0.5 15.6 8.1 8.5 7.0
1999 5.3 1.8 1.3 0.6 5.8 2.4 2.1 0.6 14.3 3.6 8.3 1.8
1998 5.2 0.6 1.2 0.6 5.3 0.6 2.8 0.0 16.1 0.6 8.1 0.6
1997 6.0 4.3 2.1 1.2 6.3 4.9 2.5 1.8 16.1 11.6 8.3 6.7
1996 5.4 4.9 2.2 2.5 5.5 4.9 2.6 1.9 14.5 14.2 7.8 7.4
1995 4.6 1.9 1.2 0.6 5.1 1.9 2.8 0.6 12.3 4.4 6.3 2.5
1994 4.2 4.5 1.2 3.2 4.3 5.8 1.7 1.3 12.2 17.4 7.0 6.4
1993 5.1 1.3 1.5 1.3 5.1 2.0 2.2 0.0 11.8 2.6 7.0 2.0
1992 6.5 4.1 2.8 1.4 6.7 4.1 3.0 0.7 15.0 8.2 8.2 4.8
1991 7.2 4.2 3.7 1.4 8.3 4.2 2.5 2.1 19.3 8.5 10.3 4.2
1990 8.3 4.4 3.6 2.9 9.3 5.1 0.0 0.0 22.9 9.5 10.9 7.3
1989 8.7 3.7 4.3 2.9 9.0 3.7 0.0 0.0 20.3 8.8 12.5 5.1
1988 10.2 2.9 4.1 0.0 11.0 2.9 0.0 0.0 25.7 6.6 14.5 4.4
1987 8.1 5.1 4.5 2.2 9.2 5.1 0.0 0.0 20.9 12.5 10.6 8.1
1986 8.7 8.8 3.2 5.9 9.2 8.8 0.0 0.0 19.8 21.3 12.8 13.9
1985 11.9 2.2 5.7 2.2 13.7 2.2 0.0 0.0 33.3 4.4 17.0 3.7
1984 9.4 5.9 3.8 2.9 11.0 5.9 0.0 0.0 25.9 11.7 15.4 6.6
1983 8.9 5.9 3.1 4.4 9.3 5.9 0.0 0.0 24.1 15.4 13.8 9.5
1982 11.1 2.2 6.2 2.2 12.0 2.2 0.0 0.0 27.6 3.7 15.3 2.9
1981 14.3 3.7 8.4 1.5 14.7 3.7 0.0 0.0 35.7 6.6 20.8 4.4
1980 15.3 2.9 8.1 1.5 16.2 4.4 0.0 0.0 35.9 11.0 22.1 5.1
1979 17.8 5.9 8.3 5.1 18.8 7.3 0.0 0.0 41.5 16.9 24.2 8.8
1978 12.6 5.9 7.2 1.5 14.1 5.9 0.0 0.0 32.2 16.1 20.5 9.5
1977 12.8 5.1 6.1 4.4 14.2 5.1 0.0 0.0 30.8 15.4 18.8 6.6
1976 13.0 5.1 5.9 0.0 13.9 5.1 0.0 0.0 30.1 10.3 17.6 6.6
1975 13.4 5.1 6.1 0.0 14.3 5.1 0.0 0.0 31.0 10.3 18.2 6.6

Fatal vehicle accidents
Type Total countDrunkFatal countPedestrian countPerson countVehicle count
Year San JoseBoiseSan JoseBoiseSan JoseBoiseSan JoseBoiseSan JoseBoiseSan JoseBoise
1975 73 7 33 0 78 7 0 0 169 14 99 9
1976 73 7 33 0 78 7 0 0 169 14 99 9
1977 74 7 35 6 82 7 0 0 178 21 109 9
1978 75 8 43 2 84 8 0 0 192 22 122 13
1979 109 8 51 7 115 10 0 0 254 23 148 12
1980 96 4 51 2 102 6 0 0 226 15 139 7
1981 92 5 54 2 95 5 0 0 230 9 134 6
1982 73 3 41 3 79 3 0 0 182 5 101 4
1983 60 8 21 6 63 8 0 0 163 21 93 13
1984 65 8 26 4 76 8 0 0 179 16 106 9
1985 84 3 40 3 97 3 0 0 235 6 120 5
1986 63 12 23 8 66 12 0 0 143 29 92 19
1987 60 7 33 3 68 7 0 0 154 17 78 11
1988 77 4 31 0 83 4 0 0 193 9 109 6
1989 67 5 33 4 69 5 0 0 156 12 96 7
1990 65 6 28 4 73 7 0 0 179 13 85 10
1991 57 6 29 2 65 6 20 3 152 12 81 6
1992 52 6 22 2 53 6 24 1 119 12 65 7
1993 41 2 12 2 41 3 18 0 95 4 56 3
1994 34 7 10 5 35 9 14 2 99 27 57 10
1995 38 3 10 1 42 3 23 1 101 7 52 4
1996 45 8 18 4 46 8 22 3 121 23 65 12
1997 51 7 18 2 54 8 21 3 137 19 71 11
1998 45 1 10 1 46 1 24 0 139 1 70 1
1999 46 3 11 1 50 4 18 1 124 6 72 3
2000 51 6 26 3 52 6 23 1 140 15 76 13
2001 54 7 14 3 56 8 18 0 118 17 71 11
2002 55 11 21 5 59 11 26 3 144 30 74 19
2003 37 6 12 1 39 6 12 4 105 14 50 8
2004 41 9 12 4 44 9 26 1 106 25 66 15
2005 46 7 22 2 52 7 17 2 108 17 74 11
2006 46 14 13 5 50 17 24 2 128 31 69 21
2007 44 9 19 3 50 9 17 4 111 26 67 14
2008 42 6 27 2 43 7 15 0 101 17 60 15
2009 44 8 12 1 46 10 16 6 97 19 60 10
2010 35 7 12 1 37 7 9 1 82 13 64 10
2011 38 5 9 2 38 5 21 0 73 11 58 8
2012 39 4 8 1 42 5 16 0 100 14 65 7
2013 50 11 18 4 53 11 33 5 105 17 72 14
2014 56 8 24 2 56 8 26 3 118 22 94 12
2015 71 11 14 7 76 12 27 1 162 21 108 17
2016 59 10 21 3 64 11 26 4 131 14 87 12
2017 46 21 13 4 47 22 18 5 83 44 63 33
2018 62 9 16 2 65 12 31 3 123 26 94 20
2019 74 7 17 2 80 8 36 5 161 12 111 9
2020 57 9 12 5 58 11 26 1 109 20 89 14
2021 76 7 0 0 77 7 35 2 138 21 122 18
Police full-time law enforcement employees
Year San JoseBoise
2021 1,624 357
2020 1,631 373
2019 1,607 385
2018 1,550 376
2017 1,346 375
2016 1,352 363
2015 1,325 361
2014 1,377 356
2013 1,424 366
2012 1,435 363
2011 1,456 353
2010 1,624 364
2009 1,749 358
2008 1,754 375
2007 1,784 378
2006 1,749 344
2005 1,715 337
2004 1,721 351
2003 1,792 342
Police full-time law enforcement employees (per 1,000 residents)
Year San JoseBoise
2021 1.6 1.5
2020 1.6 1.6
2019 1.5 1.7
2018 1.5 1.6
2017 1.3 1.7
2016 1.3 1.6
2015 1.3 1.7
2014 1.4 1.6
2013 1.4 1.7
2012 1.5 1.7
2011 1.5 1.7
2010 1.7 1.8
2009 1.8 1.7
2008 1.9 1.8
2007 1.9 1.9
2006 1.9 1.7
2005 1.9 1.7
2004 1.9 1.8
2003 2.0 1.8
Local government: full-time employees
Job San JoseBoise
Airports 194 107
Financial administration 236 147
Firefighters 655 260
Fire - other 115 28
Health 31 22
Judicial and legal 78 44
Local libraries 217 73
Natural resources 237 13
Other and unallocable 376 77
Other government administration 357 135
Parks and recreation 392 213
Police - other 465 87
Police protection - officers 1,072 293
Sewerage 0 138
Solid waste management 113 6
Streets and highways 407 0
Totals for government 5,204 1,660
Water supply 129 0
Local government: part-time employees
Job San JoseBoise
Airports 12 12
Financial administration 17 8
Fire - other 5 1
Health 36 5
Judicial and legal 3 2
Local libraries 337 80
Natural resources 4 1
Other and unallocable 45 8
Other government administration 38 11
Parks and recreation 732 245
Police - other 256 14
Solid waste management 0 3
Streets and highways 44 0
Totals for government 1,538 398
Place of birth - Foreign born
Residents San JoseBoise
All residents 40.8% 8.6%
American Indian / Alaska Native residents 27.2% 18.6%
Asian residents 65.8% 64.8%
Black or African American residents 24.8% 41.0%
Native Hawaiian / Pacific Islander residents 22.2% 4.3%
Other race residents 39.4% 29.1%
Two or more races residents 23.8% 9.2%
White residents 15.8% 3.0%
White alone, not Hispanic / Latino residents 16.5% 2.6%
Place of birth - Native, outside of US
Residents San JoseBoise
All residents 1.6% 1.0%
Asian residents 1.8% 0.0%
Black or African American residents 1.2% 0.0%
Native Hawaiian / Pacific Islander residents 2.9% 38.4%
Other race residents 1.5% 4.4%
Two or more races residents 1.5% 4.2%
White residents 1.8% 0.8%
White alone, not Hispanic / Latino residents 1.5% 0.9%
Place of birth - Born in state of residence
Residents San JoseBoise
All residents 47.8% 40.7%
American Indian / Alaska Native residents 59.3% 31.2%
Asian residents 29.0% 16.4%
Black or African American residents 52.1% 27.2%
Native Hawaiian / Pacific Islander residents 69.3% 21.3%
Other race residents 55.7% 25.8%
Two or more races residents 66.8% 41.8%
White residents 58.2% 42.6%
White alone, not Hispanic / Latino residents 53.4% 43.9%
Place of birth - Born in other state
Residents San JoseBoise
All residents 9.9% 49.8%
American Indian / Alaska Native residents 13.6% 50.2%
Asian residents 3.4% 18.8%
Black or African American residents 21.9% 31.8%
Native Hawaiian / Pacific Islander residents 5.6% 36.0%
Other race residents 3.5% 40.6%
Two or more races residents 7.8% 44.8%
White residents 24.3% 53.6%
White alone, not Hispanic / Latino residents 28.7% 52.6%
English speakers (speaking English at home)
Type San Jose Boise
Born in the United States residents 85.4% 95%
Foreign born residents 9.2% 22.6%
Native, born elsewhere residents 50.7% 79.7%
Total residents 42.1% 89.9%
Mechanisms of homicide
Mechanism San JoseBoise
Homicides from 2000 to 2006 305 41
Cut / Pierce 63 0
Firearm 154 24
Mechanisms of homicide per 1,000,000 residents
Mechanism San JoseBoise
Homicides from 2000 to 2006 25.9 17.8
Cut / Pierce 5.4 0
Firearm 13.1 10.4
Mechanisms of suicide per 1,000,000 residents
Mechanism San JoseBoise
Suicides from 2000 to 2006 73.8 134.6
Cut / Pierce 2.1 0
Fall 3.8 0
Firearm 24.1 79.1
Poisoning 14.1 22.2
Suffocation 24.1 24.8

Infrastructure

San Jose offers robust infrastructure with several high-speed internet options, advanced public transportation systems, and well-maintained roads. Boise's infrastructure, while not as developed as San Jose, is steadily improving as the city grows.
Infrastructure
Type San Jose Boise
Hospitals 20 15
TV stations 9 18
Arenas or stadiums 2 1
Bank branches located here 145 96
Bank institutions located here 25 21
Main business address for public companies 74 6
Drinking water stations with no reported violations in the past 21 7
Drinking water stations with reported violations in the past 10 33

Schools

School facilities
Type San Jose Boise
Private elementary/middle schools 31 9
Private high schools 16 5
Public elementary/middle schools 189 48
Public high schools 56 24
Colleges/Universities 12 12
HMDA - Conventional home purchase loans - Applications denied
Year San JoseBoise
1999 3,839 984
2000 2,577 639
2001 1,953 423
2002 1,908 374
2003 3,578 525
2004 5,489 624
2005 6,994 1,209
2006 6,324 1,081
2007 4,298 628
2008 2,419 283
2009 1,631 146

Culture and Food

San Jose has a diverse culture with a rich history, evidenced by its wide array of global cuisines, various festivals, and cultural events. Boise has a smaller but growing food scene, focusing on farm-to-table dining, and a strong sense of community.

Sports Teams

The San Jose area is home to several professional sports teams including the San Jose Sharks (NHL) and San Jose Earthquakes (MLS) and is in close proximity to teams like the 49ers (NFL) and Golden State Warriors (NBA). Boise does not have any major league sports teams, but it is home to the Boise Hawks minor league baseball team and Idaho Steelheads minor league hockey team.