San Jose, California, located in the heart of Silicon Valley, is a technological hub with a high cost of living and diverse culture. Cincinnati, Ohio, on the other hand, prides itself on its affordability, sports culture, and Midwestern values. From crime rates to weather, the cost of living, and the available professional opportunities, there are many factors to take into account when deciding between living in San Jose or Cincinnati.
Distance between
San Jose, CA and
Cincinnati, OH : 2,018.0 miles
San Jose's population is larger by 218%. Its population has grown by 88,546 people (9.9%) since 2000. The population of Cincinnati has decreased by 22,350 people (6.7%) during that time.
While both cities experience crime, the crime rates in Cincinnati are slightly higher than in San Jose. However, this can largely vary depending on the neighborhood. San Jose has a safer reputation among tourists, particularly in its downtown core. Both cities place a strong emphasis on community safety initiatives and have numerous neighborhood watch programs in place.
City-data.com crime index counts serious crimes and violent crime more heavily. It adjusts for the number of visitors and daily workers commuting into cities. (higher means more crime, U.S. average = 301.1)
City-data.com crime index counts serious crimes and violent crime more heavily. It adjusts for the number of visitors and daily workers commuting into cities. (higher means more crime, U.S. average = 301.1)
Sex Offenders
According to our data, there are 1,806 registered sex offenders living in San Jose and 1,094 registered sex offenders living in . The ratio of residents to sex offenders in San Jose is 568 to 1; the ratio in Cincinnati is 273 to 1. The number of registered sex offenders compared to the number of residents is a smaller in San Jose than in Cincinnati.
Cost of Living
As a part of the expensive Silicon Valley, San Jose has a significantly higher cost of living compared to Cincinnati. Everything from groceries to housing is pricier in San Jose. Cincinnati provides more affordable options for housing and cost of living in general.
Income Tax
California has a progressive income tax while Ohio has a relatively lower rate. The tax burden overall would be higher in San Jose.
Property Tax
Property taxes are higher in San Jose reflecting the value of the real estate.
Sales Tax
California has a higher state sales tax than Ohio, and when combined with city sales taxes, the overall rate is higher in San Jose.
Income
Type
San Jose
Cincinnati
Estimated median household income
$126,377
$42,733
Estimated per capita income
$57,357
$34,519
Cost of living index (U.S. average is 100)
127.4
89
If you make $50,000 in Cincinnati, you will have to make $71,573 in San Jose to maintain the same standard of living.
Geographical Conditions
San Jose sits in the Santa Clara Valley surrounded by mountain ranges, offering plenty of outdoor activities. Cincinnati is situated in a hilly region on the Ohio River with several scenic parks.
Both cities have a strong education system. San Jose is in proximity to prestigious universities like Stanford and the University of California Berkley. Cincinnati also boasts of reputable institutions such as the University of Cincinnati and Xavier University.
San Jose is known for its strong job market in the technology industry. Cincinnati, while having a more diversified economy, also has opportunities in health services, education, and finance. The average income is notably higher in San Jose, reflecting the concentration of high-paying tech jobs.
Biggest Employers
In San Jose, Cisco Systems, eBay, and Adobe Systems are some of the largest employers while Cincinnati houses headquarters of Proctor & Gamble, and Kroger among others.
There were 299 building permits issued in San Jose in 2012 (216 more than in 2011) compared to 206 building permits issued in Cincinnati in 2012 (122 more than in 2011).
In San Jose (Santa Clara County), 70.0% voted for Democrats and 27.1% for Republicans in 2012 Presidential Election. In Cincinnati (Hamilton County), 52.7% voted for Democrats and 46.4% for Republicans.
Elections
Type
Democrats
Republicans
Other
Year
San Jose
Cincinnati
San Jose
Cincinnati
San Jose
Cincinnati
2020
72.7%
57.2%
25.2%
41.3%
2.1%
1.5%
2016
72.7%
52.8%
20.6%
42.5%
6.7%
4.8%
2012
70.0%
52.7%
27.1%
46.4%
2.9%
0.9%
2008
69.6%
53.1%
28.6%
46.1%
1.8%
0.7%
2004
64.3%
47.3%
34.8%
52.7%
0.9%
0.0%
2000
60.7%
42.8%
34.4%
54.1%
4.9%
3.1%
1996
56.9%
43.1%
32.2%
50.1%
11.0%
6.8%
Breakdown of population affiliated with a religious congregation
Type
Adherents
Congregations
Religion
San Jose
Cincinnati
San Jose
Cincinnati
CATHOLIC CHURCH
25.1%
25.6%
6.0%
12.5%
MUSLIM ESTIMATE
1.1%
0.2%
1.8%
0.6%
SOUTHERN BAPTIST CONVENTION
0.9%
1.2%
7.7%
6.5%
EPISCOPAL CHURCH
0.5%
1.1%
2.3%
3.0%
SEVENTH DAY ADVENTIST CHURCH
0.4%
0.2%
2.6%
0.9%
EVANGELICAL LUTHERAN CHURCH IN AMERICA
0.3%
0.6%
2.3%
1.8%
LUTHERAN CHURCH
0.2%
0.3%
1.4%
1.5%
AMERICAN BAPTIST CHURCHES IN THE USA
0.1%
1.3%
1.1%
2.6%
VINEYARD USA
0.0%
1.8%
0.1%
1.1%
Weather
San Jose enjoys a Mediterranean climate with mild winters and warm, dry summers. Cincinnati experiences a humid subtropical climate with hot, humid summers and cold winters. For those who enjoy four distinct seasons, Cincinnati would be preferable while those preferring milder and more consistent weather would enjoy San Jose.
Weather and climate
Type
San Jose
Cincinnati
Temperature - Average
60.9°F
52.9°F
Humidity - Average morning or afternoon humidity
77.3%
75.8%
Humidity - Differences between morning and afternoon humidity
35.5%
34%
Humidity - Maximum monthly morning or afternoon humidity
87%
87%
Humidity - Minimum monthly morning or afternoon humidity
51.6%
53%
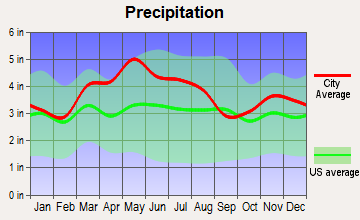
Precipitation - Yearly average
16.1 in
45 in
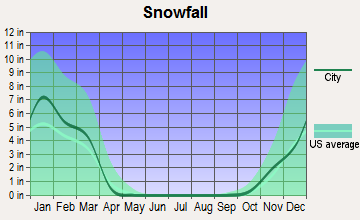
Snowfall - Yearly average
0 in
47.6 in
Clouds - Number of days clear of clouds
27.4%
13.5%
Sunshine amount - Average
73.8%
57.8%
Sunshine amount - Differences during a year
23%
33.1%
Sunshine amount - Maximum monthly
77.4%
67%
Sunshine amount - Minimum monthly
54.4%
33.9%
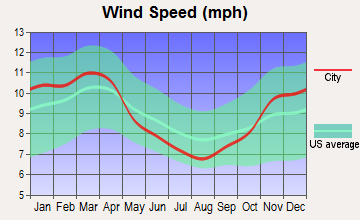
Wind speed - Average
10.3 mph
9 mph
Average climate in San Jose, California
Average climate in Cincinnati, Ohio
Air pollution
Type
AQI
CO
NO2
OZONE
PB
PM10
PM25
SO2
Year
San Jose
Cincinnati
San Jose
Cincinnati
San Jose
Cincinnati
San Jose
Cincinnati
San Jose
Cincinnati
San Jose
Cincinnati
San Jose
Cincinnati
2018
94
87
0.49
0.20
14.5
9.6
22.2
27.8
0.006
N/A
18.3
N/A
12.5
10.5
0.2
0.8
2017
91
81
0.50
0.23
14.6
8.5
23.5
29.2
0.004
N/A
18.8
N/A
10.2
9.2
0.2
1.1
2016
69
88
0.47
0.24
13.7
9.4
22.4
28.4
0.003
N/A
21.2
N/A
8.8
8.4
0.2
1.1
2015
84
91
0.52
0.26
15.4
11.0
22.3
26.4
0.004
N/A
21.5
N/A
9.2
9.5
0.3
1.5
2014
83
89
0.40
0.24
13.9
11.4
21.5
27.3
0.004
N/A
19.5
N/A
8.2
12.0
0.2
2.0
2013
90
92
0.41
0.24
15.2
11.5
20.8
27.0
0.005
N/A
22.9
N/A
12.4
11.9
0.3
2.6
2012
74
97
0.35
0.26
13.3
4.8
21.8
27.6
0.003
N/A
23.4
N/A
10.1
13.6
0.3
3.4
2011
83
102
0.37
0.26
14.8
12.9
20.6
28.1
0.003
N/A
22.1
N/A
12.3
13.1
0.3
4.0
2010
88
113
0.35
N/A
14.4
14.7
20.4
29.7
0.004
N/A
26.6
N/A
9.0
18.7
0.4
3.7
2009
89
77
0.40
N/A
14.7
14.4
18.2
25.6
0.004
N/A
22.6
N/A
9.3
8.2
0.3
2.2
2008
100
85
0.45
N/A
16.7
16.0
20.6
26.5
N/A
N/A
N/A
N/A
12.6
9.4
N/A
3.0
2007
92
100
0.44
N/A
16.6
17.1
20.0
30.2
0.009
N/A
N/A
N/A
11.1
12.7
N/A
4.0
2006
100
83
0.46
N/A
18.0
18.0
21.8
29.3
N/A
N/A
21.9
N/A
11.1
N/A
N/A
4.2
2005
95
110
0.68
0.49
18.6
20.6
20.0
30.9
N/A
N/A
N/A
N/A
11.6
N/A
N/A
5.6
2004
98
91
0.63
0.36
18.5
18.7
20.4
27.7
N/A
N/A
N/A
N/A
9.9
N/A
N/A
5.5
2003
87
86
0.73
0.33
20.6
21.9
19.1
27.6
N/A
N/A
N/A
N/A
N/A
N/A
N/A
4.9
2002
78
98
0.65
0.32
19.5
21.4
18.0
29.4
0.006
N/A
20.0
N/A
N/A
N/A
N/A
4.5
2001
75
102
0.61
0.41
18.5
21.4
16.8
29.4
0.008
N/A
22.9
N/A
N/A
N/A
N/A
5.0
2000
65
104
0.66
0.40
18.9
22.1
15.6
28.0
0.009
N/A
N/A
N/A
N/A
N/A
N/A
6.3
Natural disasters
Type
San Jose
Cincinnati
Tornado activity compared to U.S. average
9%
166.3%
Earthquake activity compared to U.S. average
7,785.3%
148.2%
Natural disasters compared to U.S. average
19%
15%
Transportation
Both cities have extensive public transportation systems but San Jose provides more options like light rail, buses, and bike lanes. Cincinnati relies more on buses and cars for commuting.
Transport
Type
San Jose
Cincinnati
Amtrak stations
1
1
Amtrak stations nearby
3
2
FAA registered aircraft
553
454
FAA registered aircraft manufacturers and dealers
13
16
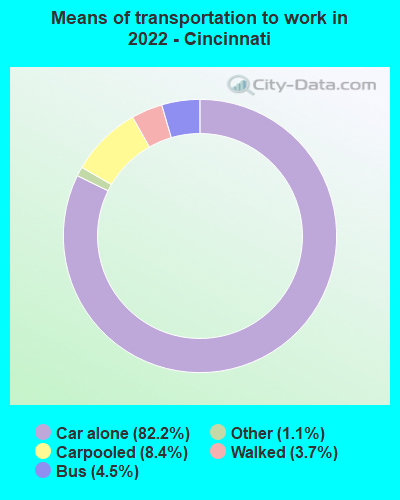
Means of transportation to work
Type
San Jose
Cincinnati
Bicycle
1%
0.3%
Bus
1.1%
3.2%
Carpooled
11.4%
7.2%
Car alone
80.5%
84.7%
Motorcycle
0.2%
0.1%
Railroad
0.2%
0%
Subway
0.2%
0%
Taxicab
0%
0.3%
Walked
3.3%
3.4%
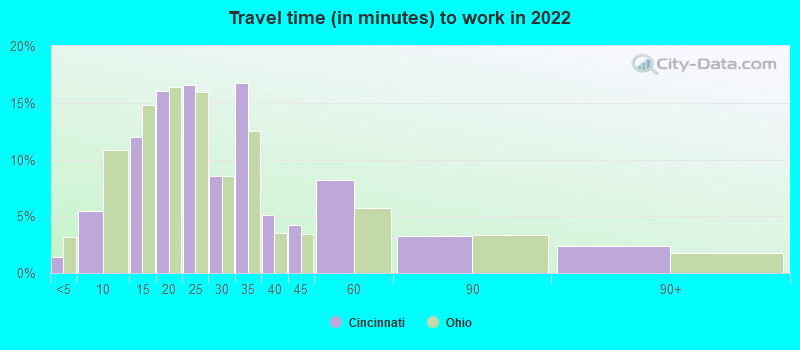
Average travel time to work
Type
San Jose
Cincinnati
Average
29.2 min
26.9 min
Other means
27.9 min
21.8 min
Public transportation
48.5 min
38 min
Private vehicle occupancy
Type
San Jose
Cincinnati
Average
1.2
1.1
Drove alone
87.3%
89.6%
In 2 person carpool
8.9%
8.6%
In 3 person carpool
1.9%
1%
In 4 person carpool
1.1%
0.6%
In 5-6 person carpool
0.6%
0.2%
In 7+ person carpool
0.2%
0%
How many people usually rode to work in the car, truck or van.
Real Estate
Real estate in San Jose is significantly pricier than in Cincinnati, with median house prices reflecting the disparity. Cincinnati offers more affordable housing options with a traditional midwestern style.
Neighborhoods
San Jose offers neighborhoods like Willow Glen and Silver Creek which are family-friendly while neighborhoods like Over the Rhine and Mount Adams in Cincinnati offer historic charm and are favored by young professionals.
Houses and residents
Type
San Jose
Cincinnati
Houses
340,561
160,420
Average household size (people)
3.1
2.1
Median year apartment built
1979
1961
Length of stay in the house since moving in
15.6 years
13.7 years
Houses occupied
322,881 (94.8%)
144,929 (90.3%)
Houses occupied by owners
179,797 (55.7%)
55,411 (38.2%)
Houses occupied by renters
143,084 (44.3%)
89,518 (61.8%)
Median rent asked for vacant for-rent units
$3,214
$823.02
Median monthly housing costs
$2,463
$918
Median price asked for vacant for-sale houses and condos
$1,197,016
$55,446
Estimated median house or condo value
Over $1,000,000
$190,300
Median numbers of rooms
4.9
4.6
Median number of rooms in apartments
3.6
3.7
Median number of rooms in houses and condos
6
6.5
Median house price - detached houses
Over $1,000,000
$271,565
Median house price - in 2-unit structures
$753,788
$236,559
Median house price - in 3-to-4-unit structures
$680,453
$378,023
Median house price - in 5 or more unit structures
$688,625
$288,600
Median house price - mobile homes
$240,963
$76,176
Median house price - Townhouses or other attached units
$892,629
$269,604
Median house price - All housing units
Over $1,000,000
$273,493
Median house age
45
70
Renting percentage
41.5%
61.1%
Housing density (houses/condos per square mile)
1,947.6
2,057.5
House value disparities
21.2%
42.9%
Household income disparities
38.3%
51.8%
Median household income for houses/condes with a mortgage
$197,583
$87,346
Median household income for apartments without a mortgage
$103,711
$63,683
Housing units without a mortgage
2,632 (2.1%)
1,063 (2.8%)
Housing units with both a second mortgage and home equity loan
13,499 (10.6%)
2,466 (6.5%)
Housing units with a mortgage
124,224 (97.9%)
36,710 (97.2%)
Housing units with a home equity loan
346 (0.3%)
116 (0.3%)
Housing units with a second mortgage
16,249 (12.8%)
3,803 (10.1%)
House/condo owner moved in on average (years ago)
14
11
House/condo renter moved in on average (years ago)
3
1
Housing units lacking complete kitchen facilities
1.2%
2.4%
Housing units lacking complete plumbing facilities
0.6%
1.5%
Housing units in structures
Housing units in structures
San Jose
Cincinnati
One, detached
50.9%
36.6%
One, attached
11.5%
4.9%
Two
1.1%
7.5%
3 or 4
5.0%
12.0%
5 to 9
5.1%
8.8%
10 to 19
4.5%
10.0%
20 to 49
4.5%
6.7%
50 or more
14.2%
13.2%
Mobile homes
3.1%
0.3%
Boats, RVs, vans, etc.
0.1%
0.0%
Median real estate property taxes paid for housing units
Self-employed workers in own not incorporated business
28,517
6,809
State government workers
10,222
4,546
Unpaid family workers
472
42
Industries and Occupations
San Jose is known for its technology and software services, while Cincinnati has a diversified economy with strong sectors in manufacturing, finance, and education.
Both cities have access to high-quality healthcare. San Jose has a larger network of hospitals and specialized healthcare facilities, while Cincinnati is home to renowned health institutions like Cincinnati Children's Hospital.
Health (county statistics)
Type
San Jose
Cincinnati
General health status score of residents in this county from 1 (poor) to 5 (excellent)
San Jose’s infrastructure is modern and frequently updated, reflecting its tech-forward approach. Cincinnati, with its historic architecture, provides a blend of old and new. Both cities have well-maintained roads, public utilities, and amenities.
Infrastructure
Type
San Jose
Cincinnati
Hospitals
20
46
TV stations
9
16
Arenas or stadiums
2
6
Bank branches located here
145
289
Bank institutions located here
25
35
Main business address for public companies
74
30
Drinking water stations with no reported violations in the past
21
2
Drinking water stations with reported violations in the past
HMDA - Conventional home purchase loans - Applications denied
Year
San Jose
Cincinnati
1999
3,839
1,027
2000
2,577
1,294
2001
1,953
1,046
2002
1,908
978
2003
3,578
1,051
2004
5,489
1,275
2005
6,994
1,694
2006
6,324
1,584
2007
4,298
991
2008
2,419
436
2009
1,631
279
Culture and Food
San Jose offers a diverse food scene, reflecting its multicultural population, while Cincinnati is known for its comfort food like Cincinnati chili. Culture in San Jose is influenced by various ethnic groups, whereas Cincinnati has a traditional Midwestern culture.
Sports Teams
San Jose boasts of the Sharks in the NHL and Earthquakes in MLS while Cincinnati takes pride in the Bengals of the NFL and Reds in the MLB.


 San Jose, CA
 Cincinnati, OH