San Jose, California, and Montgomery, Alabama, are distinctively different in almost every conceivable way. These variations span crime and safety, weather, cost of living, education, economy, infrastructure, occupations, employers, real estate, neighborhoods, transportation, taxes, culture, sports, geography, and health care. Each city has idiosyncrasies that can either appeal to or deter tourists and prospective residents. This comprehensive comparison will help you discover what each city offers.
Distance between
San Jose, CA and
Montgomery, AL : 2,035.0 miles
San Jose's population is larger by 395%. Its population has grown by 88,546 people (9.9%) since 2000. The population of Montgomery has decreased by 2,903 people (1.4%) during that time.
San Jose enjoys a lower crime rate compared to Montgomery. Official reports show that Montgomery has a higher crime rate, making San Jose the safer option. For visitors and those considering moving, this has a significant bearing on the general perception of safety. Nonetheless, it's always advisable to stay informed about local crime trends and engage with community safety initiatives.
City-data.com crime index counts serious crimes and violent crime more heavily. It adjusts for the number of visitors and daily workers commuting into cities. (higher means more crime, U.S. average = 301.1)
City-data.com crime index counts serious crimes and violent crime more heavily. It adjusts for the number of visitors and daily workers commuting into cities. (higher means more crime, U.S. average = 301.1)
Sex Offenders
According to our data, there are 1,806 registered sex offenders living in San Jose and 434 registered sex offenders living in . The ratio of residents to sex offenders in San Jose is 568 to 1; the ratio in Montgomery is 467 to 1. The number of registered sex offenders compared to the number of residents in San Jose is near to than in Montgomery.
Cost of Living
Living in San Jose comes at a significantly higher cost than Montgomery. The high cost is attributed to housing prices, which are some of the highest in the United States. Montgomery, on the other hand, boasts a cost of living below the national average, making it an affordable alternative for those planning to relocate.
Income Tax
California residents, including those in San Jose, pay a state income tax ranging from 1% to 13.3%. On the other hand, Alabama has an income tax rate ranging from 2% to 5%, comparatively lower than California.
Property Tax
Property tax in San Jose averages at 0.77%, while Montgomery's averages at 0.43%, almost half the rate of San Jose's. This difference could influence decisions to buy property in either city.
Sales Tax
Sales tax in San Jose is among the highest in the US at 8.75%. Montgomery, on the other hand, has a sales tax of 10%, which is higher than San Jose's but also higher than the national average.
Income
Type
San Jose
Montgomery
Estimated median household income
$126,377
$46,957
Estimated per capita income
$57,357
$27,253
Cost of living index (U.S. average is 100)
127.4
84.6
If you make $50,000 in Montgomery, you will have to make $75,296 in San Jose to maintain the same standard of living.
Geographical Conditions
San Jose is surrounded by mountains, with the coastline nearby, offering varied outdoor activities. Montgomery, located on a river, is characterized by flat terrain.
Both cities have solid educational institutions. However, San Jose holds an edge due to its proximity to renowned universities like Stanford and Berkeley. Furthermore, the San Jose Unified School District is one of the best performing in California. Montgomery, though lacking the big-name universities, has a good selection of colleges and public schools.
San Jose, located in the heart of Silicon Valley, boasts a booming tech-oriented economy. Montgomery, on the other hand, has a diverse economy centered around government, health care, manufacturing, and education. While San Jose may offer higher salaries, particularly in tech, Montgomery presents opportunities in a wider variety of sectors.
Biggest Employers
In San Jose, the largest employers are naturally tech behemoths like Apple, Google, and Cisco. Montgomery's biggest employers include the state of Alabama, Maxwell Air Force Base, and Hyundai Motor Manufacturing Alabama.
There were 299 building permits issued in San Jose in 2012 (216 more than in 2011) compared to 261 building permits issued in Montgomery in 2012 (87 more than in 2011).
In San Jose (Santa Clara County), 70.0% voted for Democrats and 27.1% for Republicans in 2012 Presidential Election. In Montgomery (Montgomery County), 62.0% voted for Democrats and 37.7% for Republicans.
Elections
Type
Democrats
Republicans
Other
Year
San Jose
Montgomery
San Jose
Montgomery
San Jose
Montgomery
2020
72.7%
65.1%
25.2%
33.6%
2.1%
1.3%
2016
72.7%
61.4%
20.6%
35.5%
6.7%
3.1%
2012
70.0%
62.0%
27.1%
37.7%
2.9%
0.3%
2008
69.6%
59.7%
28.6%
40.3%
1.8%
0.0%
2004
64.3%
50.6%
34.8%
49.4%
0.9%
0.0%
2000
60.7%
50.4%
34.4%
48.4%
4.9%
1.2%
1996
56.9%
48.7%
32.2%
48.0%
11.0%
3.3%
Breakdown of population affiliated with a religious congregation
Type
Adherents
Congregations
Religion
San Jose
Montgomery
San Jose
Montgomery
CATHOLIC CHURCH
25.1%
4.1%
6.0%
2.5%
MUSLIM ESTIMATE
1.1%
0.4%
1.8%
0.8%
SOUTHERN BAPTIST CONVENTION
0.9%
18.8%
7.7%
15.3%
EPISCOPAL CHURCH
0.5%
1.2%
2.3%
1.7%
SEVENTH DAY ADVENTIST CHURCH
0.4%
0.9%
2.6%
1.4%
EVANGELICAL LUTHERAN CHURCH IN AMERICA
0.3%
0.1%
2.3%
0.3%
AMERICAN BAPTIST CHURCHES IN THE USA
0.1%
2.2%
1.1%
0.6%
PRESBYTERIAN CHURCH IN AMERICA
0.0%
1.2%
0.8%
2.0%
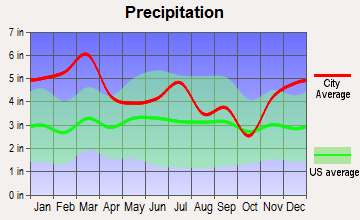
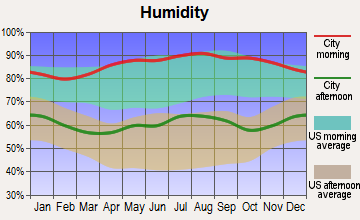
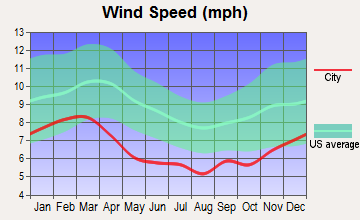
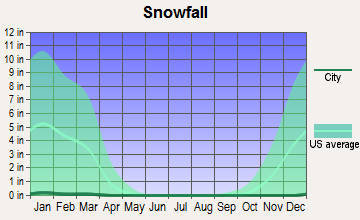
Weather
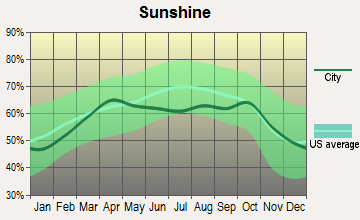
San Jose enjoys a Mediterranean-like climate with moderate, wet winters and warm, dry summers. Comparatively, Montgomery experiences a humid subtropical climate with hot summers, mild winters, and high humidity throughout the year. Visitors to either city will notice a significant contrast between the two climates.
Weather and climate
Type
San Jose
Montgomery
Temperature - Average
60.9°F
64.8°F
Humidity - Average morning or afternoon humidity
77.3%
76.7%
Humidity - Differences between morning and afternoon humidity
35.5%
40%
Humidity - Maximum monthly morning or afternoon humidity
87%
91%
Humidity - Minimum monthly morning or afternoon humidity
51.6%
51%
Precipitation - Yearly average
16.1 in
52.5 in
Snowfall - Yearly average
0 in
0.8 in
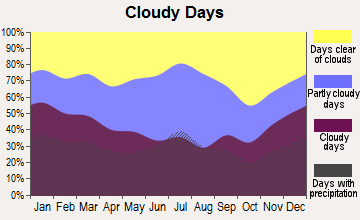
Clouds - Number of days clear of clouds
27.4%
17.9%
Sunshine amount - Average
73.8%
63.1%
Sunshine amount - Differences during a year
23%
17%
Sunshine amount - Maximum monthly
77.4%
64%
Sunshine amount - Minimum monthly
54.4%
47%
Wind speed - Average
10.3 mph
6.4 mph
Average climate in San Jose, California
Average climate in Montgomery, Alabama
Air pollution
Type
AQI
CO
NO2
OZONE
PB
PM25
SO2
Year
San Jose
Montgomery
San Jose
San Jose
San Jose
Montgomery
San Jose
San Jose
Montgomery
San Jose
2018
94
75
0.49
N/A
14.5
N/A
22.2
26.3
0.006
N/A
12.5
13.8
0.2
N/A
2017
91
89
0.50
N/A
14.6
N/A
23.5
27.8
0.004
N/A
10.2
11.7
0.2
N/A
2016
69
75
0.47
N/A
13.7
N/A
22.4
29.6
0.003
N/A
8.8
8.8
0.2
N/A
2015
84
76
0.52
N/A
15.4
N/A
22.3
26.8
0.004
N/A
9.2
10.6
0.3
N/A
2014
83
55
0.40
N/A
13.9
N/A
21.5
28.2
0.004
N/A
8.2
N/A
0.2
N/A
2013
90
53
0.41
N/A
15.2
N/A
20.8
27.2
0.005
N/A
12.4
N/A
0.3
N/A
2012
74
63
0.35
N/A
13.3
N/A
21.8
29.7
0.003
N/A
10.1
N/A
0.3
N/A
2011
83
67
0.37
N/A
14.8
N/A
20.6
31.2
0.003
N/A
12.3
N/A
0.3
N/A
2010
88
84
0.35
N/A
14.4
N/A
20.4
31.2
0.004
N/A
9.0
12.5
0.4
N/A
2009
89
68
0.40
N/A
14.7
N/A
18.2
27.1
0.004
N/A
9.3
10.5
0.3
N/A
2008
100
79
0.45
N/A
16.7
N/A
20.6
30.4
N/A
N/A
12.6
N/A
N/A
N/A
2007
92
90
0.44
N/A
16.6
N/A
20.0
34.0
0.009
N/A
11.1
N/A
N/A
N/A
2006
100
73
0.46
N/A
18.0
N/A
21.8
31.4
N/A
N/A
11.1
N/A
N/A
N/A
2005
95
71
0.68
N/A
18.6
N/A
20.0
28.0
N/A
N/A
11.6
N/A
N/A
N/A
2004
98
62
0.63
N/A
18.5
N/A
20.4
26.0
N/A
N/A
9.9
N/A
N/A
N/A
2003
87
67
0.73
N/A
20.6
N/A
19.1
25.4
N/A
N/A
N/A
N/A
N/A
N/A
2002
78
78
0.65
N/A
19.5
N/A
18.0
28.6
0.006
N/A
N/A
N/A
N/A
N/A
2001
75
94
0.61
N/A
18.5
N/A
16.8
28.3
0.008
N/A
N/A
N/A
N/A
N/A
2000
65
108
0.66
N/A
18.9
N/A
15.6
35.9
0.009
N/A
N/A
N/A
N/A
N/A
Natural disasters
Type
San Jose
Montgomery
Tornado activity compared to U.S. average
9%
144.5%
Earthquake activity compared to U.S. average
7,785.3%
166.1%
Natural disasters compared to U.S. average
19%
15%
Transportation
San Jose has more extensive public transit and commuting options, including a metro system, buses, and an extensive network of freeways. Montgomery's transport system includes buses and commuter vans, but it less extensive.
Transport
Type
San Jose
Montgomery
Amtrak stations
1
1
Amtrak stations nearby
3
1
FAA registered aircraft
553
168
FAA registered aircraft manufacturers and dealers
13
9
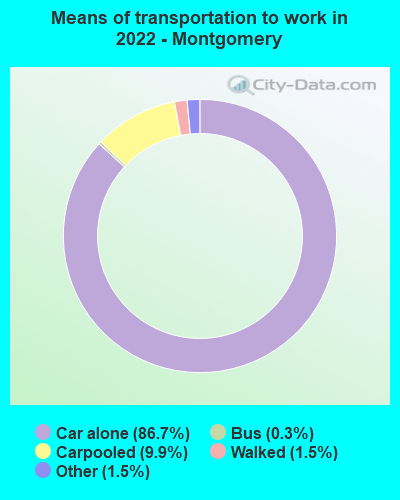
Means of transportation to work
Type
San Jose
Montgomery
Bicycle
1%
0.1%
Bus
1.1%
0.3%
Carpooled
11.4%
8.1%
Car alone
80.5%
89.9%
Motorcycle
0.2%
0.1%
Railroad
0.2%
0%
Subway
0.2%
0%
Taxicab
0%
0.2%
Walked
3.3%
1.1%
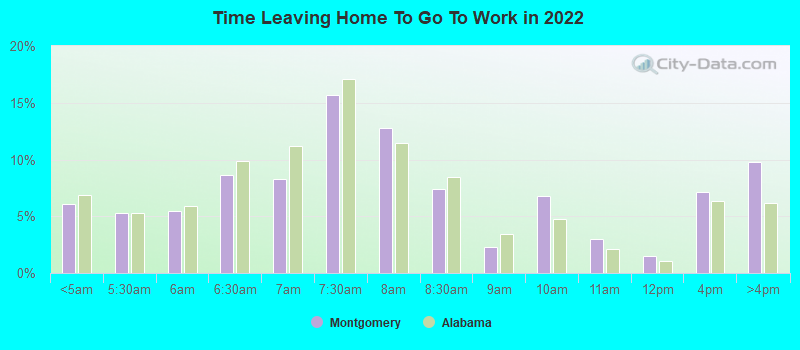
Average travel time to work
Type
San Jose
Montgomery
Average
29.2 min
26.5 min
Other means
27.9 min
19.9 min
Public transportation
48.5 min
31.7 min
Private vehicle occupancy
Type
San Jose
Montgomery
Average
1.2
1.1
Drove alone
87.3%
90.3%
In 2 person carpool
8.9%
7.7%
In 3 person carpool
1.9%
1.1%
In 4 person carpool
1.1%
0.4%
In 5-6 person carpool
0.6%
0.1%
In 7+ person carpool
0.2%
0.3%
How many people usually rode to work in the car, truck or van.
Real Estate
San Jose real estate is notoriously expensive, while Montgomery offers much more affordable housing options. This makes Montgomery an attractive choice for those looking to buy homes without breaking the bank.
Neighborhoods
San Jose offers diverse neighborhoods each with its unique flavor. Montgomery also has a good blend of historic and modern neighborhoods. Both cities have safe, family-friendly neighborhoods with good amenities.
Houses and residents
Type
San Jose
Montgomery
Houses
340,561
93,055
Average household size (people)
3.1
2.4
Median year apartment built
1979
1981
Median year house/condo built
1973
1979
Length of stay in the house since moving in
15.6 years
14.9 years
Houses occupied
322,881 (94.8%)
81,529 (87.6%)
Houses occupied by owners
179,797 (55.7%)
45,969 (56.4%)
Houses occupied by renters
143,084 (44.3%)
35,560 (43.6%)
Median rent asked for vacant for-rent units
$3,214
$1,021
Median monthly housing costs
$2,463
$926
Median price asked for vacant for-sale houses and condos
$1,197,016
$177,602
Estimated median house or condo value
Over $1,000,000
$136,800
Median numbers of rooms
4.9
5.7
Median number of rooms in apartments
3.6
4.4
Median number of rooms in houses and condos
6
6.7
Median house price - detached houses
Over $1,000,000
$182,881
Median house price - in 2-unit structures
$753,788
$83,037
Median house price - in 3-to-4-unit structures
$680,453
$87,195
Median house price - in 5 or more unit structures
$688,625
$55,784
Median house price - mobile homes
$240,963
$154,829
Median house price - Townhouses or other attached units
$892,629
$110,664
Median house price - All housing units
Over $1,000,000
$179,453
Median house age
45
43
Renting percentage
41.5%
41.1%
Housing density (houses/condos per square mile)
1,947.6
598.9
House value disparities
21.2%
41.3%
Household income disparities
38.3%
46.9%
Median household income for houses/condes with a mortgage
$197,583
$69,253
Median household income for apartments without a mortgage
$103,711
$43,782
Housing units without a mortgage
2,632 (2.1%)
462 (1.6%)
Housing units with both a second mortgage and home equity loan
13,499 (10.6%)
1,755 (6.1%)
Housing units with a mortgage
124,224 (97.9%)
28,109 (98.4%)
Housing units with a home equity loan
346 (0.3%)
309 (1.1%)
Housing units with a second mortgage
16,249 (12.8%)
2,440 (8.5%)
House/condo owner moved in on average (years ago)
14
14
House/condo renter moved in on average (years ago)
3
1
Housing units lacking complete kitchen facilities
1.2%
4%
Housing units lacking complete plumbing facilities
0.6%
3.7%
Housing units in structures
Housing units in structures
San Jose
Montgomery
One, detached
50.9%
70.2%
One, attached
11.5%
3.4%
Two
1.1%
0.9%
3 or 4
5.0%
4.3%
5 to 9
5.1%
8.7%
10 to 19
4.5%
7.0%
20 to 49
4.5%
1.1%
50 or more
14.2%
2.0%
Mobile homes
3.1%
2.4%
Boats, RVs, vans, etc.
0.1%
0.0%
Median real estate property taxes paid for housing units
Self-employed workers in own not incorporated business
28,517
4,332
State government workers
10,222
6,387
Unpaid family workers
472
0
Industries and Occupations
Tech dominates in San Jose, with many residents involved in software development, computer programming, and related occupations. Montgomery's economy is more diverse, with jobs spread across the government sector, health care, education, and manufacturing.
San Jose has high-quality healthcare facilities, including renowned research hospitals. Montgomery also has solid healthcare services, with multiple hospitals and clinics servicing the area.
Health (county statistics)
Type
San Jose
Montgomery
General health status score of residents in this county from 1 (poor) to 5 (excellent)
San Jose, with its larger population and tax base, has a more developed infrastructure, including public buildings, roads, and parks. Montgomery's infrastructure, while sufficient, is less extensive. However, both cities are constantly investing in infrastructural development.
Infrastructure
Type
San Jose
Montgomery
Hospitals
20
14
TV stations
9
11
Arenas or stadiums
2
2
Bank branches located here
145
69
Bank institutions located here
25
18
Main business address for public companies
74
3
Drinking water stations with no reported violations in the past
21
3
Drinking water stations with reported violations in the past
HMDA - Conventional home purchase loans - Applications denied
Year
San Jose
Montgomery
1999
3,839
1,463
2000
2,577
832
2001
1,953
509
2002
1,908
393
2003
3,578
393
2004
5,489
529
2005
6,994
779
2006
6,324
694
2007
4,298
538
2008
2,419
243
2009
1,631
100
Culture and Food
San Jose boasts a diverse culture due to its many immigrants, leading to a vibrant food scene with cuisines from all around the world. Montgomery, with its southern charm, showcases the best of Southern cuisine and traditional arts.
Sports Teams
San Jose is home to several major sports teams, including the NHL's San Jose Sharks and the MLS's San Jose Earthquakes. Montgomery doesn't have any major league teams but has several minor league teams and college sports.


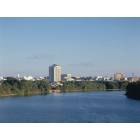
 San Jose, CA
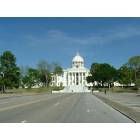
 Montgomery, AL