San Jose, CA and Pittsburgh, PA take different places on the U.S. map and also in the hearts of their citizens. While San Jose is the capital of the high tech universe, Pittsburgh appeals with a robust industrial history and riverside charm. Each city brings a unique lifestyle defined by distinct climates, cost of living, educational opportunities, economic prospects, cultural richness, sports fervor, and more. This guide will delve into these facets of both cities, providing a comparative appraisal for those considering relocation or a visit.
Distance between
San Jose, CA and
Pittsburgh, PA : 2,242.8 miles
San Jose's population is larger by 227%. Its population has grown by 88,546 people (9.9%) since 2000. The population of Pittsburgh has decreased by 34,132 people (10.2%) during that time.
San Jose's crime rate is above the national average, though lower than many other Californian cities. Pittsburgh's crime rate is high, particularly for violent crimes. However, both cities have some safer neighborhoods, and community engagement in promoting safety is seen in both cities. It's always recommended that residents and tourists alike remain vigilant and take common-sense precautions.
City-data.com crime index counts serious crimes and violent crime more heavily. It adjusts for the number of visitors and daily workers commuting into cities. (higher means more crime, U.S. average = 301.1)
City-data.com crime index counts serious crimes and violent crime more heavily. It adjusts for the number of visitors and daily workers commuting into cities. (higher means more crime, U.S. average = 301.1)
Sex Offenders
According to our data, there are 1,806 registered sex offenders living in San Jose and 699 registered sex offenders living in . The ratio of residents to sex offenders in San Jose is 568 to 1; the ratio in Pittsburgh is 434 to 1. The number of registered sex offenders compared to the number of residents is a smaller in San Jose than in Pittsburgh.
Cost of Living
San Jose is one of the most expensive cities in the U.S, largely influenced by housing costs. Conversely, Pittsburgh is more affordable, with a cost of living below the national average. However, incomes in San Jose tend to be higher to balance out the costs.
Income Tax
California's income tax rate is progressive and can reach up to 13.3% in San Jose. Pennsylvania has a flat income tax rate of 3.07%, and Pittsburgh adds a local income tax of 3%.
Property Tax
Property tax in San Jose averages 0.77% while in Pittsburgh it's around 2.02%. This is a noteworthy factor considering the major difference in real estate prices in both cities.
Sales Tax
San Jose has a combined city and state sales tax rate of 9.25%, while Pittsburgh, Pennsylvania has a combined rate of 7%.
Income
Type
San Jose
Pittsburgh
Estimated median household income
$126,377
$57,821
Estimated per capita income
$57,357
$39,779
Cost of living index (U.S. average is 100)
127.4
95.2
If you make $50,000 in Pittsburgh, you will have to make $66,912 in San Jose to maintain the same standard of living.
Geographical Conditions
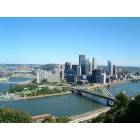
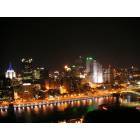
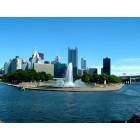
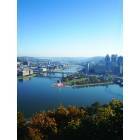
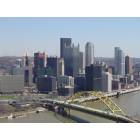
San Jose offers a mix of urban sites, lush parks, and scenic hills. Pittsburgh is characterized by hilly terrain, punctuated by three rivers and numerous bridges, providing a unique landscape.
Both cities are recognized for their education. San Jose is in close proximity to top-ranked universities like Stanford and UC Berkeley. Pittsburgh is home to prestigious institutions like Carnegie Mellon University and University of Pittsburgh. Both cities also have well-regarded public school systems.
San Jose, also known as Silicon Valley, boasts a powerful economy grounded in tech and IT, with high-income jobs. Pittsburgh, once a steel-making hub, has diversified into healthcare, education, and technology, which offers a stable job market.
Biggest Employers
In San Jose, some of the biggest employers are tech giants like Apple, Google, and Adobe. Pittsburgh's healthcare giants UPMC and Highmark along with the University of Pittsburgh are major employers in the city.
There were 299 building permits issued in San Jose in 2012 (216 more than in 2011) compared to 198 building permits issued in Pittsburgh in 2012 (86 less than in 2011).
In San Jose (Santa Clara County), 70.0% voted for Democrats and 27.1% for Republicans in 2012 Presidential Election. In Pittsburgh (Allegheny County), 56.5% voted for Democrats and 42.0% for Republicans.
Elections
Type
Democrats
Republicans
Other
Year
San Jose
Pittsburgh
San Jose
Pittsburgh
San Jose
Pittsburgh
2020
72.7%
59.4%
25.2%
39.0%
2.1%
1.5%
2016
72.7%
55.9%
20.6%
39.5%
6.7%
4.6%
2012
70.0%
56.5%
27.1%
42.0%
2.9%
1.5%
2008
69.6%
57.1%
28.6%
41.7%
1.8%
1.2%
2004
64.3%
57.2%
34.8%
42.2%
0.9%
0.6%
2000
60.7%
56.6%
34.4%
40.4%
4.9%
2.9%
1996
56.9%
52.8%
32.2%
37.9%
11.0%
9.3%
Breakdown of population affiliated with a religious congregation
Type
Adherents
Congregations
Religion
San Jose
Pittsburgh
San Jose
Pittsburgh
CATHOLIC CHURCH
25.1%
37.7%
6.0%
15.6%
MUSLIM ESTIMATE
1.1%
0.5%
1.8%
0.9%
SOUTHERN BAPTIST CONVENTION
0.9%
0.2%
7.7%
2.8%
EPISCOPAL CHURCH
0.5%
0.6%
2.3%
1.7%
SEVENTH DAY ADVENTIST CHURCH
0.4%
0.2%
2.6%
0.5%
EVANGELICAL LUTHERAN CHURCH IN AMERICA
0.3%
2.0%
2.3%
6.7%
LUTHERAN CHURCH
0.2%
0.3%
1.4%
1.8%
AMERICAN BAPTIST CHURCHES IN THE USA
0.1%
1.4%
1.1%
3.7%
SALVATION ARMY
0.1%
0.3%
0.4%
0.8%
Weather
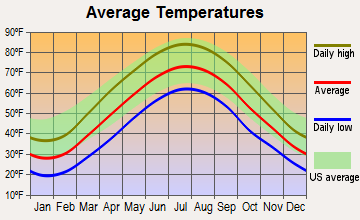
San Jose benefits from a Mediterranean climate with warm, dry summers and mild, wet winters. On the other hand, Pittsburgh experiences a humid continental climate. It sees four distinct seasons with cold winters and warm, humid summers. For those with weather sensitivities, the mild, dry San Jose weather is usually more appealing.
Weather and climate
Type
San Jose
Pittsburgh
Temperature - Average
60.9°F
51.3°F
Humidity - Average morning or afternoon humidity
77.3%
73.7%
Humidity - Differences between morning and afternoon humidity
35.5%
36%
Humidity - Maximum monthly morning or afternoon humidity
87%
86%
Humidity - Minimum monthly morning or afternoon humidity
51.6%
50%
Precipitation - Yearly average
16.1 in
38.6 in
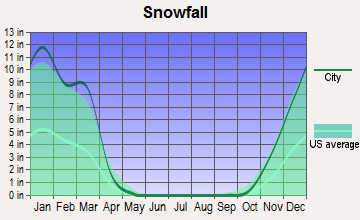
Snowfall - Yearly average
0 in
87.7 in
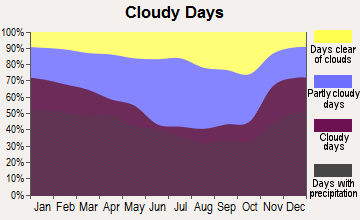
Clouds - Number of days clear of clouds
27.4%
9.8%
Sunshine amount - Average
73.8%
46%
Sunshine amount - Differences during a year
23%
31%
Sunshine amount - Maximum monthly
77.4%
54%
Sunshine amount - Minimum monthly
54.4%
23%
Wind speed - Average
10.3 mph
8.5 mph
Average climate in San Jose, California
Average climate in Pittsburgh, Pennsylvania
Air pollution
Type
AQI
CO
NO2
OZONE
PB
PM10
PM25
SO2
Year
San Jose
Pittsburgh
San Jose
Pittsburgh
San Jose
Pittsburgh
San Jose
Pittsburgh
San Jose
Pittsburgh
Pittsburgh
San Jose
Pittsburgh
San Jose
Pittsburgh
2018
94
105
0.49
0.26
14.5
5.7
22.2
24.7
0.006
N/A
15.1
N/A
12.5
11.8
0.2
0.6
2017
91
102
0.50
0.25
14.6
5.7
23.5
26.2
0.004
N/A
16.4
N/A
10.2
9.5
0.2
0.6
2016
69
100
0.47
0.27
13.7
6.5
22.4
25.9
0.003
0.002
15.6
N/A
8.8
10.4
0.2
0.7
2015
84
110
0.52
0.26
15.4
7.5
22.3
24.8
0.004
0.007
18.6
N/A
9.2
11.0
0.3
1.0
2014
83
107
0.40
0.30
13.9
9.3
21.5
23.1
0.004
0.042
18.1
N/A
8.2
10.4
0.2
1.2
2013
90
99
0.41
0.27
15.2
10.8
20.8
25.1
0.005
0.164
16.6
N/A
12.4
10.3
0.3
2.4
2012
74
120
0.35
0.33
13.3
13.0
21.8
25.4
0.003
N/A
19.5
N/A
10.1
10.3
0.3
2.5
2011
83
118
0.37
0.29
14.8
13.3
20.6
24.5
0.003
N/A
16.6
N/A
12.3
12.2
0.3
2.6
2010
88
151
0.35
0.37
14.4
13.6
20.4
24.5
0.004
N/A
20.2
N/A
9.0
12.1
0.4
5.0
2009
89
129
0.40
0.23
14.7
12.9
18.2
23.0
0.004
0.017
18.5
N/A
9.3
14.9
0.3
4.0
2008
100
135
0.45
0.26
16.7
16.1
20.6
22.3
N/A
0.017
20.6
N/A
12.6
16.7
N/A
4.8
2007
92
140
0.44
0.39
16.6
15.6
20.0
22.8
0.009
0.010
21.7
N/A
11.1
19.0
N/A
5.9
2006
100
149
0.46
0.35
18.0
16.2
21.8
20.2
N/A
0.028
19.3
N/A
11.1
16.1
N/A
6.6
2005
95
107
0.68
0.33
18.6
19.1
20.0
20.0
N/A
0.031
20.9
N/A
11.6
N/A
N/A
7.4
2004
98
93
0.63
0.41
18.5
18.9
20.4
19.7
N/A
0.019
21.0
N/A
9.9
N/A
N/A
6.6
2003
87
102
0.73
0.36
20.6
19.6
19.1
21.3
N/A
0.032
21.3
N/A
N/A
N/A
N/A
8.7
2002
78
111
0.65
0.32
19.5
20.1
18.0
21.7
0.006
0.017
20.2
N/A
N/A
N/A
N/A
9.2
2001
75
107
0.61
0.60
18.5
21.2
16.8
21.1
0.008
0.017
26.0
N/A
N/A
N/A
N/A
8.5
2000
65
102
0.66
0.62
18.9
22.0
15.6
19.8
0.009
0.016
22.8
N/A
N/A
N/A
N/A
9.1
Natural disasters
Type
San Jose
Pittsburgh
Tornado activity compared to U.S. average
9%
80.2%
Earthquake activity compared to U.S. average
7,785.3%
44.6%
Natural disasters compared to U.S. average
19%
15%
Transportation
Both cities offer public transportation. San Jose's VTA light rail, buses, and BART serve the city whereas Pittsburgh has Port Authority buses and light rail ("The T"). Both cities have significant rush-hour congestion.
Transport
Type
San Jose
Pittsburgh
Amtrak stations
1
1
Amtrak stations nearby
3
1
FAA registered aircraft
553
233
FAA registered aircraft manufacturers and dealers
13
3
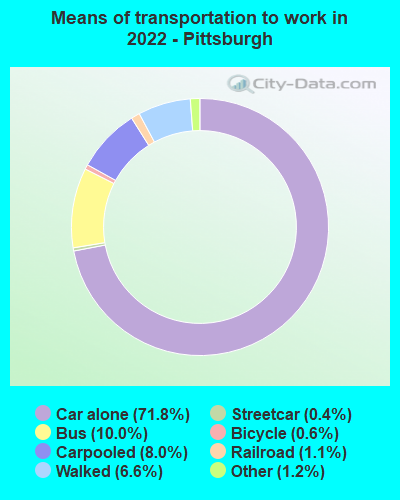
Means of transportation to work
Type
San Jose
Pittsburgh
Bicycle
1%
0.8%
Bus
1.1%
9.3%
Carpooled
11.4%
7.4%
Car alone
80.5%
74%
Motorcycle
0.2%
0.1%
Railroad
0.2%
0.7%
Streetcar
0%
0.6%
Subway
0.2%
0.1%
Taxicab
0%
0.1%
Walked
3.3%
4.8%
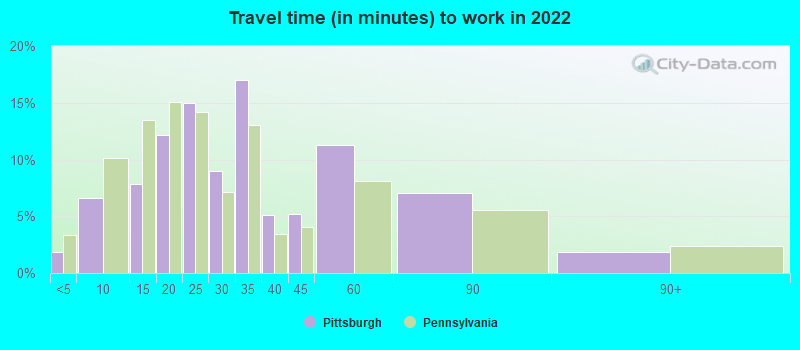
Average travel time to work
Type
San Jose
Pittsburgh
Average
29.2 min
31 min
Other means
27.9 min
21.6 min
Public transportation
48.5 min
33.4 min
Private vehicle occupancy
Type
San Jose
Pittsburgh
Average
1.2
1.1
Drove alone
87.3%
90.3%
In 2 person carpool
8.9%
8%
In 3 person carpool
1.9%
0.8%
In 4 person carpool
1.1%
0.5%
In 5-6 person carpool
0.6%
0%
In 7+ person carpool
0.2%
0.3%
How many people usually rode to work in the car, truck or van.
Real Estate
San Jose's real estate market is extremely expensive, with high property values, driven by the tech industry's growth. Pittsburgh offers a more affordable housing market but with less appreciating property values.
Neighborhoods
San Jose features affluent neighborhoods like Silver Creek and Willow Glen. Pittsburgh's neighborhoods reflect its rich history, such as the riverside charm of Strip District or intellectual vibes of University Center.
Houses and residents
Type
San Jose
Pittsburgh
Houses
340,561
159,435
Average household size (people)
3.1
2.1
Median year apartment built
1979
1954
Length of stay in the house since moving in
15.6 years
16.4 years
Houses occupied
322,881 (94.8%)
136,747 (85.8%)
Houses occupied by owners
179,797 (55.7%)
66,729 (48.8%)
Houses occupied by renters
143,084 (44.3%)
70,018 (51.2%)
Median rent asked for vacant for-rent units
$3,214
$1,381
Median monthly housing costs
$2,463
$985
Median price asked for vacant for-sale houses and condos
$1,197,016
$325,759
Estimated median house or condo value
Over $1,000,000
$181,100
Median numbers of rooms
4.9
5.2
Median number of rooms in apartments
3.6
4
Median number of rooms in houses and condos
6
6.3
Median house price - detached houses
Over $1,000,000
$256,260
Median house price - in 2-unit structures
$753,788
$174,463
Median house price - in 3-to-4-unit structures
$680,453
$299,629
Median house price - in 5 or more unit structures
$688,625
$310,273
Median house price - mobile homes
$240,963
$187,764
Median house price - Townhouses or other attached units
$892,629
$258,331
Median house price - All housing units
Over $1,000,000
$257,793
Median house age
45
80
Renting percentage
41.5%
52.4%
Housing density (houses/condos per square mile)
1,947.6
2,868.3
House value disparities
21.2%
43.1%
Household income disparities
38.3%
49.5%
Median household income for houses/condes with a mortgage
$197,583
$97,230
Median household income for apartments without a mortgage
$103,711
$58,579
Housing units without a mortgage
2,632 (2.1%)
2,260 (5.6%)
Housing units with both a second mortgage and home equity loan
13,499 (10.6%)
4,417 (11%)
Housing units with a mortgage
124,224 (97.9%)
37,784 (94.4%)
Housing units with a home equity loan
346 (0.3%)
297 (0.7%)
Housing units with a second mortgage
16,249 (12.8%)
4,975 (12.4%)
House/condo owner moved in on average (years ago)
14
15
House/condo renter moved in on average (years ago)
3
1
Housing units lacking complete kitchen facilities
1.2%
3%
Housing units lacking complete plumbing facilities
0.6%
2.8%
Housing units in structures
Housing units in structures
San Jose
Pittsburgh
One, detached
50.9%
43.7%
One, attached
11.5%
15.6%
Two
1.1%
8.9%
3 or 4
5.0%
6.2%
5 to 9
5.1%
4.8%
10 to 19
4.5%
4.3%
20 to 49
4.5%
4.3%
50 or more
14.2%
11.5%
Mobile homes
3.1%
0.6%
Boats, RVs, vans, etc.
0.1%
0.0%
Median real estate property taxes paid for housing units
Self-employed workers in own not incorporated business
28,517
5,977
State government workers
10,222
5,427
Unpaid family workers
472
73
Industries and Occupations
San Jose leads in tech, software services, and manufacturing, employing people in high-skilled jobs. Pittsburgh has a mix of healthcare, education, technology, and finance industries offering a range of occupational opportunities.
San Jose offers quality healthcare with renowned facilities like Stanford Health Care. Pittsburgh's UPMC system is one of the top healthcare providers in the nation.
Health (county statistics)
Type
San Jose
Pittsburgh
General health status score of residents in this county from 1 (poor) to 5 (excellent)
San Jose's infrastructure is contemporary due to constant expansion of the tech industry. Meanwhile, Pittsburgh boasts a rich mix of historical and modern structures. Both cities, though, face infrastructure-related challenges such as traffic congestion and aging public transportation systems.
Infrastructure
Type
San Jose
Pittsburgh
Hospitals
20
41
TV stations
9
22
Arenas or stadiums
2
3
Bank branches located here
145
250
Bank institutions located here
25
27
Main business address for public companies
74
37
Drinking water stations with no reported violations in the past
21
1
Drinking water stations with reported violations in the past
HMDA - Conventional home purchase loans - Applications denied
Year
San Jose
Pittsburgh
1999
3,839
576
2000
2,577
539
2001
1,953
443
2002
1,908
378
2003
3,578
523
2004
5,489
614
2005
6,994
761
2006
6,324
807
2007
4,298
671
2008
2,419
347
2009
1,631
210
Culture and Food
San Jose has a diverse, multicultural scene with high-end dining options, food trucks, and ethnic food. Pittsburgh's food culture is a blend of new-age restaurants and old-world diners, famous for its pierogis and sandwiches.
Sports Teams
San Jose sports teams include the San Jose Sharks (NHL) and the Earthquakes (MLS). Pittsburgh is home to the Steelers (NFL), Pirates (MLB), and Penguins (NHL).


 San Jose, CA
 Pittsburgh, PA