As two vastly different cities situated in different corners of the United States, San Jose, California and Shreveport, Louisiana offer unique lifestyles that cater to various preferences. San Jose, one of the biggest cities in California, attracts visitors with its innovative technology scene in Silicon Valley and Mediterranean weather. Shreveport, nestled in northwest Louisiana, is famous for its Southern charm, dynamic riverfront entertainment, and affordable cost of living. In this comparison, we will delve into different elements of life, including safety, weather, cost of living, education, economy, and more in these two cities.
Distance between
San Jose, CA and
Shreveport, LA : 1,621.0 miles
San Jose's population is larger by 434%. Its population has grown by 88,546 people (9.9%) since 2000. The population of Shreveport has decreased by 16,124 people (8.1%) during that time.
San Jose boasts of safety measures where the crime rate remains relatively lower than in other big cities in California. However, like any major city, crime level can be dependent on the neighborhood. Shreveport presents a higher crime rate compared to the US average, which deters some from considering the city as their home. However, efforts are ongoing to improve safety within the community.
City-data.com crime index counts serious crimes and violent crime more heavily. It adjusts for the number of visitors and daily workers commuting into cities. (higher means more crime, U.S. average = 301.1)
City-data.com crime index counts serious crimes and violent crime more heavily. It adjusts for the number of visitors and daily workers commuting into cities. (higher means more crime, U.S. average = 301.1)
Sex Offenders
According to our data, there are 1,806 registered sex offenders living in San Jose and 661 registered sex offenders living in . The ratio of residents to sex offenders in San Jose is 568 to 1; the ratio in Shreveport is 295 to 1. The number of registered sex offenders compared to the number of residents is a smaller in San Jose than in Shreveport.
Cost of Living
The cost of living in San Jose is considerably higher than in Shreveport. Housing costs, in particular, are substantially elevated in San Jose due to its proximity to the tech hub, Silicon Valley. Shreveport is known for its affordability, with significantly lower housing costs and generally lower living expenses overall.
Income Tax
California has a progressive income tax system, making San Jose a more expensive place to live for high earners. On the contrary, Louisiana's income tax rates are more modest and less progressive.
Property Tax
San Jose residents face property taxes averaging 0.77%, whereas in Shreveport, the property tax rates average 0.83%.
Sales Tax
The sales tax in San Jose is 9.25%, higher than Shreveport's which stands at 8.6%.
Income
Type
San Jose
Shreveport
Estimated median household income
$126,377
$42,034
Estimated per capita income
$57,357
$27,828
Cost of living index (U.S. average is 100)
127.4
84.7
If you make $50,000 in Shreveport, you will have to make $75,207 in San Jose to maintain the same standard of living.
Geographical Conditions
San Jose, situated in the Santa Clara Valley, offers beautiful mountain range views. In contrast, Shreveport is known for its riverine geography, with the Red River being a prominent feature.
San Jose serves as an education hotspot with several highly ranked colleges and universities nearby, including Stanford and UC Berkeley. Shreveport's colleges, like the Louisiana State University Health Shreveport, also provide quality education, though they're less internationally recognized.
San Jose, as the heart of Silicon Valley, is a powerhouse for tech-related job opportunities. Shreveport's economy is more diversified, with sectors like gaming, healthcare, and film industries being the main economic drivers.
Biggest Employers
In San Jose, tech companies like Adobe, Cisco Systems, and eBay are among the top employers. In Shreveport, Willis-Knighton Health System, Caddo Public Schools, and the City of Shreveport are top employers.
There were 299 building permits issued in San Jose in 2012 (216 more than in 2011) compared to 218 building permits issued in Shreveport in 2012 (75 less than in 2011).
In San Jose (Santa Clara County), 70.0% voted for Democrats and 27.1% for Republicans in 2012 Presidential Election. In Shreveport (Caddo Parish), 52.2% voted for Democrats and 47.1% for Republicans.
Elections
Type
Democrats
Republicans
Other
Year
San Jose
Shreveport
San Jose
Shreveport
San Jose
Shreveport
2020
72.7%
52.8%
25.2%
46.0%
2.1%
1.3%
2016
72.7%
50.7%
20.6%
46.5%
6.7%
2.8%
2012
70.0%
52.2%
27.1%
47.1%
2.9%
0.7%
2008
69.6%
51.4%
28.6%
48.3%
1.8%
0.3%
2004
64.3%
48.8%
34.8%
51.2%
0.9%
0.0%
2000
60.7%
49.8%
34.4%
49.1%
4.9%
1.1%
1996
56.9%
79.7%
32.2%
17.8%
11.0%
2.5%
Breakdown of population affiliated with a religious congregation
Type
Adherents
Congregations
Religion
San Jose
Shreveport
San Jose
Shreveport
CATHOLIC CHURCH
25.1%
5.6%
6.0%
3.2%
MUSLIM ESTIMATE
1.1%
0.2%
1.8%
0.6%
SOUTHERN BAPTIST CONVENTION
0.9%
27.7%
7.7%
23.1%
EPISCOPAL CHURCH
0.5%
1.2%
2.3%
1.6%
SEVENTH DAY ADVENTIST CHURCH
0.4%
0.6%
2.6%
1.9%
EVANGELICAL LUTHERAN CHURCH IN AMERICA
0.3%
0.2%
2.3%
0.9%
INTERNA PENTECO HOLINESS CHURCH
0.1%
0.4%
1.1%
0.6%
SALVATION ARMY
0.1%
0.4%
0.4%
0.3%
Weather
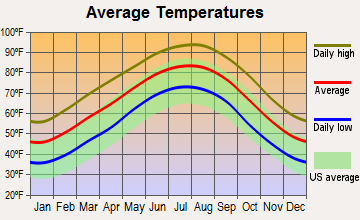
Weather in San Jose is much more predictable, characterized by hot, dry summers and mild, wet winters, typical of a Mediterranean climate. On the other hand, Shreveport has a humid subtropical climate with hot, humid summers and mild winters, and its location making it more prone to severe weather events such as hurricanes and tornadoes.
Weather and climate
Type
San Jose
Shreveport
Temperature - Average
60.9°F
65.5°F
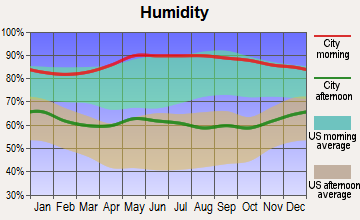
Humidity - Average morning or afternoon humidity
77.3%
78.3%
Humidity - Differences between morning and afternoon humidity
35.5%
36%
Humidity - Maximum monthly morning or afternoon humidity
87%
90%
Humidity - Minimum monthly morning or afternoon humidity
51.6%
54%
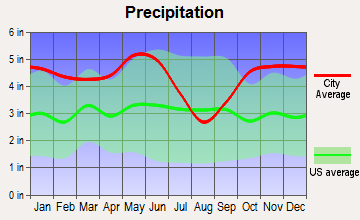
Precipitation - Yearly average
16.1 in
51.8 in
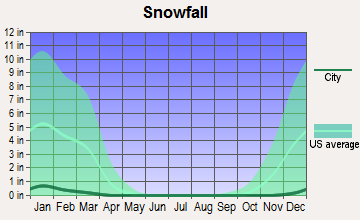
Snowfall - Yearly average
0 in
3 in
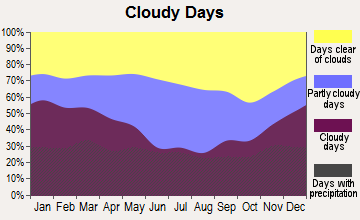
Clouds - Number of days clear of clouds
27.4%
19%
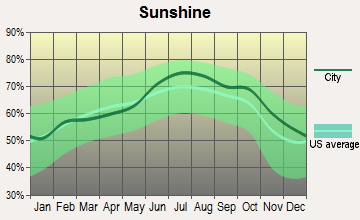
Sunshine amount - Average
73.8%
63.8%
Sunshine amount - Differences during a year
23%
25%
Sunshine amount - Maximum monthly
77.4%
70%
Sunshine amount - Minimum monthly
54.4%
45%
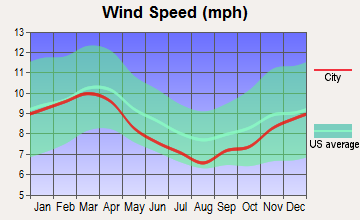
Wind speed - Average
10.3 mph
7.9 mph
Average climate in San Jose, California
Average climate in Shreveport, Louisiana
Air pollution
Type
AQI
CO
NO2
OZONE
PB
PM10
PM25
SO2
Year
San Jose
Shreveport
San Jose
San Jose
San Jose
Shreveport
San Jose
Shreveport
San Jose
Shreveport
San Jose
Shreveport
2018
94
64
0.49
N/A
14.5
N/A
22.2
25.7
0.006
N/A
18.5
N/A
12.5
6.5
0.2
0.8
2017
91
69
0.50
N/A
14.6
N/A
23.5
28.0
0.004
N/A
15.0
N/A
10.2
7.2
0.2
0.7
2016
69
66
0.47
N/A
13.7
N/A
22.4
27.4
0.003
N/A
17.4
N/A
8.8
9.0
0.2
1.5
2015
84
70
0.52
N/A
15.4
N/A
22.3
27.5
0.004
N/A
15.4
N/A
9.2
9.3
0.3
1.2
2014
83
69
0.40
N/A
13.9
N/A
21.5
27.1
0.004
N/A
15.3
N/A
8.2
9.8
0.2
1.1
2013
90
71
0.41
N/A
15.2
N/A
20.8
28.1
0.005
N/A
19.2
N/A
12.4
9.5
0.3
1.4
2012
74
72
0.35
N/A
13.3
N/A
21.8
28.7
0.003
N/A
21.4
N/A
10.1
8.5
0.3
N/A
2011
83
90
0.37
N/A
14.8
N/A
20.6
32.1
0.003
N/A
21.8
N/A
12.3
9.2
0.3
N/A
2010
88
88
0.35
N/A
14.4
N/A
20.4
30.5
0.004
N/A
20.3
N/A
9.0
9.2
0.4
N/A
2009
89
75
0.40
N/A
14.7
N/A
18.2
25.6
0.004
N/A
N/A
N/A
9.3
8.7
0.3
2.1
2008
100
72
0.45
N/A
16.7
N/A
20.6
26.1
N/A
N/A
N/A
N/A
12.6
9.5
N/A
2.3
2007
92
86
0.44
N/A
16.6
N/A
20.0
25.9
0.009
N/A
N/A
N/A
11.1
10.7
N/A
2.4
2006
100
91
0.46
N/A
18.0
N/A
21.8
29.7
N/A
N/A
N/A
N/A
11.1
10.9
N/A
2.7
2005
95
90
0.68
N/A
18.6
N/A
20.0
28.5
N/A
N/A
N/A
N/A
11.6
12.4
N/A
2.3
2004
98
81
0.63
N/A
18.5
N/A
20.4
24.7
N/A
N/A
N/A
N/A
9.9
10.3
N/A
2.5
2003
87
91
0.73
N/A
20.6
N/A
19.1
26.5
N/A
N/A
N/A
N/A
N/A
11.9
N/A
2.1
2002
78
80
0.65
N/A
19.5
N/A
18.0
25.8
0.006
N/A
N/A
N/A
N/A
10.0
N/A
1.3
2001
75
99
0.61
N/A
18.5
N/A
16.8
27.4
0.008
N/A
N/A
N/A
N/A
10.2
N/A
1.4
2000
65
98
0.66
N/A
18.9
N/A
15.6
27.9
0.009
N/A
N/A
N/A
N/A
10.7
N/A
1.1
Natural disasters
Type
San Jose
Shreveport
Tornado activity compared to U.S. average
9%
226.4%
Earthquake activity compared to U.S. average
7,785.3%
448.8%
Natural disasters compared to U.S. average
19%
18%
Transportation
San Jose has a comprehensive public transportation system, with multiple options for commuting, including buses and light rail. Shreveport’s public transportation is rather limited, with the SporTran bus system being the primary means of public transport.
Transport
Type
San Jose
Shreveport
Amtrak stations
1
1
Amtrak stations nearby
3
2
FAA registered aircraft
553
334
FAA registered aircraft manufacturers and dealers
13
2
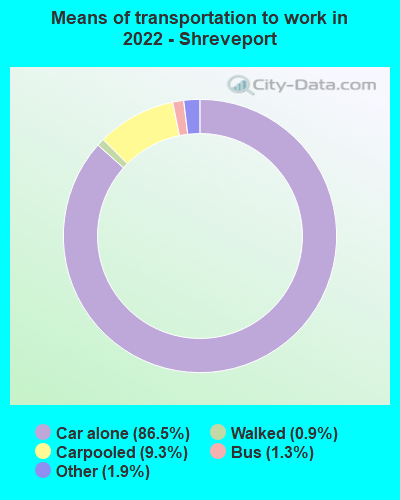
Means of transportation to work
Type
San Jose
Shreveport
Bicycle
1%
0.1%
Bus
1.1%
1.6%
Carpooled
11.4%
8.8%
Car alone
80.5%
87.4%
Motorcycle
0.2%
0.2%
Railroad
0.2%
0%
Subway
0.2%
0%
Taxicab
0%
0.2%
Walked
3.3%
0.7%
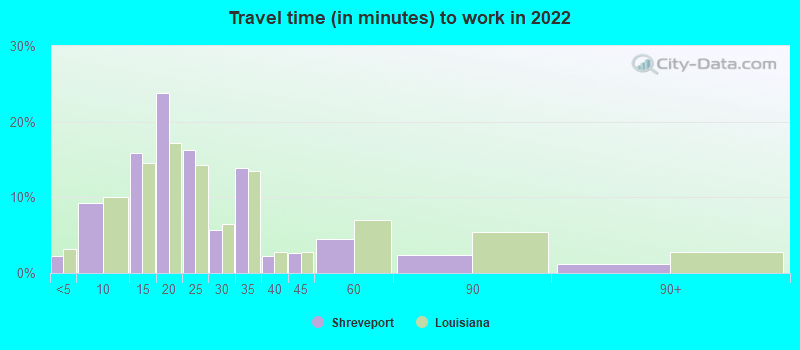
Average travel time to work
Type
San Jose
Shreveport
Average
29.2 min
26 min
Other means
27.9 min
19.5 min
Public transportation
48.5 min
40 min
Private vehicle occupancy
Type
San Jose
Shreveport
Average
1.2
1.1
Drove alone
87.3%
90.6%
In 2 person carpool
8.9%
7.5%
In 3 person carpool
1.9%
1.4%
In 4 person carpool
1.1%
0.2%
In 5-6 person carpool
0.6%
0.1%
In 7+ person carpool
0.2%
0.3%
How many people usually rode to work in the car, truck or van.
Real Estate
San Jose's real estate market is robust but expensive, with houses selling quickly and prices continuously rising. Shreveport the market is plenty slower, but houses are significantly more affordable.
Neighborhoods
San Jose offers a mix of suburban and urban neighborhoods to suit diverse preferences. Shreveport is noted for its historic neighborhoods known for their southern charm.
Houses and residents
Type
San Jose
Shreveport
Houses
340,561
90,211
Average household size (people)
3.1
2.4
Median year apartment built
1979
1975
Median year house/condo built
1973
1972
Length of stay in the house since moving in
15.6 years
14.7 years
Houses occupied
322,881 (94.8%)
76,167 (84.4%)
Houses occupied by owners
179,797 (55.7%)
40,664 (53.4%)
Houses occupied by renters
143,084 (44.3%)
35,503 (46.6%)
Median rent asked for vacant for-rent units
$3,214
$994.20
Median monthly housing costs
$2,463
$853
Median price asked for vacant for-sale houses and condos
$1,197,016
$46,043
Estimated median house or condo value
Over $1,000,000
$161,500
Median numbers of rooms
4.9
5.2
Median number of rooms in apartments
3.6
4.3
Median number of rooms in houses and condos
6
6.3
Median house price - detached houses
Over $1,000,000
$227,450
Median house price - in 2-unit structures
$753,788
$194,383
Median house price - in 3-to-4-unit structures
$680,453
$53,983
Median house price - in 5 or more unit structures
$688,625
$113,344
Median house price - mobile homes
$240,963
$70,748
Median house price - Townhouses or other attached units
$892,629
$167,641
Median house price - All housing units
Over $1,000,000
$222,391
Median house age
45
49
Renting percentage
41.5%
44.5%
Housing density (houses/condos per square mile)
1,947.6
874.6
House value disparities
21.2%
41.2%
Household income disparities
38.3%
49.7%
Median household income for houses/condes with a mortgage
$197,583
$74,880
Median household income for apartments without a mortgage
$103,711
$42,467
Housing units without a mortgage
2,632 (2.1%)
355 (1.5%)
Housing units with both a second mortgage and home equity loan
13,499 (10.6%)
677 (2.9%)
Housing units with a mortgage
124,224 (97.9%)
22,643 (98.5%)
Housing units with a home equity loan
346 (0.3%)
217 (0.9%)
Housing units with a second mortgage
16,249 (12.8%)
1,247 (5.4%)
House/condo owner moved in on average (years ago)
14
14
House/condo renter moved in on average (years ago)
3
2
Housing units lacking complete kitchen facilities
1.2%
4.1%
Housing units lacking complete plumbing facilities
0.6%
3.1%
Housing units in structures
Housing units in structures
San Jose
Shreveport
One, detached
50.9%
68.7%
One, attached
11.5%
2.7%
Two
1.1%
2.1%
3 or 4
5.0%
5.8%
5 to 9
5.1%
8.7%
10 to 19
4.5%
4.2%
20 to 49
4.5%
2.9%
50 or more
14.2%
2.9%
Mobile homes
3.1%
2.1%
Boats, RVs, vans, etc.
0.1%
0.0%
Median real estate property taxes paid for housing units
Self-employed workers in own not incorporated business
28,517
2,951
State government workers
10,222
5,454
Unpaid family workers
472
126
Industries and Occupations
In San Jose, the technology industry dominates, offering ample employment opportunities. Shreveport is home to a diverse range of occupations, with health care, retail, and entertainment being prevalent sectors.
San Jose offers access to numerous top-quality, high-ranked healthcare institutions. Shreveport, while having fewer healthcare facilities, is home to some regionally renowned health centers.
Health (county statistics)
Type
San Jose
Shreveport
General health status score of residents in this county from 1 (poor) to 5 (excellent)
San Jose displays the modern and efficient infrastructure expected of a technology hub. Shreveport has less infrastructure development, attributed partially to its smaller size and lower population density.
Infrastructure
Type
San Jose
Shreveport
Hospitals
20
45
TV stations
9
12
Arenas or stadiums
2
1
Bank branches located here
145
74
Bank institutions located here
25
18
Main business address for public companies
74
1
Drinking water stations with no reported violations in the past
21
1
Drinking water stations with reported violations in the past
HMDA - Conventional home purchase loans - Applications denied
Year
San Jose
Shreveport
1999
3,839
622
2000
2,577
651
2001
1,953
693
2002
1,908
398
2003
3,578
374
2004
5,489
441
2005
6,994
726
2006
6,324
822
2007
4,298
465
2008
2,419
203
2009
1,631
105
Culture and Food
San Jose boasts diverse cultures and cuisines driven by its multicultural population. Shreveport is well-known for its Southern hospitality, with a vibrant music scene and traditional Louisiana cuisine.
Sports Teams
San Jose residents enjoy sporting events from local teams such as the San Jose Sharks and San Jose Earthquakes. Shreveport, while lacking major league teams, is home to college football and minor league baseball teams.


 San Jose, CA
 Shreveport, LA