Relocating or visiting a new city requires comprehensive knowledge of your soon-to-be new environment. Two such cities that offer unique contrasting experiences are San Jose, California, and Tucson, Arizona. This comparison will dive into the different aspects of living or being a tourist in these two cities, including their crime rates, weather, cost of living, education systems, economic factors, infrastructure, main industries, major employers, real estate market, neighborhoods, transportation systems, tax systems, cultural and sports scenes, geographical conditions, and healthcare facilities.
Distance between
San Jose, CA and
Tucson, AZ : 713.6 miles
San Jose's population is larger by 81%. Its population has grown by 88,546 people (9.9%) since 2000. The population of Tucson has grown by 56,543 people (11.6%) during that time.
Overall, Tucson has a higher crime rate than San Jose. That being said, the crime rates vary from neighborhood to neighborhood in both cities, and as a potential resident or tourist, you should research specific neighborhoods when planning your travel or move. Violent crime, in particular, is higher in Tucson than in San Jose. San Jose police have implemented effective crime reduction strategies leading to a relatively safer city, particularly important if you have children.
City-data.com crime index counts serious crimes and violent crime more heavily. It adjusts for the number of visitors and daily workers commuting into cities. (higher means more crime, U.S. average = 301.1)
City-data.com crime index counts serious crimes and violent crime more heavily. It adjusts for the number of visitors and daily workers commuting into cities. (higher means more crime, U.S. average = 301.1)
Sex Offenders
According to our data, there are 1,806 registered sex offenders living in San Jose and 1,383 registered sex offenders living in . The ratio of residents to sex offenders in San Jose is 568 to 1; the ratio in Tucson is 384 to 1. The number of registered sex offenders compared to the number of residents is a smaller in San Jose than in Tucson.
Cost of Living
The cost of living in Tucson is significantly lower than in San Jose. San Jose, being in Silicon Valley, experiences high living costs, especially in housing. In Tucson, you'll find affordable housing, groceries, and services compared to the national average, making it an attractive option for people looking for a lower cost of living.
Income Tax
California imposes a state income tax, which can be quite high, with rates ranging from 1% to 13.3%. Arizona, however, has lower income tax rates, ranging from 2.59% to 4.5%.
Property Tax
Both states have property taxes, but Arizona's is lower. The typical homeowner in California spends around 0.73% of their home value on property taxes each year, while in Arizona, it's about 0.62%.
Sales Tax
San Jose, with California's high sales tax of 7.25%, combined with city taxes, can reach a rate of 9.125%. Tucson's combined sales tax is 8.7%, slightly lower than San Jose. It's important to factor in these costs when calculating your potential expenses.
Income
Type
San Jose
Tucson
Estimated median household income
$126,377
$50,306
Estimated per capita income
$57,357
$27,821
Cost of living index (U.S. average is 100)
127.4
90.1
If you make $50,000 in Tucson, you will have to make $70,699 in San Jose to maintain the same standard of living.
Geographical Conditions
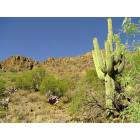
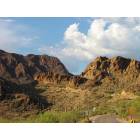
San Jose is located in Silicon Valley, with a flat topology and a lush green environment. Tucson, nestled in the Sonoran Desert, offers a scenic landscape of mountain ranges and desert flora.
San Jose offers numerous esteemed educational institutions such as San Jose State University and the University of California extension. Tucson is home to the University of Arizona, an internationally recognized research institution. Both cities are great for students and academics, with San Jose having a slight edge due to its proximity to other prestigious Californian universities.
San Jose holds a significant advantage economically, being an integral part of Silicon Valley, with many high-paying tech jobs. Tucson's economy relies mainly on the University of Arizona and Davis-Monthan Air Force Base. Job growth is faster in San Jose, but Tucson offers a range of opportunities in the education and defense sectors.
Biggest Employers
In San Jose, major employers include tech giants like Adobe, eBay, and Cisco Systems. In Tucson, the University of Arizona and Davis-Monthan Air Force Base are the largest employers, followed by the local government.
There were 299 building permits issued in San Jose in 2012 (216 more than in 2011) compared to 1,134 building permits issued in Tucson in 2012 (832 more than in 2011).
In San Jose (Santa Clara County), 70.0% voted for Democrats and 27.1% for Republicans in 2012 Presidential Election. In Tucson (Pima County), 52.7% voted for Democrats and 45.7% for Republicans.
Elections
Type
Democrats
Republicans
Other
Year
San Jose
Tucson
San Jose
Tucson
San Jose
Tucson
2020
72.7%
58.4%
25.2%
39.8%
2.1%
1.7%
2016
72.7%
53.3%
20.6%
39.7%
6.7%
7.0%
2012
70.0%
52.7%
27.1%
45.7%
2.9%
1.6%
2008
69.6%
52.4%
28.6%
46.3%
1.8%
1.4%
2004
64.3%
52.7%
34.8%
46.7%
0.9%
0.6%
2000
60.7%
51.4%
34.4%
43.3%
4.9%
5.3%
1996
56.9%
52.2%
32.2%
39.4%
11.0%
8.5%
Breakdown of population affiliated with a religious congregation
Type
Adherents
Congregations
Religion
San Jose
Tucson
San Jose
Tucson
CATHOLIC CHURCH
25.1%
20.8%
6.0%
7.9%
MUSLIM ESTIMATE
1.1%
0.0%
1.8%
0.2%
SOUTHERN BAPTIST CONVENTION
0.9%
2.3%
7.7%
10.4%
EPISCOPAL CHURCH
0.5%
0.8%
2.3%
1.4%
SEVENTH DAY ADVENTIST CHURCH
0.4%
0.3%
2.6%
1.9%
EVANGELICAL LUTHERAN CHURCH IN AMERICA
0.3%
0.9%
2.3%
2.5%
LUTHERAN CHURCH
0.2%
0.4%
1.4%
1.4%
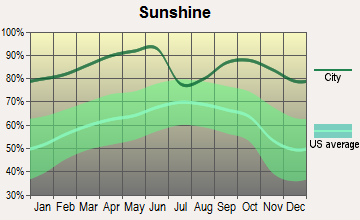
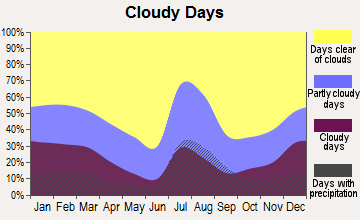
Weather
San Jose has a Mediterranean climate, with mild, wet winters and hot, dry summers. Tucson, however, is situated in a desert, experiencing hot summers with monsoons and mild, dry winters. The comfortable weather in San Jose is enjoyable for outdoor activities year-round, which is partly why it's a popular destination for tourists. Tucson's weather also allows for year-round outdoor activities but expect higher temperatures in the summer.
Weather and climate
Type
San Jose
Tucson
Temperature - Average
60.9°F
70°F
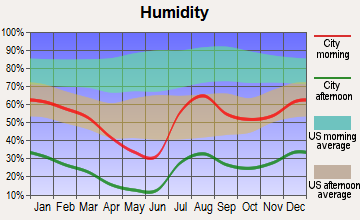
Humidity - Average morning or afternoon humidity
77.3%
38.6%
Humidity - Differences between morning and afternoon humidity
35.5%
46%
Humidity - Maximum monthly morning or afternoon humidity
87%
58%
Humidity - Minimum monthly morning or afternoon humidity
51.6%
12%
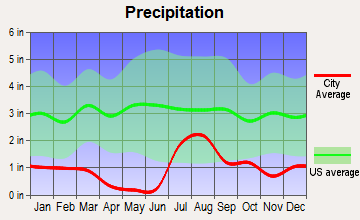
Precipitation - Yearly average
16.1 in
12 in
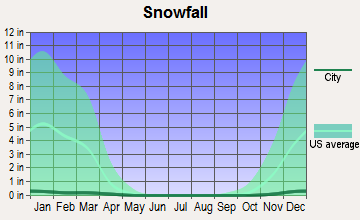
Snowfall - Yearly average
0 in
2 in
Clouds - Number of days clear of clouds
27.4%
32.3%
Sunshine amount - Average
73.8%
92.8%
Sunshine amount - Differences during a year
23%
15%
Sunshine amount - Maximum monthly
77.4%
94%
Sunshine amount - Minimum monthly
54.4%
79%
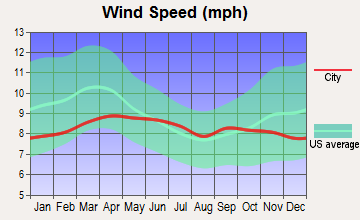
Wind speed - Average
10.3 mph
8.3 mph
Average climate in San Jose, California
Average climate in Tucson, Arizona
Air pollution
Type
AQI
CO
NO2
OZONE
PB
PM10
PM25
SO2
Year
San Jose
Tucson
San Jose
Tucson
San Jose
Tucson
San Jose
Tucson
San Jose
Tucson
San Jose
Tucson
San Jose
Tucson
2018
94
87
0.49
0.19
14.5
8.3
22.2
32.0
0.006
N/A
29.9
N/A
12.5
5.5
0.2
0.1
2017
91
73
0.50
0.18
14.6
8.4
23.5
31.7
0.004
N/A
32.2
N/A
10.2
7.1
0.2
0.1
2016
69
68
0.47
0.21
13.7
7.9
22.4
29.7
0.003
N/A
25.3
N/A
8.8
4.5
0.2
0.1
2015
84
62
0.52
0.21
15.4
8.7
22.3
29.7
0.004
N/A
25.4
N/A
9.2
5.1
0.3
0.2
2014
83
74
0.40
0.19
13.9
10.0
21.5
28.8
0.004
N/A
28.0
N/A
8.2
5.6
0.2
0.2
2013
90
94
0.41
0.17
15.2
10.4
20.8
30.4
0.005
N/A
30.9
N/A
12.4
6.8
0.3
0.2
2012
74
73
0.35
0.20
13.3
11.8
21.8
30.0
0.003
N/A
31.2
N/A
10.1
5.6
0.3
0.2
2011
83
81
0.37
0.22
14.8
11.9
20.6
31.0
0.003
N/A
29.7
N/A
12.3
5.8
0.3
0.3
2010
88
68
0.35
0.29
14.4
10.8
20.4
30.5
0.004
N/A
25.5
N/A
9.0
N/A
0.4
0.5
2009
89
82
0.40
0.25
14.7
11.2
18.2
29.2
0.004
N/A
31.9
N/A
9.3
N/A
0.3
0.5
2008
100
81
0.45
0.29
16.7
12.2
20.6
29.2
N/A
N/A
32.0
N/A
12.6
N/A
N/A
0.9
2007
92
75
0.44
0.37
16.6
13.4
20.0
28.7
0.009
N/A
27.3
N/A
11.1
N/A
N/A
0.9
2006
100
74
0.46
0.41
18.0
15.3
21.8
27.7
N/A
N/A
17.3
N/A
11.1
N/A
N/A
0.6
2005
95
76
0.68
0.43
18.6
15.1
20.0
26.0
N/A
N/A
17.8
N/A
11.6
N/A
N/A
0.7
2004
98
77
0.63
0.49
18.5
15.6
20.4
25.6
N/A
N/A
14.0
N/A
9.9
N/A
N/A
1.2
2003
87
81
0.73
0.57
20.6
17.2
19.1
27.1
N/A
N/A
19.2
N/A
N/A
N/A
N/A
1.2
2002
78
76
0.65
0.56
19.5
16.9
18.0
26.8
0.006
N/A
19.9
N/A
N/A
N/A
N/A
1.0
2001
75
70
0.61
0.55
18.5
16.4
16.8
26.1
0.008
N/A
23.2
N/A
N/A
N/A
N/A
0.8
2000
65
78
0.66
0.50
18.9
16.7
15.6
26.4
0.009
N/A
N/A
N/A
N/A
N/A
N/A
2.3
Natural disasters
Type
San Jose
Tucson
Tornado activity compared to U.S. average
9%
8.9%
Earthquake activity compared to U.S. average
7,785.3%
1,584.9%
Natural disasters compared to U.S. average
19%
13%
Transportation
San Jose boasts an extensive public transit system, including buses, light rail, and commuter trains, alongside bike lanes and pedestrian-friendly areas. Tucson's public transport primarily consists of buses and a modern streetcar system. Both cities have international airports, but commuting is easier in San Jose due to its robust public transit.
Transport
Type
San Jose
Tucson
Amtrak stations
1
1
Amtrak stations nearby
3
1
FAA registered aircraft
553
983
FAA registered aircraft manufacturers and dealers
13
14
Means of transportation to work
Type
San Jose
Tucson
Bicycle
1%
1%
Bus
1.1%
1.9%
Carpooled
11.4%
11.5%
Car alone
80.5%
81.9%
Motorcycle
0.2%
0.5%
Railroad
0.2%
0%
Subway
0.2%
0%
Walked
3.3%
2.3%
Average travel time to work
Type
San Jose
Tucson
Average
29.2 min
26 min
Other means
27.9 min
21.6 min
Public transportation
48.5 min
42.5 min
Private vehicle occupancy
Type
San Jose
Tucson
Average
1.2
1.2
Drove alone
87.3%
86.3%
In 2 person carpool
8.9%
10.1%
In 3 person carpool
1.9%
2.5%
In 4 person carpool
1.1%
1%
In 5-6 person carpool
0.6%
0.1%
In 7+ person carpool
0.2%
0.1%
How many people usually rode to work in the car, truck or van.
Real Estate
Real estate in San Jose is among the most expensive in the U.S, driven by the high demand from tech workers. Tucson's real estate is considerably more affordable, providing good value for money to buyers and renters alike.
Neighborhoods
San Jose offers a mix of upscale and suburban neighborhoods, each with its unique charm. Tucson also has diverse neighborhoods, from historic districts to new suburban developments, each with its distinct characteristics.
Houses and residents
Type
San Jose
Tucson
Houses
340,561
242,816
Average household size (people)
3.1
2.4
Median year apartment built
1979
1979
Median year house/condo built
1973
1978
Length of stay in the house since moving in
15.6 years
13.2 years
Houses occupied
322,881 (94.8%)
223,068 (91.9%)
Houses occupied by owners
179,797 (55.7%)
114,708 (51.4%)
Houses occupied by renters
143,084 (44.3%)
108,360 (48.6%)
Median rent asked for vacant for-rent units
$3,214
$801.80
Median monthly housing costs
$2,463
$951
Median price asked for vacant for-sale houses and condos
$1,197,016
$557,132
Estimated median house or condo value
Over $1,000,000
$224,800
Median numbers of rooms
4.9
4.9
Median number of rooms in apartments
3.6
4
Median number of rooms in houses and condos
6
5.8
Median house price - detached houses
Over $1,000,000
$262,219
Median house price - in 2-unit structures
$753,788
$147,793
Median house price - in 3-to-4-unit structures
$680,453
$125,313
Median house price - in 5 or more unit structures
$688,625
$135,055
Median house price - mobile homes
$240,963
$48,136
Median house price - occupied boats, rvs, vans etc.
$55,872
$53,411
Median house price - Townhouses or other attached units
$892,629
$210,375
Median house price - All housing units
Over $1,000,000
$234,849
Median house age
45
43
Renting percentage
41.5%
48.1%
Housing density (houses/condos per square mile)
1,947.6
1,247.3
House value disparities
21.2%
32.8%
Household income disparities
38.3%
44.9%
Median household income for houses/condes with a mortgage
$197,583
$76,356
Median household income for apartments without a mortgage
$103,711
$54,612
Housing units without a mortgage
2,632 (2.1%)
1,087 (1.5%)
Housing units with both a second mortgage and home equity loan
13,499 (10.6%)
2,785 (3.9%)
Housing units with a mortgage
124,224 (97.9%)
70,054 (98.5%)
Housing units with a home equity loan
346 (0.3%)
211 (0.3%)
Housing units with a second mortgage
16,249 (12.8%)
4,051 (5.7%)
House/condo owner moved in on average (years ago)
14
11
House/condo renter moved in on average (years ago)
3
1
Housing units lacking complete kitchen facilities
1.2%
1.2%
Housing units lacking complete plumbing facilities
0.6%
0.8%
Housing units in structures
Housing units in structures
San Jose
Tucson
One, detached
50.9%
53.5%
One, attached
11.5%
8.3%
Two
1.1%
2.5%
3 or 4
5.0%
4.3%
5 to 9
5.1%
5.0%
10 to 19
4.5%
5.6%
20 to 49
4.5%
5.8%
50 or more
14.2%
8.6%
Mobile homes
3.1%
6.2%
Boats, RVs, vans, etc.
0.1%
0.2%
Median real estate property taxes paid for housing units
Self-employed workers in own not incorporated business
28,517
14,487
State government workers
10,222
17,981
Unpaid family workers
472
709
Industries and Occupations
San Jose is a tech magnet, housing many prominent tech companies, making software engineering the main occupation. Tucson, however, has a mix of industries from education to aerospace and defense, which is reflected in its spread of occupations.
Both cities have some excellent healthcare facilities. San Jose has multiple highly-rated hospitals, including the Stanford Health Care. Tucson is home to the Banner University Medical Center, recognized nationally for multiple specialties.
Health (county statistics)
Type
San Jose
Tucson
General health status score of residents in this county from 1 (poor) to 5 (excellent)
San Jose possesses a comprehensive and modern infrastructure, suiting its status as a tech hub. Its roads, public facilities, and utilities are all well-developed. Tucson's infrastructure, while not on par with San Jose, is satisfactory and continually improving to suit its growing population.
Infrastructure
Type
San Jose
Tucson
Hospitals
20
24
TV stations
9
20
Arenas or stadiums
2
2
Bank branches located here
145
159
Bank institutions located here
25
17
Main business address for public companies
74
6
Drinking water stations with no reported violations in the past
21
0
Drinking water stations with reported violations in the past
HMDA - Conventional home purchase loans - Applications denied
Year
San Jose
Tucson
1999
3,839
3,131
2000
2,577
1,601
2001
1,953
912
2002
1,908
778
2003
3,578
1,409
2004
5,489
2,041
2005
6,994
2,872
2006
6,324
2,833
2007
4,298
1,601
2008
2,419
714
2009
1,631
386
Culture and Food
San Jose boasts a diverse cultural backdrop with numerous museums, art galleries, and theaters, not to mention its rich culinary scene featuring cuisines from all over the globe. Tucson, a UNESCO City of Gastronomy, revels in its vibrant food culture with traditional Mexican and innovative fusion cuisines.
Sports Teams
Sports enthusiasts will enjoy San Jose, home to the NHL's San Jose Sharks and the MLS’s San Jose Earthquakes. Tucson doesn't host any major league sports but has a massive following for the University of Arizona Wildcats.


 San Jose, CA
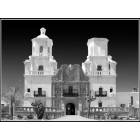
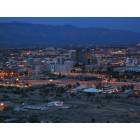
 Tucson, AZ