San Jose, California's third-largest city, is known for its thriving tech scene, high standard of living, and beautiful climate. Upper San Gabriel Valley is a more suburban region within Los Angeles County, notable for its natural beauty, cultural diversity, and easy access to Los Angeles. These two areas offer very different lifestyles, but both present unique advantages and challenges that make them attractive to potential residents and tourists.
San Jose is relatively safe for such a large city, with a crime rate below the national average. It's essential, however, to keep in mind that crime rates can vary between neighborhoods. The Upper San Gabriel Valley's crime rate is generally lower than the Los Angeles County average, but pockets of higher crime do exist. As always, prospective residents should research individual neighborhoods before moving.
Cost of Living
The cost of living in both San Jose and the Upper San Gabriel Valley is high, as one would expect for California. However, San Jose, in part due to its centrality to the tech industry, tends to have a notably higher cost of living, particularly when it comes to housing.
Income Tax
Both San Jose and the Upper San Gabriel Valley residents pay California state income tax, which is quite high compared to other states. This tax is progressive, with rates ranging from 1% to 13.3% based on income level.
Property Tax
Property taxes in San Jose and the Upper San Gabriel Valley are as per California state policy. The tax rate is 1% of the property's assessed value, plus local voter-approved rates.
Sales Tax
The sales tax in San Jose is 9.25%, while the Upper San Gabriel Valley's sales tax can range from 9.5% to 10.25%, making it slightly higher.
Income
Type
San Jose
Upper San Gabriel Valley
Estimated median household income
$126,377
$80,436
Estimated per capita income
$57,357
$33,562
Cost of living index (U.S. average is 100)
127.4
159.5
If you make $50,000 in San Jose, you will have to make $62,598 in Upper San Gabriel Valley to maintain the same standard of living.
Geographical Conditions
San Jose is located in the Santa Clara Valley, surrounded by mountains, and close to the sea. The Upper San Gabriel Valley is also mountainous, with the San Gabriel Mountains to the north, providing numerous outdoor recreation opportunities.
Geographical information
Type
San Jose
Upper San Gabriel Valley
Land area
174.9 sq. miles
49.4 sq. miles
Population density
5,624.3 people per sq. mile
6,624.2 people per sq. mile
Relative area comparison
San Jose, CA Upper San Gabriel Valley, CA
Education
San Jose is home to numerous high-ranking public and private schools, as well as several universities, including the prestigious San José State University. The Upper San Gabriel Valley also offers quality education but is known more for its diversity of language programs and for schools like Mt. San Antonio College and the University of the West.
The economy of San Jose is centered around high-tech industries and services with many opportunities for high-paying jobs in the tech sector. In contrast, the Upper San Gabriel Valley is less focused on tech and more on healthcare, retail trade, and education.
Biggest Employers
In San Jose, some of the biggest employers are tech giants like IBM and Apple. In contrast, the Upper San Gabriel Valley has major employers such as the City of Hope National Medical Center and Los Angeles County Department of Children and Family Services.
In San Jose (Santa Clara County), 70.0% voted for Democrats and 27.1% for Republicans in 2012 Presidential Election. In Upper San Gabriel Valley (Los Angeles County), 69.7% voted for Democrats and 27.8% for Republicans.
Elections
Type
Democrats
Republicans
Other
Year
San Jose
Upper San Gabriel Valley
San Jose
Upper San Gabriel Valley
San Jose
Upper San Gabriel Valley
2020
72.7%
71.0%
25.2%
26.9%
2.1%
2.1%
2016
72.7%
72.0%
20.6%
22.5%
6.7%
5.5%
2012
70.0%
69.7%
27.1%
27.8%
2.9%
2.4%
2008
69.6%
69.2%
28.6%
28.8%
1.8%
1.9%
2004
64.3%
63.3%
34.8%
35.7%
0.9%
1.0%
2000
60.7%
63.6%
34.4%
32.4%
4.9%
4.0%
1996
56.9%
59.3%
32.2%
31.0%
11.0%
9.7%
Breakdown of population affiliated with a religious congregation
Type
Adherents
Congregations
Religion
San Jose
Upper San Gabriel Valley
San Jose
Upper San Gabriel Valley
CATHOLIC CHURCH
25.1%
36.1%
6.0%
4.7%
MUSLIM ESTIMATE
1.1%
0.7%
1.8%
1.0%
SOUTHERN BAPTIST CONVENTION
0.9%
1.0%
7.7%
9.0%
EPISCOPAL CHURCH
0.5%
0.4%
2.3%
1.4%
SEVENTH DAY ADVENTIST CHURCH
0.4%
0.5%
2.6%
2.4%
EVANGELICAL LUTHERAN CHURCH IN AMERICA
0.3%
0.2%
2.3%
1.9%
AMERICAN BAPTIST CHURCHES IN THE USA
0.1%
0.5%
1.1%
3.1%
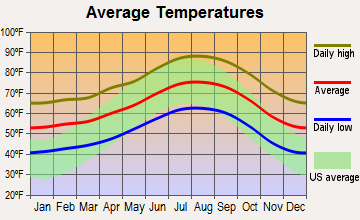
Weather
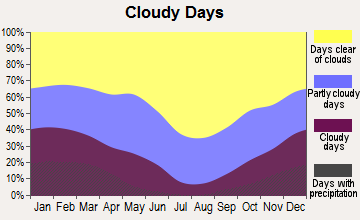
San Jose boasts a Mediterranean climate, with mild, wet winters and warm, dry summers that much of California is known for. Upper San Gabriel Valley has a similar climate but can often experience slightly higher summer temperatures due to its inland location.
Weather and climate
Type
San Jose
Upper San Gabriel Valley
Temperature - Average
60.9°F
63.5°F
Humidity - Average morning or afternoon humidity
77.3%
62.2%
Humidity - Differences between morning and afternoon humidity
35.5%
17.3%
Humidity - Maximum monthly morning or afternoon humidity
87%
67%
Humidity - Minimum monthly morning or afternoon humidity
51.6%
49.7%
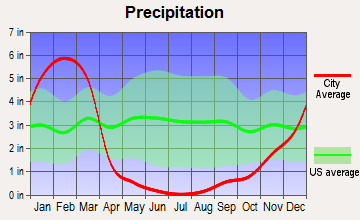
Precipitation - Yearly average
16.1 in
24.3 in
Snowfall - Yearly average
0 in
0 in
Clouds - Number of days clear of clouds
27.4%
29.4%
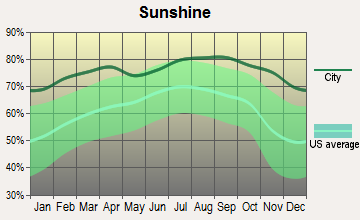
Sunshine amount - Average
73.8%
78.4%
Sunshine amount - Differences during a year
23%
22%
Sunshine amount - Maximum monthly
77.4%
85%
Sunshine amount - Minimum monthly
54.4%
63%
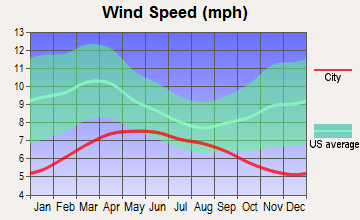
Wind speed - Average
10.3 mph
2.6 mph
Average climate in San Jose, California
Average climate in Upper San Gabriel Valley, California
Air pollution
Type
AQI
CO
NO2
OZONE
PB
PM10
PM25
SO2
Year
San Jose
Upper San Gabriel Valley
San Jose
Upper San Gabriel Valley
San Jose
Upper San Gabriel Valley
San Jose
Upper San Gabriel Valley
San Jose
Upper San Gabriel Valley
Upper San Gabriel Valley
San Jose
Upper San Gabriel Valley
San Jose
Upper San Gabriel Valley
2018
94
142
0.49
0.37
14.5
14.2
22.2
28.5
0.006
0.007
28.5
N/A
12.5
14.1
0.2
0.4
2017
91
146
0.50
0.36
14.6
15.1
23.5
29.8
0.004
0.007
31.2
N/A
10.2
14.0
0.2
0.5
2016
69
136
0.47
0.33
13.7
15.5
22.4
28.1
0.003
0.007
28.6
N/A
8.8
13.0
0.2
0.4
2015
84
143
0.52
0.33
15.4
15.2
22.3
28.4
0.004
0.007
28.4
N/A
9.2
15.2
0.3
0.3
2014
83
141
0.40
0.35
13.9
16.7
21.5
28.0
0.004
0.007
31.3
N/A
8.2
14.9
0.2
0.5
2013
90
144
0.41
0.39
15.2
17.3
20.8
26.6
0.005
0.007
29.3
N/A
12.4
14.4
0.3
0.4
2012
74
148
0.35
0.43
13.3
18.2
21.8
25.9
0.003
0.006
28.7
N/A
10.1
16.5
0.3
0.5
2011
83
146
0.37
0.47
14.8
19.1
20.6
24.8
0.003
0.008
28.9
N/A
12.3
17.6
0.3
0.5
2010
88
133
0.35
0.48
14.4
19.2
20.4
24.6
0.004
0.011
27.0
N/A
9.0
15.5
0.4
0.5
2009
89
153
0.40
0.39
14.7
21.0
18.2
25.4
0.004
0.011
32.0
N/A
9.3
17.2
0.3
0.4
2008
100
155
0.45
0.54
16.7
23.1
20.6
24.9
N/A
0.013
32.1
N/A
12.6
16.9
N/A
0.6
2007
92
135
0.44
0.55
16.6
24.6
20.0
23.1
0.009
0.016
N/A
N/A
11.1
N/A
N/A
1.0
2006
100
128
0.46
0.58
18.0
24.9
21.8
22.8
N/A
0.009
N/A
N/A
11.1
N/A
N/A
1.5
2005
95
128
0.68
0.61
18.6
25.4
20.0
21.3
N/A
0.015
N/A
N/A
11.6
N/A
N/A
1.7
2004
98
134
0.63
0.71
18.5
26.0
20.4
23.8
N/A
0.018
N/A
N/A
9.9
N/A
N/A
2.4
2003
87
143
0.73
0.89
20.6
30.7
19.1
23.3
N/A
0.025
N/A
N/A
N/A
N/A
N/A
1.6
2002
78
137
0.65
0.91
19.5
32.5
18.0
21.9
0.006
0.022
N/A
N/A
N/A
N/A
N/A
2.2
2001
75
143
0.61
1.04
18.5
33.1
16.8
20.1
0.008
0.031
N/A
N/A
N/A
N/A
N/A
2.3
2000
65
151
0.66
1.07
18.9
33.5
15.6
20.1
0.009
0.028
N/A
N/A
N/A
N/A
N/A
1.3
Natural disasters
Type
San Jose
Upper San Gabriel Valley
Tornado activity compared to U.S. average
9%
18%
Earthquake activity compared to U.S. average
7,785.3%
7,264.5%
Natural disasters compared to U.S. average
19%
57%
Transportation
San Jose has extensive public transit options, such as buses, light rail, and a system of commuter trains. In contrast, the Upper San Gabriel Valley relies more on private cars, though it does still have public bus lines and is served by Los Angeles Metro's Gold Line light rail.
Transport
Type
San Jose
Upper San Gabriel Valley
Amtrak stations
1
0
Amtrak stations nearby
3
3
FAA registered aircraft
553
0
FAA registered aircraft manufacturers and dealers
13
0
Means of transportation to work
Type
San Jose
Upper San Gabriel Valley
Bicycle
1%
1.1%
Bus
1.1%
3.9%
Carpooled
11.4%
16.6%
Car alone
80.5%
71.1%
Motorcycle
0.2%
0.1%
Railroad
0.2%
0.1%
Subway
0.2%
0%
Taxicab
0%
0.1%
Walked
3.3%
3.2%
Average travel time to work
Type
San Jose
Upper San Gabriel Valley
Average
29.2 min
29.1 min
Real Estate
The real estate market in San Jose is notably competitive, with a median home price considerably above the national average. The market in the Upper San Gabriel Valley is less competitive, but prices still remain relatively high due to proximity to Los Angeles.
Neighborhoods
Both San Jose and the Upper San Gabriel Valley have diverse neighborhoods, ranging from urban centers to quieter suburban areas. San Jose has some particularly desired neighborhoods like Willow Glen and Silver Creek, while the Upper San Gabriel Valley is known for communities like Arcadia and Walnut.
Houses and residents
Type
San Jose
Upper San Gabriel Valley
Houses
340,561
99,295
Average household size (people)
3.1
3.3
Houses occupied
322,881 (94.8%)
96,186 (96.9%)
Houses occupied by owners
179,797 (55.7%)
52,398 (54.5%)
Houses occupied by renters
143,084 (44.3%)
43,788 (45.5%)
Median rent asked for vacant for-rent units
$3,214
$1,771
Median price asked for vacant for-sale houses and condos
$1,197,016
$1,138,428
Estimated median house or condo value
Over $1,000,000
$740,686
Median number of rooms in apartments
3.6
3.7
Median number of rooms in houses and condos
6
5.9
Renting percentage
41.5%
44.9%
Housing density (houses/condos per square mile)
1,947.6
2,008.8
Household income disparities
38.3%
44%
Housing units without a mortgage
2,632 (2.1%)
11,525 (24.8%)
Housing units with both a second mortgage and home equity loan
13,499 (10.6%)
137 (0.3%)
Housing units with a mortgage
124,224 (97.9%)
34,867 (75.2%)
Housing units with a home equity loan
346 (0.3%)
3,133 (6.8%)
Housing units with a second mortgage
16,249 (12.8%)
4,036 (8.7%)
Housing units lacking complete kitchen facilities
1.2%
1.5%
Housing units lacking complete plumbing facilities
Self-employed workers in own not incorporated business
28,517
10,209
State government workers
10,222
3,180
Unpaid family workers
472
401
Industries and Occupations
The main industries in San Jose include technology, services, and manufacturing, with many inhabitants working in tech and managerial roles. The industries in the Upper San Gabriel Valley are more varied, including healthcare, retail, and education, leading to a more diverse range of occupations.
Both regions offer high-quality healthcare systems. San Jose's health care shines with Stanford Health Care and the Santa Clara Valley Medical Center. The Upper San Gabriel Valley holds its own, offering excellent care facilities like the City of Hope National Medical Center.
Health (county statistics)
Type
San Jose
Upper San Gabriel Valley
General health status score of residents in this county from 1 (poor) to 5 (excellent)
San Jose's infrastructure is more developed, with an extensive network of roads and public transportation. However, the city also suffers from some traffic congestion. The Upper San Gabriel Valley is less densely populated and has less urban infrastructure, but also less congestion.
Infrastructure
Type
San Jose
Upper San Gabriel Valley
TV stations
9
27
Culture and Food
San Jose boasts a rich cultural life and a vibrant food scene, with the influences of Silicon Valley bringing a global flavor. Comparatively, the Upper San Gabriel Valley hosts a large Asian-American population, resulting in a diverse food scene with some of the best Asian cuisine in the U.S.
Sports Teams
Sports enthusiasts have plenty to enjoy in San Jose, home to teams like the San Jose Sharks (NHL) and the San Jose Earthquakes (MLS). The Upper San Gabriel Valley doesn't directly host major sports teams, but has easy access to Los Angeles' sports scene.
 San Jose, CA
 Upper San Gabriel Valley, CA