Santa Ana and Garden Grove are two neighboring cities located in Orange County, California. While they are located near each other, each city has its unique character and culture, appealing to different groups of individuals. The following comparison between Santa Ana and Garden Grove will cover multiple aspects, including crime and safety, weather, cost of living, education, and more, providing an in-depth look for those considering moving or even just a visit.
Distance between
Santa Ana, CA and
Garden Grove, CA : 5.2 miles
Santa Ana's population is larger by 82%. Its population has decreased by 28,536 people (8.4%) since 2000. The population of Garden Grove has grown by 5,292 people (3.2%) during that time.
While crime rates are a concern in many urban areas, these two cities represent different types of environments. Santa Ana tends to have higher crime rates than the national average, which may be a concern for potential residents or visitors. On the other hand, Garden Grove tends to have lower crime rates than the national average, making it a safer city in comparison. However, both cities have been working diligently to improve safety conditions with the aid of local law enforcement and community organizations.
City-data.com crime index counts serious crimes and violent crime more heavily. It adjusts for the number of visitors and daily workers commuting into cities. (higher means more crime, U.S. average = 301.1)
City-data.com crime index counts serious crimes and violent crime more heavily. It adjusts for the number of visitors and daily workers commuting into cities. (higher means more crime, U.S. average = 301.1)
Sex Offenders
According to our data, there are 415 registered sex offenders living in Santa Ana and 130 registered sex offenders living in . The ratio of residents to sex offenders in Santa Ana is 805 to 1; the ratio in Garden Grove is 1,345 to 1. The number of registered sex offenders compared to the number of residents is larger in Santa Ana than in Garden Grove.
Cost of Living
The cost of living in Santa Ana is generally higher than in Garden Grove. This difference primarily reflects the higher average house prices and rental rates in Santa Ana. However, Garden Grove also has some high-end areas where the cost of living can be higher than in some parts of Santa Ana. When considering the overall cost of living, it’s important to look at the comprehensive picture including housing, groceries, utilities, transportation, and healthcare.
Income Tax
California has a state income tax, which applies to residents in both Santa Ana and Garden Grove. The income tax rate varies from 1% to 13.3% based on a taxpayer’s income level. Neither city imposes a local income tax.
Property Tax
Property taxes can vary depending on the county and city, but on average, both Santa Ana and Garden Grove property owners pay around 0.72% of the property's assessed fair market value. This rate can change based on voter-approved bond initiatives.
Sales Tax
Both Santa Ana and Garden Grove have the same sales tax rate because they are in the same county. The combined rate is 7.75%, which includes the California state sales tax of 6%, a 0.50% county sales tax and a 1.25% special rate.
Income
Type
Santa Ana
Garden Grove
Estimated median household income
$80,265
$74,109
Estimated per capita income
$26,691
$28,109
Cost of living index (U.S. average is 100)
88.6
89.5
If you make $50,000 in Santa Ana, you will have to make $50,508 in Garden Grove to maintain the same standard of living.
Geographical Conditions
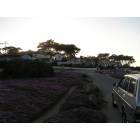
Both Santa Ana and Garden Grove are relatively flat cities in the Orange County coastal plain. Santa Ana is slightly inland and closer to the Santa Ana mountains, while Garden Grove is nearer to the coast. Both cities benefit from their Southern California location, known for its beautiful ocean beaches and picturesque landscapes.
Both Santa Ana and Garden Grove are served by their respective school districts, offering a range of elementary, middle, and high schools. While both cities offer public and private education options, Santa Ana has a larger number of private institutions. Furthermore, Santa Ana hosts Santa Ana College and is nearby to the University of California, Irvine, providing more advanced education opportunities.
Both Santa Ana and Garden Grove have diverse economies, with a range of job opportunities. Santa Ana, being the larger city, has more job opportunities, notably in retail, healthcare, and education. Garden Grove, on the other hand, boasts a robust economy dominated by healthcare, retail, and manufacturing. Thus, either city could be a good choice depending on your career preferences.
Biggest Employers
In Santa Ana, the County of Orange and Santa Ana Unified School District are the largest employers. Other major employers include Ingram Micro and Freedom Communications. In Garden Grove, the biggest employers are Air Industries Corp, Prime Healthcare Services, and the Garden Grove Unified School District.
There were 231 building permits issued in Santa Ana in 2012 (189 more than in 2011) compared to 274 building permits issued in Garden Grove in 2012 (243 more than in 2011).
Weather
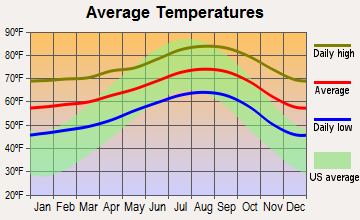
As both cities are located in Southern California, they have similar weather. Both cities enjoy mild, wet winters and hot, dry summers, characterized by a Mediterranean climate. Santa Ana often experiences the "Santa Ana Winds," which blow hot and dry across the region. These winds may result in higher temperatures in Santa Ana compared to Garden Grove.
Weather and climate
Type
Santa Ana
Garden Grove
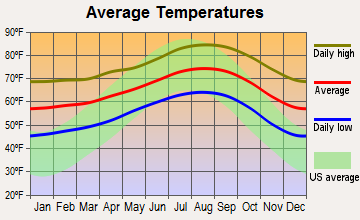
Temperature - Average
65.4°F
65.3°F
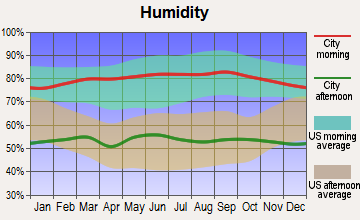
Humidity - Average morning or afternoon humidity
69.9%
70.2%
Humidity - Differences between morning and afternoon humidity
26.2%
26.7%
Humidity - Maximum monthly morning or afternoon humidity
78.3%
78.7%
Humidity - Minimum monthly morning or afternoon humidity
52%
52%
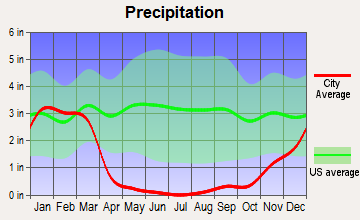
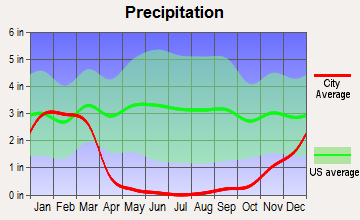
Precipitation - Yearly average
13.8 in
13 in
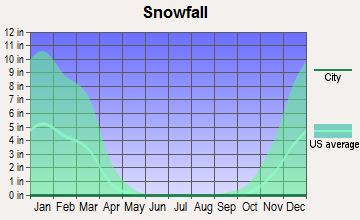
Snowfall - Yearly average
0 in
0 in
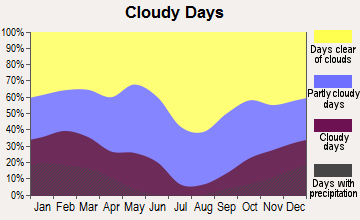
Clouds - Number of days clear of clouds
26.5%
26.5%
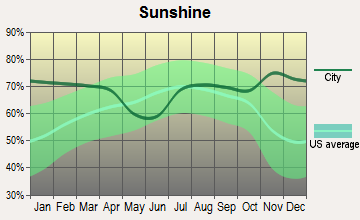
Sunshine amount - Average
78.4%
78.4%
Sunshine amount - Differences during a year
21.9%
22%
Sunshine amount - Maximum monthly
84.8%
84.9%
Sunshine amount - Minimum monthly
62.9%
63%
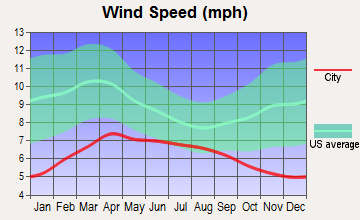
Wind speed - Average
5.9 mph
6 mph
Average climate in Santa Ana, California
Average climate in Garden Grove, California
Air pollution
Type
AQI
CO
NO2
OZONE
PB
PM10
PM25
SO2
Year
Santa Ana
Garden Grove
Santa Ana
Garden Grove
Santa Ana
Garden Grove
Santa Ana
Garden Grove
Santa Ana
Garden Grove
Santa Ana
Garden Grove
Santa Ana
Garden Grove
Santa Ana
Garden Grove
2018
124
132
0.34
0.36
14.2
14.0
27.0
26.6
N/A
0.007
27.5
27.5
12.3
12.2
0.7
0.7
2017
129
139
0.35
0.43
13.9
14.6
29.1
27.3
N/A
0.007
26.7
26.7
13.6
13.5
0.5
0.5
2016
107
113
0.35
0.47
12.6
14.2
29.2
27.1
N/A
0.007
24.1
24.1
12.7
12.8
0.2
0.3
2015
128
128
0.32
0.40
13.4
14.6
29.6
27.2
N/A
0.007
25.0
25.0
14.7
14.7
0.2
0.3
2014
127
127
0.29
0.36
13.2
14.8
28.6
27.0
N/A
0.008
26.7
26.7
15.9
16.1
0.4
0.5
2013
123
123
0.34
0.42
13.9
15.3
27.6
26.0
0.003
0.005
28.8
28.6
14.0
13.9
0.3
0.4
2012
115
116
0.31
0.41
12.9
14.6
26.7
25.4
0.004
0.004
27.5
27.3
14.5
14.6
0.1
0.2
2011
118
119
0.31
0.39
14.8
16.2
27.1
26.3
0.006
0.006
27.5
27.5
15.9
15.9
0.7
0.7
2010
107
108
0.34
0.41
14.4
16.5
26.5
25.5
0.011
0.010
23.5
23.5
14.6
14.7
0.6
0.6
2009
133
135
0.35
0.40
16.0
17.9
27.7
26.2
0.010
0.010
24.4
24.4
14.9
15.1
1.1
1.1
2008
138
143
0.38
0.41
17.1
19.7
28.2
26.6
0.010
0.010
30.1
30.3
21.6
21.6
1.1
1.1
2007
121
125
0.36
0.40
17.0
19.2
27.1
26.0
0.012
0.012
N/A
N/A
N/A
N/A
0.8
0.8
2006
120
122
0.40
0.45
17.7
19.5
26.6
26.0
0.007
0.007
N/A
N/A
N/A
N/A
1.3
1.3
2005
119
121
0.40
0.46
18.2
20.7
28.3
28.6
0.013
0.013
N/A
N/A
N/A
N/A
1.3
1.3
2004
128
129
0.50
0.54
19.4
20.9
31.2
32.8
0.014
0.014
N/A
N/A
N/A
N/A
1.6
1.6
2003
139
139
0.64
0.69
22.3
24.2
28.3
24.7
0.029
0.029
N/A
N/A
N/A
N/A
1.1
1.1
2002
122
124
0.66
0.75
22.3
24.5
25.1
22.6
0.019
0.019
N/A
N/A
N/A
N/A
1.7
1.9
2001
120
134
0.76
0.87
22.6
26.2
25.1
23.3
0.036
0.033
N/A
N/A
N/A
N/A
1.5
1.6
2000
127
140
0.80
0.82
25.7
28.8
23.7
22.5
0.028
0.027
N/A
N/A
N/A
N/A
1.9
1.9
Natural disasters
Type
Santa Ana
Garden Grove
Tornado activity compared to U.S. average
19.1%
19.1%
Earthquake activity compared to U.S. average
6,931.4%
6,940.9%
Natural disasters compared to U.S. average
32%
32%
Transportation
Public transportation in both cities is provided largely by the Orange County Transportation Authority (OCTA). Santa Ana has more public transit options due to its size including a train station. Both cities are also served by multiple freeways, making commuting by car feasible, though traffic can be substantial during peak hours.
Transport
Type
Santa Ana
Garden Grove
Amtrak stations
1
0
Amtrak stations nearby
3
3
FAA registered aircraft
150
28
FAA registered aircraft manufacturers and dealers
15
1
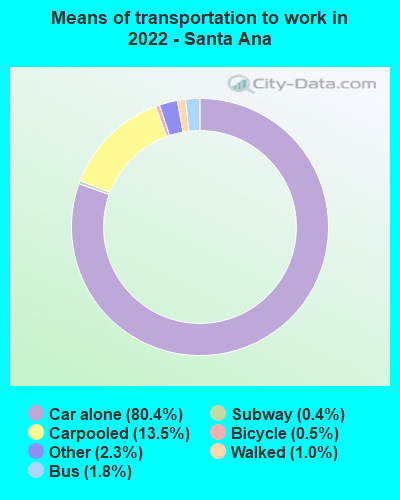
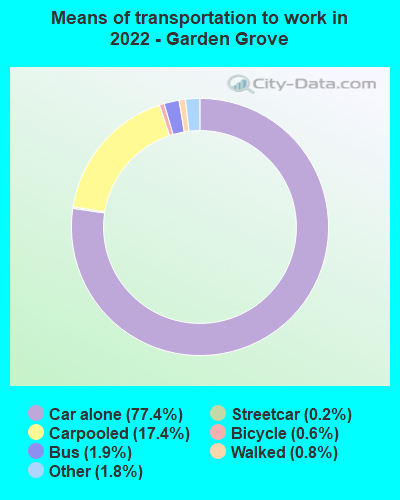
Means of transportation to work
Type
Santa Ana
Garden Grove
Bicycle
0.2%
0.4%
Bus
0.9%
1.6%
Carpooled
12%
12.7%
Car alone
83.6%
81.9%
Motorcycle
0.1%
0.2%
Walked
1.4%
1.7%
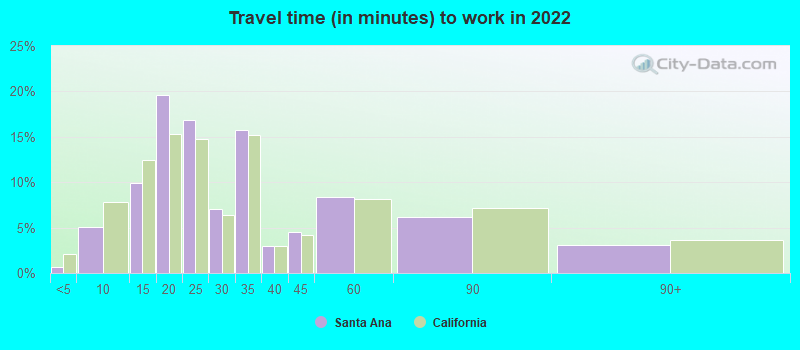
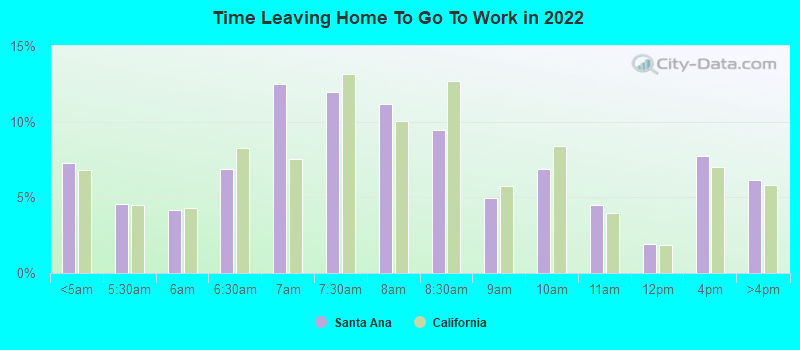
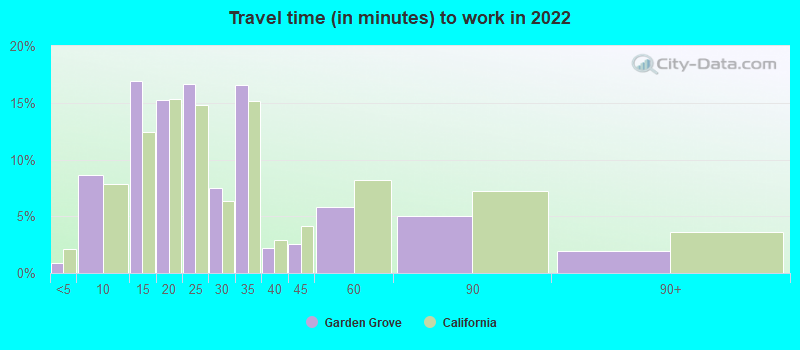
Average travel time to work
Type
Santa Ana
Garden Grove
Average
30.4 min
28.5 min
Other means
25.5 min
27.8 min
Public transportation
48.1 min
50.2 min
Private vehicle occupancy
Type
Santa Ana
Garden Grove
Average
1.2
1.2
Drove alone
84.6%
86%
In 2 person carpool
11.7%
10.3%
In 3 person carpool
2.7%
2.2%
In 4 person carpool
0.6%
0.3%
In 5-6 person carpool
0.4%
0.9%
In 7+ person carpool
0%
0.3%
How many people usually rode to work in the car, truck or van.
Real Estate
The real estate market in both cities is dynamic, influenced by their location in the high-demand Orange County area. Santa Ana, given its larger size and higher population, has a broader real estate market range, from affordable neighborhoods to high-end housing areas. In contrast, Garden Grove offers a comparatively more affordable and less competitive housing market.
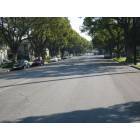
Neighborhoods
Santa Ana has a mix of historic and newer neighborhoods, with homes representing a wide range of architectural styles. Garden Grove, on the other hand, is known for its quiet, family-friendly neighborhoods and an abundance of single-family homes. Each city has its unique flair, with Santa Ana being vibrant and diverse and Garden Grove offering a more suburban feel.
Houses and residents
Type
Santa Ana
Garden Grove
Houses
80,604
50,253
Average household size (people)
4.4
3.7
Median year apartment built
1974
1970
Median year house/condo built
1962
1961
Length of stay in the house since moving in
15.9 years
16.5 years
Houses occupied
78,674 (97.6%)
48,769 (97%)
Houses occupied by owners
35,317 (44.9%)
26,624 (54.6%)
Houses occupied by renters
43,357 (55.1%)
22,145 (45.4%)
Median rent asked for vacant for-rent units
$1,407
$2,029
Median monthly housing costs
$1,836
$1,702
Median price asked for vacant for-sale houses and condos
$976,981
$496,512
Estimated median house or condo value
$623,000
$663,900
Median numbers of rooms
4.5
5
Median number of rooms in apartments
3.9
4.1
Median number of rooms in houses and condos
5.6
5.7
Median house price - detached houses
$724,856
$693,972
Median house price - in 2-unit structures
$512,474
Over $1,000,000
Median house price - in 3-to-4-unit structures
$351,406
$495,714
Median house price - in 5 or more unit structures
$406,926
$533,738
Median house price - mobile homes
$125,004
$58,441
Median house price - Townhouses or other attached units
$492,339
$481,658
Median house price - All housing units
$648,392
$651,210
Median house age
53
56
Renting percentage
52.5%
43%
Housing density (houses/condos per square mile)
2,969.6
2,788.1
House value disparities
21.7%
16.7%
Household income disparities
40.4%
44.4%
Median household income for houses/condes with a mortgage
$120,617
$108,920
Median household income for apartments without a mortgage
$74,449
$76,436
Housing units without a mortgage
318 (1.2%)
830 (4.9%)
Housing units with both a second mortgage and home equity loan
1,175 (4.6%)
699 (4.1%)
Housing units with a mortgage
25,378 (98.8%)
16,271 (95.1%)
Housing units with a home equity loan
23 (0.1%)
0 (0%)
Housing units with a second mortgage
1,438 (5.6%)
1,046 (6.1%)
House/condo owner moved in on average (years ago)
14
18
House/condo renter moved in on average (years ago)
5
4
Housing units lacking complete kitchen facilities
3.3%
3.5%
Housing units in structures
Housing units in structures
Santa Ana
Garden Grove
One, detached
46.4%
55.0%
One, attached
5.8%
8.9%
Two
3.6%
2.3%
3 or 4
7.3%
5.2%
5 to 9
5.7%
6.7%
10 to 19
8.8%
4.2%
20 to 49
6.3%
5.0%
50 or more
11.0%
9.6%
Mobile homes
4.9%
3.0%
Boats, RVs, vans, etc.
0.0%
0.1%
Median real estate property taxes paid for housing units
Self-employed workers in own not incorporated business
13,591
6,209
State government workers
3,716
2,416
Unpaid family workers
355
427
Industries and Occupations
The largest industries in Santa Ana are healthcare, retail, and education. Higher education, which includes teachers and professors, is also prevalent due to the nearby universities and colleges. Garden Grove's economy is more focused on healthcare and social assistance, retail trade, and manufacturing, providing various opportunities for engineers, technicians, and healthcare professionals.
Building and grounds cleaning and maintenance occupations
8.7%
6.0%
Production occupations
7.0%
8.9%
Healthcare support occupations
6.4%
7.5%
Management occupations
6.3%
6.4%
Business and financial operations occupations
4.8%
5.6%
Educational instruction, and library occupations
4.7%
7.5%
Personal care and service occupations
4.6%
7.2%
Material moving occupations
4.3%
2.9%
Health diagnosing and treating practitioners and other technical occupations
3.0%
3.7%
Computer and mathematical occupations
2.0%
1.3%
Farming, fishing, and forestry occupations
1.7%
0.6%
Transportation occupations
1.6%
0.7%
Health technologists and technicians
1.6%
2.6%
Legal occupations
1.5%
0.8%
Community and social service occupations
1.5%
1.1%
Arts, design, entertainment, sports, and media occupations
1.3%
1.5%
Architecture and engineering occupations
0.2%
1.6%
Health Care
Both cities are well-served in the healthcare sector. Santa Ana is home to several hospitals, including the South Coast Global Medical Center, and Garden Grove has the Garden Grove Medical Center. Both cities have healthcare facilities that cater to a broad range of medical needs for their residents.
Infrastructure in Santa Ana tends to be older due to the city’s rich history. Garden Grove, however, has been experiencing more recent development and enjoys more modern infrastructure. Both cities provide ample public services, including libraries, parks, and community centers.
HMDA - Conventional home purchase loans - Applications denied
Year
Santa Ana
Garden Grove
1999
955
444
2000
834
495
2001
725
453
2002
933
467
2003
1,222
639
2004
1,657
798
2005
2,302
965
2006
2,615
1,266
2007
1,456
678
2008
694
335
2009
399
231
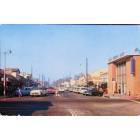
Culture and Food
Santa Ana is known for its vibrant arts scene, historical architecture, and diverse food culture, with a notable concentration of Mexican and Central American restaurants. Garden Grove, meanwhile, is famous for its annual Strawberry Festival and also boasts a diverse food scene with a significant presence of Asian cuisine, primarily Vietnamese.
Sports Teams
While neither Santa Ana nor Garden Grove host major professional sports teams, both cities are in close proximity to Anaheim, which is home to the MLB Angels and NHL Ducks. Both cities have various parks and recreational sports programs for local residents as well.


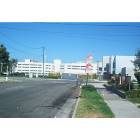


 Santa Ana, CA
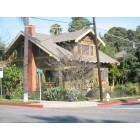
 Garden Grove, CA