California's South Coast and Central Coast offer distinct and rewarding living experiences with unique geographic characteristics, amenities, and economic profiles. Both regions have their individual charms and challenges. This guide will take you through a detailed comparison of these coastal regions, with a focus on various aspects like crime and safety, weather, education, work and economy, and more. Whether you're looking to relocate or are merely visiting, knowing the specifics about South Coast and Central Coast can help you make the most informed decision.
South Coast, specifically in crowded cities such as Los Angeles, tends to have higher crime rates than Central Coast. However, crime rates vary dramatically from neighborhood to neighborhood within each city. You can expect more secure neighborhoods in affluent areas. On the other hand, Central Coast communities like San Luis Obispo are generally safer with lower crime rates making it ideal for families and retirees.
Cost of Living
Living in South Coast can be considerably more expensive than Central Coast. Cities like Los Angeles and Irvine are among the costliest in the nation, with housing as the significant driver of cost. In Central Coast, while cities like Santa Barbara can be pretty expensive, overall it offers a more affordable cost of living especially in towns like Morro Bay or Atascadero.
Income Tax
Income tax is consistent across the state, varying from 1% to 13.3% based on income bracket. This applies uniformly to residents of both South Coast and Central Coast.
Property Tax
Property tax rates are comparable in both South Coast and Central Coast due to California's property taxation laws. However, the overall payment could be higher in South Coast, considering the typically higher property values.
Sales Tax
Both South and Central Coast have similar sales tax rates, as they're determined by California state law, currently at 7.25%. Some cities impose additional local taxes, potentially increasing the total sales tax up to 10.25% in some South Coast cities like Santa Monica.
Income
Type
South Coast
Central Coast
Estimated median household income
$112,870
$106,582
Estimated per capita income
$68,453
$70,103
Cost of living index (U.S. average is 100)
96.8
101.8
If you make $50,000 in South Coast, you will have to make $52,583 in Central Coast to maintain the same standard of living.
Geographical Conditions
South Coast is characterized by long sandy beaches, densely populated cities, and mountain ranges. Central Coast offers rugged coastline, scenic vineyards, rolling hills, and a sparser population. Both regions have beautiful ocean views and easy access to beach activities.
Geographical information
Type
South Coast
Central Coast
Land area
101 sq. miles
50.4 sq. miles
Population density
2,953.2 people per sq. mile
4,732.1 people per sq. mile
Relative area comparison
South Coast, CA Central Coast, CA
Education
Both South Coast and Central Coast have a strong emphasis on education. South Coast is home to some of the country’s top universities like USC and UCLA. Central Coast hosts prestigious institutions like UC Santa Barbara and Cal Poly San Luis Obispo. Both regions offer excellent K-12 education, though there tends to be more educational opportunities in South Coast's urban areas.
South Coast has a very diversified economy with key industries including entertainment, technology, aerospace, and healthcare. Central Coast's economy, by contrast, is more focused on tourism, viticulture, agriculture, and education. Job growth tends to be steadier in South Coast due to its larger market size, while Central Coast can offer a more relaxed pace of work life.
Biggest Employers
South Coast is home to big names such as UCLA, USC, and LA County. Top employers in Central Coast include Zamora Hospitality, University of California, school districts, and local governments. Both regions have a range of industries providing opportunities for potential employees.
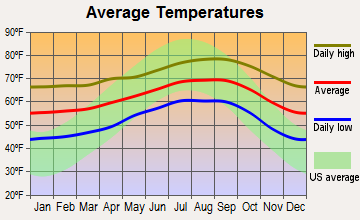
Weather
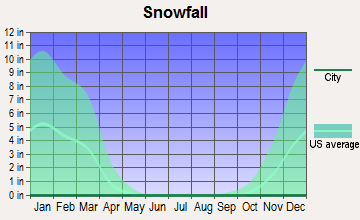
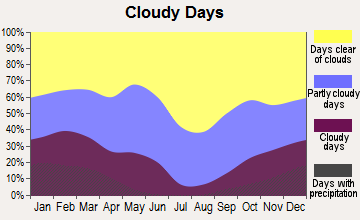
South Coast features a Mediterranean climate with hot, dry summers and mild, wet winters. Cities like Los Angeles and San Diego often see temperatures exceeding 80°F in summer. Central Coast generally has cooler, more moderate weather. Cities like Santa Barbara experience a more uniform climate year-round, making it popular among tourists and residents that favour milder temperatures.
Weather and climate
Type
South Coast
Central Coast
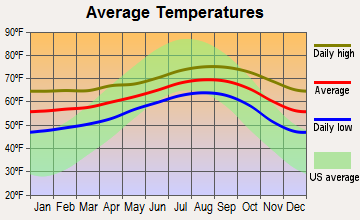
Temperature - Average
62.1°F
62.4°F
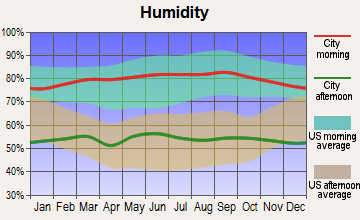
Humidity - Average morning or afternoon humidity
69.1%
69.7%
Humidity - Differences between morning and afternoon humidity
24.6%
26%
Humidity - Maximum monthly morning or afternoon humidity
77%
78.1%
Humidity - Minimum monthly morning or afternoon humidity
52.4%
52%
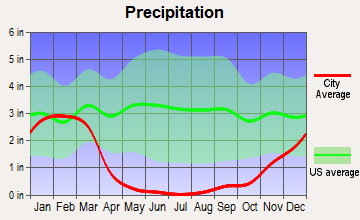
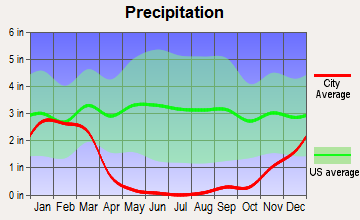
Precipitation - Yearly average
13.4 in
12.1 in
Snowfall - Yearly average
0 in
0 in
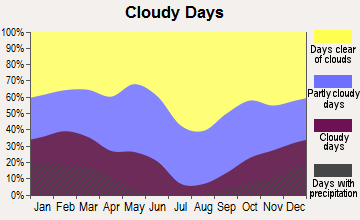
Clouds - Number of days clear of clouds
26.7%
26.6%
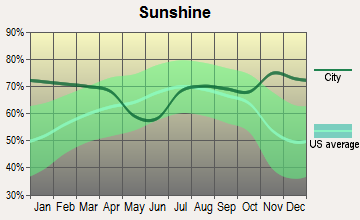
Sunshine amount - Average
77.6%
78.3%
Sunshine amount - Differences during a year
20.5%
21.7%
Sunshine amount - Maximum monthly
81.9%
84.4%
Sunshine amount - Minimum monthly
61.4%
62.7%
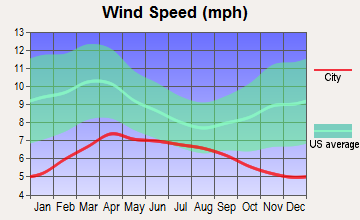
Wind speed - Average
5.5 mph
5.8 mph
Average climate in South Coast, California
Average climate in Central Coast, California
Air pollution
Type
AQI
CO
NO2
OZONE
PB
PM10
PM25
SO2
Year
South Coast
Central Coast
South Coast
Central Coast
South Coast
Central Coast
South Coast
Central Coast
Central Coast
South Coast
Central Coast
South Coast
Central Coast
South Coast
Central Coast
2018
105
119
0.18
0.29
8.6
14.2
34.0
28.9
N/A
N/A
22.7
27.5
7.0
12.6
N/A
0.7
2017
111
116
0.21
0.27
8.4
12.9
34.7
31.6
N/A
N/A
23.0
26.7
11.3
13.8
N/A
0.5
2016
105
102
0.14
0.26
9.6
10.6
33.8
31.2
N/A
N/A
21.9
24.1
9.8
12.5
0.1
0.1
2015
111
106
0.10
0.26
10.5
11.8
32.9
31.8
N/A
N/A
19.4
25.0
10.5
14.5
0.1
0.1
2014
100
109
0.11
0.23
9.8
11.3
31.3
30.2
N/A
N/A
25.4
26.7
11.8
15.6
0.3
0.3
2013
97
107
0.17
0.27
10.6
12.3
30.0
29.3
0.003
N/A
24.5
29.4
10.3
14.1
0.2
0.2
2012
101
103
0.26
0.21
10.1
10.6
29.9
28.0
0.004
N/A
21.5
28.1
10.5
14.4
0.1
0.1
2011
113
109
0.15
0.25
10.2
12.7
30.3
28.2
0.006
N/A
24.0
27.7
10.9
15.9
0.3
0.6
2010
101
102
0.21
0.26
10.9
12.0
30.6
27.6
0.011
N/A
23.3
23.6
11.4
14.1
0.6
0.6
2009
120
118
0.15
0.29
13.0
13.6
31.5
29.2
0.009
N/A
27.3
24.3
12.4
14.5
1.1
1.1
2008
131
124
0.26
0.35
13.2
14.0
32.0
30.1
0.008
N/A
38.8
29.5
9.4
21.6
1.1
1.1
2007
110
100
0.24
0.32
13.7
14.0
30.6
28.5
0.010
N/A
N/A
N/A
N/A
N/A
0.8
0.8
2006
112
109
0.30
0.35
14.8
15.1
30.6
27.2
0.005
N/A
N/A
N/A
N/A
N/A
1.3
1.3
2005
109
91
0.28
0.32
13.7
14.6
29.9
29.4
0.011
N/A
N/A
N/A
N/A
N/A
1.3
1.3
2004
130
118
0.29
0.46
15.5
16.3
32.5
31.5
0.012
N/A
N/A
N/A
N/A
N/A
1.6
1.6
2003
132
116
0.38
0.59
18.2
19.1
31.3
32.5
0.046
N/A
N/A
N/A
N/A
N/A
1.1
1.1
2002
129
103
0.40
0.58
17.7
18.8
28.4
28.2
0.010
N/A
N/A
N/A
N/A
N/A
1.6
1.6
2001
137
109
0.52
0.67
18.5
18.2
27.8
27.8
0.011
N/A
N/A
N/A
N/A
N/A
1.4
1.5
2000
140
116
0.52
0.79
21.2
20.6
24.5
26.0
0.016
N/A
N/A
N/A
N/A
N/A
1.9
1.9
Natural disasters
Type
South Coast
Central Coast
Tornado activity compared to U.S. average
17.1%
18.4%
Earthquake activity compared to U.S. average
6,728.5%
6,801.5%
Natural disasters compared to U.S. average
32%
32%
Transportation
South Coast boasts extensive public transit with metros, buses, and shared ride services. Commute times can be high due to traffic congestion. Central Coast relies more on cars for commuting, with limited public transportation options. On the plus side, traffic is less of an issue here, leading to lower commute times.
Transport
Type
South Coast
Central Coast
Amtrak stations nearby
3
3
Means of transportation to work
Type
South Coast
Central Coast
Bicycle
0.3%
1.8%
Bus
1%
2.4%
Carpooled
10.5%
9%
Car alone
79.2%
75.9%
Motorcycle
0.2%
0.2%
Railroad
0.4%
0.1%
Walked
1.7%
4.4%
Average travel time to work
Type
South Coast
Central Coast
Average
27.9 min
23.2 min
Real Estate
Real estate in South Coast is often higher priced with median home values around $700,000 depending on the city. Central Coast’s real estate is more varied, with more affordable options in towns like Paso Robles, but soaring prices in cities like Santa Barbara.
Neighborhoods
South Coast offers a mix of upscale, suburban, and urban neighborhoods. Many Central Coast neighborhoods lean towards the suburban and rural end of the spectrum, offering more space and a quieter way of life. The architectural style and layout of the neighborhoods in both regions are distinct and cater to a variety of tastes and budgets.
Houses and residents
Type
South Coast
Central Coast
Houses
124,031
96,674
Average household size (people)
2.5
2.4
Houses occupied
117,093 (94.4%)
90,435 (93.5%)
Houses occupied by owners
81,601 (69.7%)
43,559 (48.2%)
Houses occupied by renters
35,492 (30.3%)
46,876 (51.8%)
Median rent asked for vacant for-rent units
$2,718
$2,849
Median price asked for vacant for-sale houses and condos
$1,099,558
$1,099,558
Estimated median house or condo value
Over $1,000,000
Over $1,000,000
Median number of rooms in apartments
3.9
3.9
Median number of rooms in houses and condos
5.1
6.1
Renting percentage
33.8%
53.9%
Housing density (houses/condos per square mile)
1,227.5
1,918.7
Household income disparities
38.1%
38.4%
Housing units without a mortgage
10,715 (16.4%)
8,041 (21.3%)
Housing units with both a second mortgage and home equity loan
248 (0.4%)
100 (0.3%)
Housing units with a mortgage
54,674 (83.6%)
29,764 (78.7%)
Housing units with a home equity loan
5,859 (9%)
3,303 (8.7%)
Housing units with a second mortgage
7,560 (11.6%)
3,451 (9.1%)
Housing units lacking complete kitchen facilities
0.8%
0.7%
Housing units lacking complete plumbing facilities
0.3%
0.4%
Housing units in structures
Housing units in structures
South Coast
Central Coast
One, detached
45.9%
38.4%
One, attached
19.0%
16.3%
Two
3.0%
5.0%
3 or 4
8.5%
8.7%
5 to 9
8.8%
5.9%
10 to 19
4.2%
5.3%
20 to 49
2.8%
4.7%
50 or more
5.3%
13.4%
Mobile homes
2.2%
2.0%
Boats, RVs, vans, etc.
0.1%
0.2%
Median real estate property taxes paid for housing units
Self-employed workers in own not incorporated business
17,244
13,281
State government workers
4,403
6,404
Unpaid family workers
640
456
Industries and Occupations
In South Coast, you'll find much diversity in jobs with occupations spanning across management, arts and entertainment, healthcare, and education. Central Coast is dominated by service jobs due to its focus on tourism and agriculture. You'll find many roles linked to the wine industry, farming, hotel and restaurant services, as well as positions in academia due to the presence of major universities.
Health Care
Both the South Coast and Central Coast have excellent healthcare facilities. South Coast hosts globally recognized healthcare facilities like Cedar Sinai or UCLA Health. Central Coast, while having fewer healthcare options than South Coast, still offers high-quality care, with standout facilities like French Hospital Medical Center in San Luis Obispo.
Infrastructure
South Coast has more developed infrastructure being an urbanized region, including a comprehensive public transit system, airports, and extensive roadways connecting to other parts of California. Central Coast offers a more rural feel and slower pace of life. Its infrastructure is more spread out, favoring car travel over public transportation.
Infrastructure
Type
South Coast
Central Coast
TV stations
1
2
Nuclear power plants nearby
2
0
Culture and Food
South Coast is renowned for its vibrant multicultural atmosphere, influence from Hollywood, music scenes, and diverse food cuisine. Central Coast, however, is known for a more laid-back lifestyle, wine culture, and farm-to-table dining experiences. Both areas offer an engaging cultural and food scene, albeit with different vibes.
Sports Teams
South Coast is a sports powerhouse, with popular teams like the LA Lakers, Clippers, Kings, and Dodgers. Central Coast doesn't have major league sports teams but hosts community sporting events and boasts a solid interest in college sports.
 South Coast, CA
 Central Coast, CA