Southwest San Gabriel Valley in California and Fullerton in the same state each offer distinct lifestyles, influenced by factors like crime and safety rates, weather, cost of living, education, and health care provisions, among others. Each location has its advantages and peculiarities, making them remarkable in their ways. Comparing these two allows potential residents and tourists to better evaluate which fits their tastes and needs best.
Southwest San Gabriel Valley tends to have lower crime rates, largely owing to smaller population sizes across its various communities than Fullerton. However, both areas prioritize public safety and have responsive police departments. Crimes tend to be lower-level offenses in both areas. Fullerton, with its larger population, might see a slightly higher crime rate, but compared to big cities, it's relatively safe.
Cost of Living
The cost of living in Fullerton typically edges higher than that in Southwest San Gabriel Valley, largely due to higher real estate prices. This differential reflects in expenses related to housing, with costs for groceries, utilities, and transportation not dramatically different between the two.
Income Tax
Both Fullerton and Southwest San Gabriel Valley are subjected to California's progressive income tax system. The state has one of the highest income tax rates, but these taxes are used to fund essential services.
Property Tax
Property taxes in Fullerton tend to be a touch higher than in Southwest San Gabriel Valley due to the higher home prices. Both cities are under California’s property tax guidelines, which may vary based slightly on the city.
Sales Tax
California has a rather high state sales tax, and both Fullerton and Southwest San Gabriel Valley adhere to this rate. Specific city taxes might differ slightly. These funds are used to support public services in both regions.
Income
Type
Southwest San Gabriel Valley
Fullerton
Estimated median household income
$73,720
$95,431
Estimated per capita income
$29,945
$46,429
Cost of living index (U.S. average is 100)
161.2
88.6
If you make $50,000 in Fullerton, you will have to make $90,971 in Southwest San Gabriel Valley to maintain the same standard of living.
Geographical Conditions
Both Fullerton and Southwest San Gabriel Valley are situated in the Los Angeles basin, with a typically flat terrain intermixed with gentle hills. Fullerton is closer to the coast, often resulting in a more temperate climate.
Geographical information
Type
Southwest San Gabriel Valley
Fullerton
Land area
35.3 sq. miles
22.2 sq. miles
Population density
9,252.7 people per sq. mile
6,390.8 people per sq. mile
Relative area comparison
Southwest San Gabriel Valley, CA Fullerton, CA
Education
Both Southwest San Gabriel Valley and Fullerton house several reputable schools. In Fullerton, schools tend to be larger and more numerous due to the larger population. The city is also home to multiple colleges, offering ample opportunities for higher education. Southwest San Gabriel Valley also boasts of several high-achieving schools with a focus on maintaining a more personal, community-oriented atmosphere.
Both regions host a variety of businesses and industries, contributing to stable local economies. Fullerton's economy leans towards retail, health care, and education, while the Southwest San Gabriel Valley focuses more on skilled trade services and retail.
Biggest Employers
In Fullerton, the largest employers include the Fullerton School District, Fullerton College, and St Jude Medical Center. In the Southwest San Gabriel Valley, larger employers tend to be in the retail industry, such as Walmart and Costco.
In Southwest San Gabriel Valley (Los Angeles County), 69.7% voted for Democrats and 27.8% for Republicans in 2012 Presidential Election. In Fullerton (Orange County), 45.8% voted for Democrats and 52.0% for Republicans.
Elections
Type
Democrats
Republicans
Other
Year
Southwest San Gabriel Valley
Fullerton
Southwest San Gabriel Valley
Fullerton
Southwest San Gabriel Valley
Fullerton
2020
71.0%
53.6%
26.9%
44.6%
2.1%
1.8%
2016
72.0%
50.9%
22.5%
42.4%
5.5%
6.7%
2012
69.7%
45.8%
27.8%
52.0%
2.4%
2.3%
2008
69.2%
47.8%
28.8%
50.3%
1.9%
1.9%
2004
63.3%
39.3%
35.7%
60.2%
1.0%
0.5%
2000
63.6%
40.4%
32.4%
55.9%
4.0%
3.7%
1996
59.3%
37.9%
31.0%
51.7%
9.7%
10.5%
Breakdown of population affiliated with a religious congregation
Type
Adherents
Congregations
Religion
Southwest San Gabriel Valley
Fullerton
Southwest San Gabriel Valley
Fullerton
CATHOLIC CHURCH
36.1%
26.5%
4.7%
4.4%
SOUTHERN BAPTIST CONVENTION
1.0%
2.3%
9.0%
8.8%
MUSLIM ESTIMATE
0.7%
0.8%
1.0%
1.3%
AMERICAN BAPTIST CHURCHES IN THE USA
0.5%
0.2%
3.1%
1.7%
SEVENTH DAY ADVENTIST CHURCH
0.5%
0.4%
2.4%
1.3%
EPISCOPAL CHURCH
0.4%
0.4%
1.4%
1.4%
EVANGELICAL LUTHERAN CHURCH IN AMERICA
0.2%
0.4%
1.9%
2.3%
LUTHERAN CHURCH
0.2%
0.6%
1.6%
2.0%
REFORMED CHURCH IN AMERICA
0.1%
0.3%
0.2%
0.2%
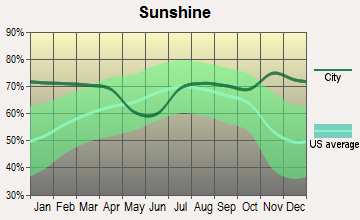
Weather
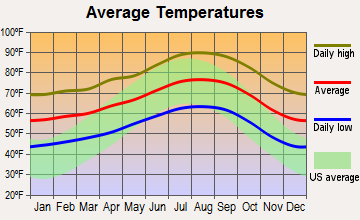
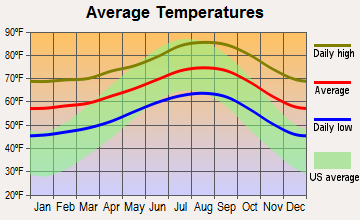
Weather patterns in both Southwest San Gabriel Valley and Fullerton are typical of Southern California - mild, wet winters and hot, dry summers. Southwest San Gabriel Valley tends to be slightly cooler than Fullerton due to its geographic location. Fullerton, being closer to the coast, gets some relief from the ocean breeze.
Weather and climate
Type
Southwest San Gabriel Valley
Fullerton
Temperature - Average
66.3°F
65.4°F
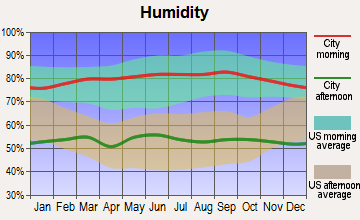
Humidity - Average morning or afternoon humidity
61.4%
69.4%
Humidity - Differences between morning and afternoon humidity
16.5%
25.5%
Humidity - Maximum monthly morning or afternoon humidity
65.8%
77.5%
Humidity - Minimum monthly morning or afternoon humidity
49.3%
52%
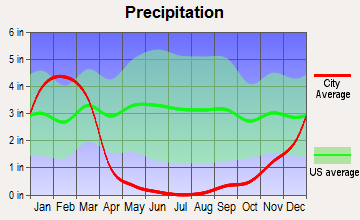
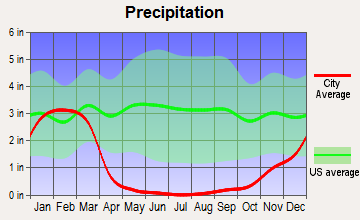
Precipitation - Yearly average
17.6 in
12.8 in
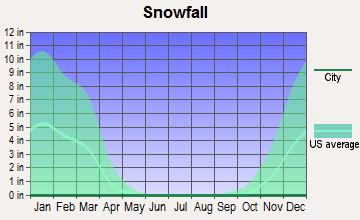
Snowfall - Yearly average
0 in
0 in
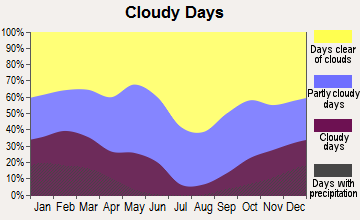
Clouds - Number of days clear of clouds
30.1%
26.7%
Sunshine amount - Average
78.4%
78.4%
Sunshine amount - Differences during a year
22%
22%
Sunshine amount - Maximum monthly
85%
85%
Sunshine amount - Minimum monthly
63%
63%
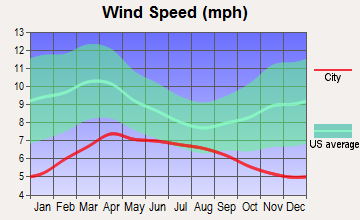
Wind speed - Average
2.3 mph
5.6 mph
Average climate in Southwest San Gabriel Valley, California
Average climate in Fullerton, California
Air pollution
Type
AQI
CO
NO2
OZONE
PB
PM10
PM25
SO2
Year
Southwest San Gabriel Valley
Fullerton
Southwest San Gabriel Valley
Fullerton
Southwest San Gabriel Valley
Fullerton
Southwest San Gabriel Valley
Fullerton
Southwest San Gabriel Valley
Fullerton
Southwest San Gabriel Valley
Fullerton
Southwest San Gabriel Valley
Fullerton
Southwest San Gabriel Valley
Fullerton
2018
140
142
0.39
0.33
14.2
13.6
26.6
26.1
0.008
0.007
27.5
27.4
15.1
12.3
0.4
0.6
2017
142
146
0.38
0.38
15.1
14.7
27.8
26.5
0.007
0.007
30.2
27.1
15.3
13.6
0.5
0.5
2016
128
136
0.36
0.41
15.2
14.7
26.5
26.2
0.007
0.007
27.8
24.4
14.3
12.9
0.4
0.4
2015
137
143
0.36
0.39
15.3
15.1
26.7
26.2
0.006
0.006
27.6
25.2
16.4
14.8
0.3
0.4
2014
138
141
0.39
0.35
16.3
15.4
26.8
25.5
0.007
0.007
29.9
27.0
18.0
16.1
0.4
0.6
2013
140
144
0.44
0.40
17.5
16.1
25.2
24.4
0.007
0.006
28.3
28.6
17.0
14.0
0.4
0.5
2012
144
148
0.47
0.43
17.7
16.0
25.0
24.5
0.007
0.005
27.6
27.4
18.1
14.8
0.5
0.3
2011
142
146
0.50
0.43
19.3
17.1
23.6
25.4
0.008
0.007
29.8
27.6
17.6
16.1
0.4
0.7
2010
128
133
0.52
0.46
19.4
17.7
22.9
24.8
0.020
0.012
30.0
24.2
16.3
14.9
0.5
0.6
2009
150
156
0.43
0.47
21.5
19.4
23.5
25.3
0.011
0.010
40.0
25.1
18.0
15.5
0.5
0.9
2008
152
157
0.53
0.48
23.5
20.7
22.8
25.1
0.014
0.012
39.1
30.5
18.3
18.7
0.6
1.0
2007
128
135
0.58
0.49
24.2
20.9
21.8
24.7
0.017
0.014
N/A
N/A
N/A
N/A
1.1
0.9
2006
125
128
0.63
0.54
24.6
21.4
22.1
25.2
0.009
0.008
N/A
N/A
N/A
N/A
1.7
1.5
2005
123
128
0.66
0.54
25.6
22.9
20.5
24.3
0.015
0.014
N/A
N/A
N/A
N/A
2.1
1.4
2004
132
134
0.77
0.63
27.7
23.0
22.9
28.5
0.019
0.016
N/A
N/A
N/A
N/A
2.4
1.8
2003
143
143
0.98
0.78
31.8
26.2
22.0
22.3
0.027
0.026
N/A
N/A
N/A
N/A
1.8
1.3
2002
137
134
1.00
0.81
33.0
25.6
21.1
20.7
0.025
0.021
N/A
N/A
N/A
N/A
2.4
2.3
2001
143
143
1.11
0.93
34.2
27.9
18.9
20.5
0.039
0.037
N/A
N/A
N/A
N/A
2.4
2.1
2000
147
152
1.12
0.96
33.4
30.9
18.9
21.1
0.033
0.031
N/A
N/A
N/A
N/A
1.4
1.8
Natural disasters
Type
Southwest San Gabriel Valley
Fullerton
Tornado activity compared to U.S. average
18%
19.3%
Earthquake activity compared to U.S. average
7,182.3%
7,071.6%
Natural disasters compared to U.S. average
57%
32%
Transportation
Public transit systems are robust in both areas, with several bus lines and train routes available for commuting. However, like much of Southern California, having personal transportation in both Southwest San Gabriel Valley and Fullerton is usually more convenient due to the sprawling nature of the region.
Transport
Type
Southwest San Gabriel Valley
Fullerton
Amtrak stations
0
1
Amtrak stations nearby
3
3
FAA registered aircraft
0
99
FAA registered aircraft manufacturers and dealers
0
6
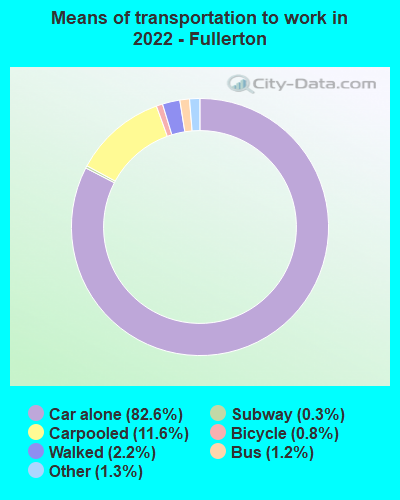
Means of transportation to work
Type
Southwest San Gabriel Valley
Fullerton
Bicycle
0.5%
0.3%
Bus
4.7%
0.8%
Carpooled
16.1%
12.7%
Car alone
73%
82.9%
Motorcycle
0.1%
0.3%
Railroad
0%
0.6%
Subway
0%
0.1%
Walked
2.5%
1.5%
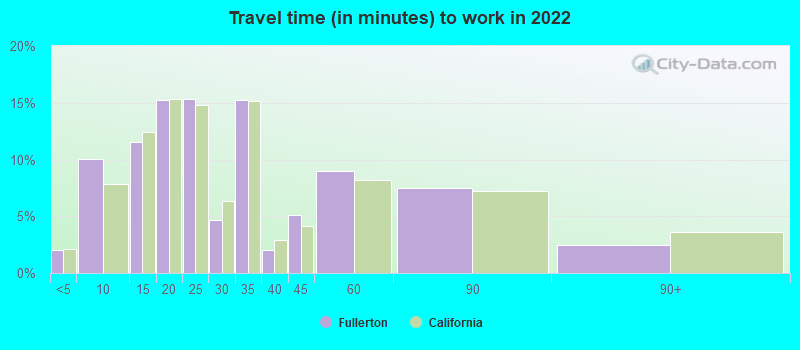
Average travel time to work
Type
Southwest San Gabriel Valley
Fullerton
Average
29.1 min
29.7 min
Real Estate
Real estate prices tend to be higher in Fullerton given its larger size and more diverse amenities. Houses in Southwest San Gabriel Valley tend to be more affordable, although prices can still be on the higher side compared to national averages.
Neighborhoods
Both regions boast of diverse neighborhoods, with Fullerton's being larger and more vibrant due to the city's size. Southwest San Gabriel Valley's neighborhoods tend to be quieter, embodying more of a small-town feel.
Houses and residents
Type
Southwest San Gabriel Valley
Fullerton
Houses
102,656
49,834
Average household size (people)
3.1
2.9
Houses occupied
99,543 (97%)
48,423 (97.2%)
Houses occupied by owners
47,333 (47.6%)
23,525 (48.6%)
Houses occupied by renters
52,210 (52.5%)
24,898 (51.4%)
Median rent asked for vacant for-rent units
$1,828
$875.95
Median price asked for vacant for-sale houses and condos
$1,138,428
$972,430
Estimated median house or condo value
$723,161
$790,900
Median number of rooms in apartments
3.7
3.6
Median number of rooms in houses and condos
5.9
6.3
Renting percentage
51.7%
45.8%
Housing density (houses/condos per square mile)
2,909.6
2,244.8
Household income disparities
44%
42.3%
Housing units without a mortgage
13,166 (31.1%)
371 (2.4%)
Housing units with both a second mortgage and home equity loan
88 (0.2%)
1,362 (8.8%)
Housing units with a mortgage
29,118 (68.9%)
15,028 (97.6%)
Housing units with a home equity loan
2,557 (6%)
0 (0%)
Housing units with a second mortgage
2,975 (7%)
1,474 (9.6%)
Housing units lacking complete kitchen facilities
1.5%
4%
Housing units lacking complete plumbing facilities
Self-employed workers in own not incorporated business
8,660
4,512
State government workers
4,158
2,615
Unpaid family workers
639
22
Industries and Occupations
The most prevalent industries in Southwest San Gabriel Valley are retail and trade services. In contrast, Fullerton sees a more diverse range of occupations, co
Driven by the presence of several educational and healthcare establishments.
Both regions have access to high-quality healthcare, with several hospitals and clinics available. As a larger city, Fullerton has more healthcare facilities, while Southwest San Gabriel Valley, while smaller, provides its residents with a solid selection of healthcare services.
Health (county statistics)
Type
Southwest San Gabriel Valley
Fullerton
General health status score of residents in this county from 1 (poor) to 5 (excellent)
Infrastructure in both regions is well-developed, reflecting the growth and development typical of Southern California. Fullerton, as the larger city, offers more extensive public facilities and spaces. Southwest San Gabriel Valley, while smaller, boasts of well-maintained public spaces and a robust network of public services.
Infrastructure
Type
Southwest San Gabriel Valley
Fullerton
TV stations
26
15
Culture and Food
Fullerton is renowned for its eclectic food scene and vibrant cultural life, driven in part by the presence of several colleges. Southwest San Gabriel Valley, while smaller, also offers a diverse range of cuisines, reflecting the rich cultural mix of the region.
Sports Teams
Being larger, Fullerton has more organized sports teams across various age groups. Southwest San Gabriel Valley offers sporting activities through smaller, community-oriented teams and clubs.
 Southwest San Gabriel Valley, CA
 Fullerton, CA