Southwest San Gabriel Valley (SGV) and Whittier, both sit in Los Angeles County, California, with unique characteristics. As adjacent communities, they share many similarities such as weather conditions, but they also offer distinctive experiences in terms of cost of living, education, economy and more. This comparison will cover various aspects of life in these communities, providing a valuable guide for those considering relocation or visitation.
Both Southwest San Gabriel Valley and Whittier have safer neighborhoods compared to many other areas in Los Angeles County. However, based on statistics, Whittier tends to have slightly higher crime rates compared to Southwest SGV. The latter is part of a larger region known for its ethnic diversity and generally peaceful neighborhoods. Both areas maintain dedicated police departments that diligently work to ensure resident safety.
Cost of Living
The cost of living in Southwest SGV is typically higher than Whittier. This is attributed to higher home costs, among other factors. However, Whittier has been reasonable for Southern California, offering more affordable housing options even while both locations have experiences a historic rise in the cost of housing.
Income Tax
California's state income tax is progressive and depends on income levels. Both Southwest SGV and Whittier homeowners fall under these guidelines. It ranges from 1% for the lowest earners up to 13.3% for those earning over $1 million annually.
Property Tax
Property tax in Los Angeles County is about 0.73%, which is lower than the national average. This rate applies to both Southwest SGV and Whittier. However, the actual property tax paid by homeowners depends largely on the assessed value of their property.
Sales Tax
The city and state sales tax in both regions are identical due to being under the governance of Los Angeles County and the state of California. The combined sales tax rate for both Southwest San Gabriel Valley and Whittier is approximately 9.5%, which is relatively high compared to other states.
Income
Type
Southwest San Gabriel Valley
Whittier
Estimated median household income
$73,720
$84,320
Estimated per capita income
$29,945
$40,248
Cost of living index (U.S. average is 100)
161.2
138.9
If you make $50,000 in Whittier, you will have to make $58,027 in Southwest San Gabriel Valley to maintain the same standard of living.
Geographical Conditions
Southwest SGV and Whittier are characterized by flat to hilly topography, typical of Southern California. Both have a mix of urban, suburban, and semi-rural areas. Notably, Whittier hosts the Whittier Narrows, a significant geographical feature and recreation area.
Geographical information
Type
Southwest San Gabriel Valley
Whittier
Land area
35.3 sq. miles
14.6 sq. miles
Population density
9,252.7 people per sq. mile
5,830.9 people per sq. mile
Relative area comparison
Southwest San Gabriel Valley, CA Whittier, CA
Education
Southwest San Gabriel Valley and Whittier both offer quality education opportunities. There are numerous reputable public and private schools, as well as universities and colleges in these communities. Both areas share districts with large, renowned schools, including the Whittier Union High School District and local colleges like Rio Hondo College and nearby Pasadena City College.
While both communities enjoy economic vitality, Southwest SGV is more known as a residential area with a strong local economy that leans towards service and retail. However, Whittier, with its historic Uptown area, shows strong retail and healthcare sectors. Additionally, Whittier has strong roots in the oil industry, with major employers being the Whittier Hospital Medical Center and the Presbyterian Intercommunity Hospital.
Biggest Employers
In Southwest SGV, the biggest employers include healthcare institutions such as AHMC Healthcare and various retail corporations. In Whittier, the biggest employers include Whittier Hospital Medical Center and the Presbyterian Intercommunity Hospital, along with several school districts and the local government.
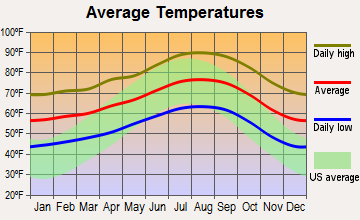
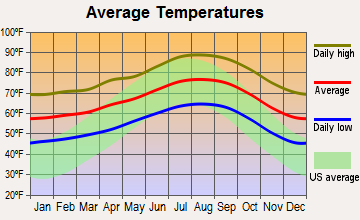
Weather
The weather in both areas is typical of Southern California: mild, Mediterranean climate. The year-round sunny weather makes these places appealing to both residents and tourists. Temperatures rarely reach freezing in winter, and summers can be hot but typically are moderated by ocean breezes. With over 280 sun-filled days a year, both locations are perfect for those who love outdoor activities.
Weather and climate
Type
Southwest San Gabriel Valley
Whittier
Temperature - Average
66.3°F
66.8°F
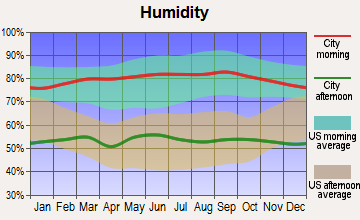
Humidity - Average morning or afternoon humidity
61.4%
65.2%
Humidity - Differences between morning and afternoon humidity
16.5%
20.2%
Humidity - Maximum monthly morning or afternoon humidity
65.8%
71.5%
Humidity - Minimum monthly morning or afternoon humidity
49.3%
51.3%
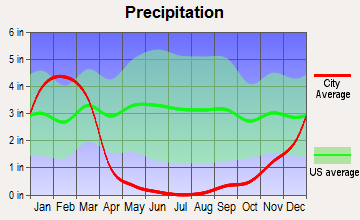
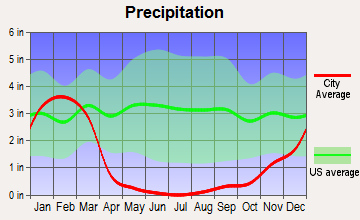
Precipitation - Yearly average
17.6 in
14.7 in
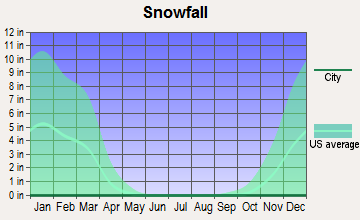
Snowfall - Yearly average
0 in
0 in
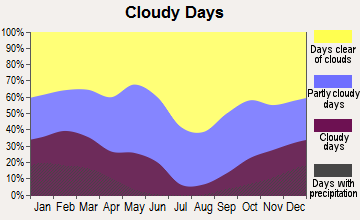
Clouds - Number of days clear of clouds
30.1%
28%
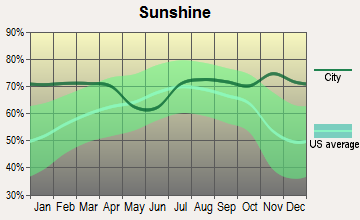
Sunshine amount - Average
78.4%
78.4%
Sunshine amount - Differences during a year
22%
22%
Sunshine amount - Maximum monthly
85%
85%
Sunshine amount - Minimum monthly
63%
63%
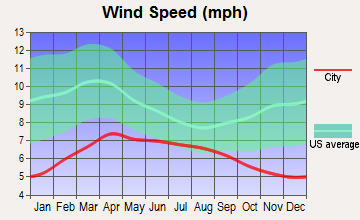
Wind speed - Average
2.3 mph
3.9 mph
Average climate in Southwest San Gabriel Valley, California
Average climate in Whittier, California
Air pollution
Type
AQI
CO
NO2
OZONE
PB
PM10
PM25
SO2
Year
Southwest San Gabriel Valley
Whittier
Southwest San Gabriel Valley
Whittier
Southwest San Gabriel Valley
Whittier
Southwest San Gabriel Valley
Whittier
Southwest San Gabriel Valley
Whittier
Southwest San Gabriel Valley
Whittier
Southwest San Gabriel Valley
Whittier
Southwest San Gabriel Valley
Whittier
2018
140
142
0.39
0.34
14.2
13.8
26.6
26.0
0.008
0.007
27.5
27.8
15.1
13.6
0.4
0.5
2017
142
146
0.38
0.36
15.1
14.9
27.8
26.9
0.007
0.007
30.2
29.1
15.3
14.2
0.5
0.6
2016
128
136
0.36
0.36
15.2
15.0
26.5
26.3
0.007
0.007
27.8
26.0
14.3
13.2
0.4
0.5
2015
137
144
0.36
0.37
15.3
15.4
26.7
26.7
0.006
0.006
27.6
26.5
16.4
15.1
0.3
0.4
2014
138
141
0.39
0.36
16.3
15.9
26.8
25.8
0.007
0.007
29.9
28.7
18.0
15.8
0.4
0.5
2013
140
144
0.44
0.40
17.5
16.7
25.2
24.7
0.007
0.006
28.3
29.4
17.0
14.7
0.4
0.5
2012
144
148
0.47
0.43
17.7
17.3
25.0
24.7
0.007
0.006
27.6
28.5
18.1
15.8
0.5
0.4
2011
142
146
0.50
0.44
19.3
18.0
23.6
24.5
0.008
0.008
29.8
28.6
17.6
16.8
0.4
0.6
2010
128
133
0.52
0.48
19.4
18.9
22.9
23.9
0.020
0.014
30.0
26.2
16.3
15.0
0.5
0.6
2009
150
153
0.43
0.49
21.5
20.5
23.5
24.7
0.011
0.010
40.0
29.7
18.0
16.3
0.5
0.8
2008
152
154
0.53
0.53
23.5
22.0
22.8
23.8
0.014
0.012
39.1
31.8
18.3
17.9
0.6
0.8
2007
128
135
0.58
0.54
24.2
22.6
21.8
23.4
0.017
0.014
N/A
N/A
N/A
N/A
1.1
1.2
2006
125
129
0.63
0.59
24.6
23.4
22.1
24.0
0.009
0.009
N/A
N/A
N/A
N/A
1.7
1.6
2005
123
128
0.66
0.60
25.6
25.4
20.5
20.5
0.015
0.014
N/A
N/A
N/A
N/A
2.1
2.3
2004
132
135
0.77
0.69
27.7
27.3
22.9
22.4
0.019
0.017
N/A
N/A
N/A
N/A
2.4
2.2
2003
143
140
0.98
0.85
31.8
31.0
22.0
21.1
0.027
0.025
N/A
N/A
N/A
N/A
1.8
1.4
2002
137
137
1.00
0.87
33.0
31.0
21.1
19.7
0.025
0.022
N/A
N/A
N/A
N/A
2.4
2.3
2001
143
143
1.11
0.97
34.2
32.2
18.9
18.2
0.039
0.037
N/A
N/A
N/A
N/A
2.4
2.4
2000
147
153
1.12
1.03
33.4
34.2
18.9
18.8
0.033
0.031
N/A
N/A
N/A
N/A
1.4
1.6
Natural disasters
Type
Southwest San Gabriel Valley
Whittier
Tornado activity compared to U.S. average
18%
18.9%
Earthquake activity compared to U.S. average
7,182.3%
7,121.4%
Natural disasters compared to U.S. average
57%
57%
Transportation
Transportation in both areas is car-centric, like most of Southern California. However, both also offer public transit options, with Metro buses being more predominant in Southwest SGV, while Whittier operates its own bus system in addition to regional options for those without personal transportation.
Transport
Type
Southwest San Gabriel Valley
Whittier
Amtrak stations nearby
3
3
FAA registered aircraft
0
37
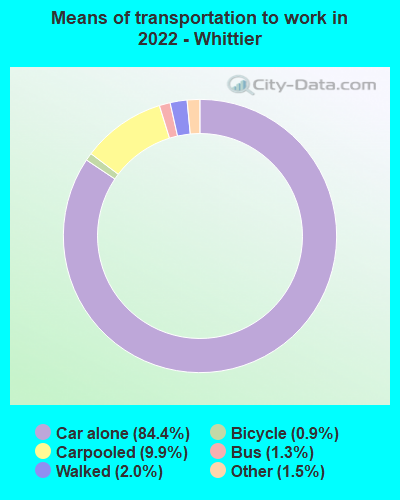
Means of transportation to work
Type
Southwest San Gabriel Valley
Whittier
Bicycle
0.5%
1%
Bus
4.7%
1.3%
Carpooled
16.1%
10.3%
Car alone
73%
84.3%
Walked
2.5%
2.2%
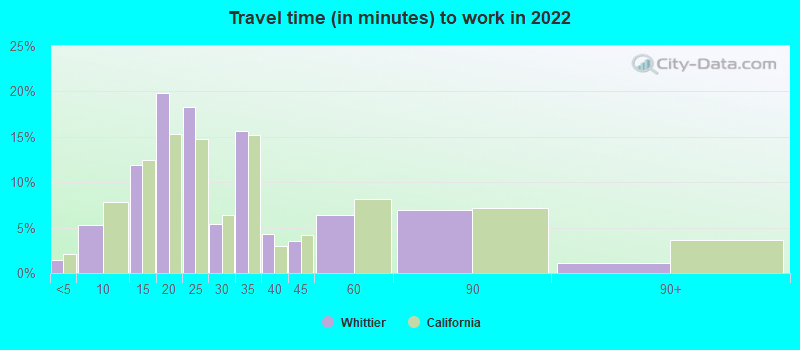
Average travel time to work
Type
Southwest San Gabriel Valley
Whittier
Average
29.1 min
28.1 min
Real Estate
Real estate in both regions remains robust as many Angelinos continue to flock to these regions drawn by their combination of urban convenience and suburban charm. Southwest SGV real estate trends more expensive than Whittier, reflecting its relatively higher cost of living.
Neighborhoods
The communities of Southwest SGV are diverse, including venerable communities such as Almansor and Monterey Park. Whittier is known for its historic neighborhoods, such as Uptown, and is notable for its charming individual character, as seen in the bespoke architecture of its homes.
Houses and residents
Type
Southwest San Gabriel Valley
Whittier
Houses
102,656
28,607
Average household size (people)
3.1
3
Houses occupied
99,543 (97%)
27,773 (97.1%)
Houses occupied by owners
47,333 (47.6%)
16,521 (59.5%)
Houses occupied by renters
52,210 (52.5%)
11,252 (40.5%)
Median rent asked for vacant for-rent units
$1,828
$1,375
Median price asked for vacant for-sale houses and condos
$1,138,428
$853,666
Estimated median house or condo value
$723,161
$718,300
Median number of rooms in apartments
3.7
3.8
Median number of rooms in houses and condos
5.9
6
Renting percentage
51.7%
42.7%
Housing density (houses/condos per square mile)
2,909.6
1,955.2
Household income disparities
44%
43.5%
Housing units without a mortgage
13,166 (31.1%)
289 (2.3%)
Housing units with both a second mortgage and home equity loan
88 (0.2%)
1,165 (9.2%)
Housing units with a mortgage
29,118 (68.9%)
12,353 (97.7%)
Housing units with a home equity loan
2,557 (6%)
0 (0%)
Housing units with a second mortgage
2,975 (7%)
1,414 (11.2%)
Housing units lacking complete kitchen facilities
1.5%
3.1%
Housing units lacking complete plumbing facilities
Self-employed workers in own not incorporated business
8,660
1,908
State government workers
4,158
1,415
Unpaid family workers
639
241
Industries and Occupations
Southwest SGV's economy relies heavily on service, retail, and healthcare industries with occupations mainly in management, sales, and healthcare fields. Conversely, Whittier has a more diverse economic base, including healthcare, education, retail, and the remnants of its rich oil industry.
Health Care
Both areas boast top-notch health facilities. Southwest SGV is home to San Gabriel Valley Medical Center, while Whittier hosts the PIH Health Whittier Hospital. Each area provides a range of health services, from general to specialized care.
Infrastructure
The infrastructure in both Southwest SGV and Whittier is well-established and caters to a high quality of life and convenience for its residents. From modern healthcare facilities, schools, to community parks and shopping areas, both communities reflect Southern California's living ideal.
Infrastructure
Type
Southwest San Gabriel Valley
Whittier
TV stations
26
22
Culture and Food
Southwest SGV is known for its diverse demographics, producing a rich array of cuisines, particularly Asian food. Meanwhile, Whittier, with its historic buildings and charming streets, offers a variety of eateries from homegrown Mexican to upscale Italian restaurants.
Sports Teams
Neither Southwest SGV nor Whittier has professional sports teams of their own. However, they're both conveniently near Los Angeles, giving residents and tourists access to teams like the Lakers, Dodgers, and the LA Kings.
 Southwest San Gabriel Valley, CA
 Whittier, CA