Tucson, AZ, and Central Contra Costa, CA, both offer unique living experiences with their distinct geographical positions, economic situations, and cultural considerations. Tucson, located in the heart of the Sonoran Desert, presents a relatively lower cost of living, a diverse culture, and a burgeoning tech industry. On the other hand, Central Contra Costa, situated in the San Francisco Bay Area, boasts high-quality education, a strong economy, and rich cultural offerings. However, it comes with a significantly higher cost of living. Both cities have their own unique charm which appeals to both residents and tourists alike.
Tucson has higher crime rates compared to the national average, which can concern potential residents or tourists. However, efforts are being made to improve safety in the city. Central Contra Costa, on the other hand, is generally safer with a crime rate that is lower than the national average. Visitors and residents alike can feel more secure in this region.
Cost of Living
The cost of living in Tucson is significantly lower than the national average, which includes housing, utilities, groceries, and health care. This makes Tucson a desirable location for people considering relocation. Conversely, the cost of living in Central Contra Costa is considerably higher than the national average, largely driven by housing costs, which is a typical feature of the Bay Area.
Income Tax
Arizona has a progressive income tax, maxing out at 4.5%. California, on the other hand, has the highest state income tax in the country, reaching up to 13.3%, which is an important factor for those considering relocation.
Property Tax
Property tax rates in Tucson are higher than the national average, while in Central Contra Costa they are relatively lower, but higher home values can lead to substantial tax bills in both locations.
Sales Tax
The sales tax in Tucson is 8.7%, higher than the national average, adding to the cost of living. Central Contra Costa has a sales tax rate of 8.25%, which is slightly lower than Tucson but still higher than the national average.
Income
Type
Tucson
Central Contra Costa
Estimated median household income
$50,306
$127,452
Estimated per capita income
$27,821
$68,702
Cost of living index (U.S. average is 100)
90.1
139.1
If you make $50,000 in Tucson, you will have to make $77,192 in Central Contra Costa to maintain the same standard of living.
Geographical Conditions
Tucson is in the Sonoran Desert surrounded by mountain ranges, offering a unique landscape and outdoor recreational opportunities. Central Contra Costa boasts a diverse geography of rolling hills, coastal areas, and proximity to the Pacific Ocean and San Francisco Bay.
Geographical information
Type
Tucson
Central Contra Costa
Land area
194.7 sq. miles
261.3 sq. miles
Population density
2,790.5 people per sq. mile
1,863.4 people per sq. mile
Relative area comparison
Tucson, AZ Central Contra Costa, CA
Education
Tucson is home to the University of Arizona, renowned for its research and innovation, providing a strong foundation for education in the city. There are also several reputable public and private schools. Central Contra Costa, being part of the Bay Area, boasts high-quality education thanks to a plethora of prestigious institutions, including the University of California, Berkeley.
Tucson's economy is driven by the University of Arizona, the military and the high-tech industry. The city has seen significant growth in the tech sector in recent years. Central Contra Costa makes part of the thriving Bay Area economy, with industries like technology, healthcare, and professional services prevalent.
Biggest Employers
In Tucson, some of the biggest employers include the University of Arizona, Raytheon Technologies, and Banner Health. Central Contra Costa features major employers like Chevron, John Muir Health, and Kaiser Permanente.
In Tucson (Pima County), 52.7% voted for Democrats and 45.7% for Republicans in 2012 Presidential Election. In Central Contra Costa (Contra Costa County), 66.2% voted for Democrats and 31.1% for Republicans.
Elections
Type
Democrats
Republicans
Other
Year
Tucson
Central Contra Costa
Tucson
Central Contra Costa
Tucson
Central Contra Costa
2020
58.4%
71.8%
39.8%
26.4%
1.7%
1.8%
2016
53.3%
67.5%
39.7%
24.5%
7.0%
8.0%
2012
52.7%
66.2%
45.7%
31.1%
1.6%
2.7%
2008
52.4%
68.0%
46.3%
30.2%
1.4%
1.8%
2004
52.7%
62.6%
46.7%
36.7%
0.6%
0.7%
2000
51.4%
59.0%
43.3%
37.2%
5.3%
3.8%
1996
52.2%
55.7%
39.4%
35.2%
8.5%
9.1%
Breakdown of population affiliated with a religious congregation
Type
Adherents
Congregations
Religion
Tucson
Central Contra Costa
Tucson
Central Contra Costa
CATHOLIC CHURCH
20.8%
21.8%
7.9%
5.2%
SOUTHERN BAPTIST CONVENTION
2.3%
1.3%
10.4%
10.0%
EVANGELICAL LUTHERAN CHURCH IN AMERICA
0.9%
0.5%
2.5%
2.0%
EPISCOPAL CHURCH
0.8%
0.5%
1.4%
2.3%
LUTHERAN CHURCH
0.4%
0.2%
1.4%
2.0%
SEVENTH DAY ADVENTIST CHURCH
0.3%
0.3%
1.9%
1.5%
MUSLIM ESTIMATE
0.0%
1.0%
0.2%
1.4%
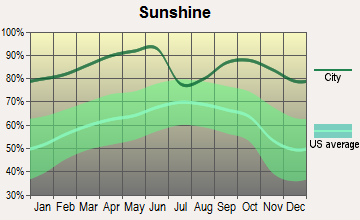
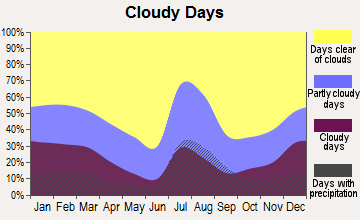
Weather
Tucson experiences a desert climate with hot summers and mild winters, making it ideal for those who love sunshine. The city has over 350 sunny days each year. On the contrary, Central Contra Costa experiences a Mediterranean climate with mild, wet winters and dry summers. It offers more variation in weather, making it suitable for those who appreciate changes in seasons.
Weather and climate
Type
Tucson
Central Contra Costa
Temperature - Average
70°F
59.1°F
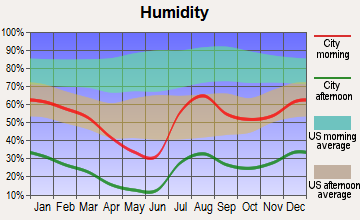
Humidity - Average morning or afternoon humidity
38.6%
82.2%
Humidity - Differences between morning and afternoon humidity
46%
29.3%
Humidity - Maximum monthly morning or afternoon humidity
58%
88.1%
Humidity - Minimum monthly morning or afternoon humidity
12%
58.8%
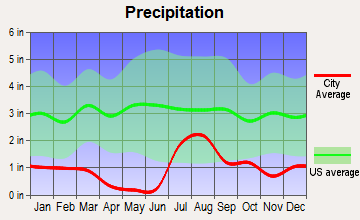
Precipitation - Yearly average
12 in
21.8 in
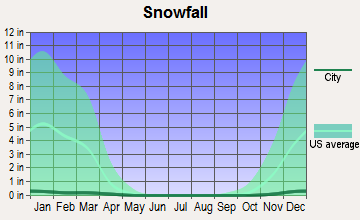
Snowfall - Yearly average
2 in
0 in
Clouds - Number of days clear of clouds
32.3%
27.7%
Sunshine amount - Average
92.8%
73.3%
Sunshine amount - Differences during a year
15%
22.4%
Sunshine amount - Maximum monthly
94%
77.2%
Sunshine amount - Minimum monthly
79%
54.7%
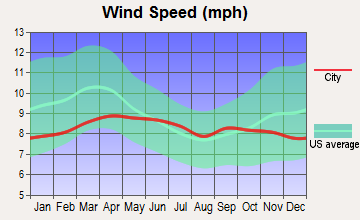
Wind speed - Average
8.3 mph
11.1 mph
Average climate in Tucson, Arizona
Average climate in Central Contra Costa, California
Air pollution
Type
AQI
CO
NO2
OZONE
PB
PM10
PM25
SO2
Year
Tucson
Central Contra Costa
Tucson
Central Contra Costa
Tucson
Central Contra Costa
Tucson
Central Contra Costa
Central Contra Costa
Tucson
Tucson
Central Contra Costa
Tucson
Central Contra Costa
2018
87
105
0.19
0.32
8.3
6.9
32.0
22.1
0.012
N/A
29.9
N/A
5.5
13.3
0.1
0.6
2017
73
102
0.18
0.30
8.4
7.0
31.7
25.9
0.008
N/A
32.2
N/A
7.1
11.9
0.1
0.7
2016
68
86
0.21
0.28
7.9
6.5
29.7
25.2
0.005
N/A
25.3
N/A
4.5
6.5
0.1
0.8
2015
62
94
0.21
0.34
8.7
7.6
29.7
25.8
0.004
N/A
25.4
N/A
5.1
8.8
0.2
0.5
2014
74
95
0.19
0.35
10.0
7.8
28.8
25.2
0.005
N/A
28.0
N/A
5.6
6.9
0.2
0.5
2013
94
93
0.17
0.34
10.4
9.3
30.4
21.5
0.004
N/A
30.9
N/A
6.8
7.8
0.2
0.5
2012
73
93
0.20
0.32
11.8
8.5
30.0
25.2
0.003
N/A
31.2
N/A
5.6
8.3
0.2
0.3
2011
81
99
0.22
0.35
11.9
9.0
31.0
23.0
0.003
N/A
29.7
N/A
5.8
9.8
0.3
0.6
2010
68
93
0.29
0.31
10.8
8.6
30.5
23.2
0.014
N/A
25.5
N/A
N/A
8.5
0.5
0.5
2009
82
104
0.25
0.31
11.2
9.5
29.2
23.7
0.006
N/A
31.9
N/A
N/A
10.3
0.5
0.6
2008
81
120
0.29
0.36
12.2
10.2
29.2
26.1
0.006
N/A
32.0
N/A
N/A
12.1
0.9
0.8
2007
75
104
0.37
0.36
13.4
10.7
28.7
24.1
0.006
N/A
27.3
N/A
N/A
9.7
0.9
0.7
2006
74
109
0.41
0.39
15.3
10.9
27.7
26.0
N/A
N/A
17.3
N/A
N/A
11.1
0.6
0.8
2005
76
104
0.43
0.43
15.1
11.6
26.0
22.7
N/A
N/A
17.8
N/A
N/A
10.4
0.7
1.0
2004
77
112
0.49
0.46
15.6
12.4
25.6
22.6
0.004
N/A
14.0
N/A
N/A
11.9
1.2
1.1
2003
81
84
0.57
0.51
17.2
13.4
27.1
23.1
N/A
N/A
19.2
N/A
N/A
N/A
1.2
0.7
2002
76
88
0.56
0.51
16.9
14.7
26.8
23.3
0.008
N/A
19.9
N/A
N/A
N/A
1.0
0.9
2001
70
90
0.55
0.56
16.4
15.4
26.1
22.1
0.008
N/A
23.2
N/A
N/A
N/A
0.8
1.2
2000
78
95
0.50
0.67
16.7
15.9
26.4
20.8
0.013
N/A
N/A
N/A
N/A
N/A
2.3
1.6
Natural disasters
Type
Tucson
Central Contra Costa
Tornado activity compared to U.S. average
8.9%
9.4%
Earthquake activity compared to U.S. average
1,584.9%
7,786.2%
Natural disasters compared to U.S. average
13%
18%
Transportation
Tucson's public transportation includes buses and a modern streetcar system serving the downtown area. Yet, most residents rely on cars for commuting. In Central Contra Costa, a network of buses and BART (Bay Area Rapid Transit) makes public transit widely accessible, in addition to the prevalent car use.
Transport
Type
Tucson
Central Contra Costa
Amtrak stations
1
0
Amtrak stations nearby
1
3
FAA registered aircraft
983
0
FAA registered aircraft manufacturers and dealers
14
0
Means of transportation to work
Type
Tucson
Central Contra Costa
Bicycle
1%
0.5%
Bus
1.9%
1%
Carpooled
11.5%
9.9%
Car alone
81.9%
72.3%
Motorcycle
0.5%
0.2%
Railroad
0%
0.8%
Subway
0%
7.7%
Walked
2.3%
1.5%
Average travel time to work
Type
Tucson
Central Contra Costa
Average
26 min
31.8 min
Real Estate
Real estate in Tucson is affordable and offers a variety of options from downtown lofts to suburban houses. Central Contra Costa's real estate market is more expensive and competitive, reflective of the Bay Area's high housing prices.
Neighborhoods
Tucson offers a mix of urban, suburban, and even rural neighborhoods, each with unique characteristics and charm. Central Contra Costa also provides a variety of neighborhoods – from suburban communities to upscale residential areas – catering to different lifestyle preferences.
Houses and residents
Type
Tucson
Central Contra Costa
Houses
242,816
183,777
Average household size (people)
2.4
2.5
Houses occupied
223,068 (91.9%)
179,136 (97.5%)
Houses occupied by owners
114,708 (51.4%)
127,889 (71.4%)
Houses occupied by renters
108,360 (48.6%)
51,247 (28.6%)
Median rent asked for vacant for-rent units
$801.80
$2,527
Median price asked for vacant for-sale houses and condos
$557,132
$1,269,474
Estimated median house or condo value
$224,800
Over $1,000,000
Median number of rooms in apartments
4
4.3
Median number of rooms in houses and condos
5.8
6.5
Renting percentage
48.1%
30.3%
Housing density (houses/condos per square mile)
1,247.3
703.4
Household income disparities
44.9%
35.9%
Housing units without a mortgage
1,087 (1.5%)
20,208 (18.2%)
Housing units with both a second mortgage and home equity loan
2,785 (3.9%)
418 (0.4%)
Housing units with a mortgage
70,054 (98.5%)
90,899 (81.8%)
Housing units with a home equity loan
211 (0.3%)
13,612 (12.3%)
Housing units with a second mortgage
4,051 (5.7%)
13,614 (12.3%)
Housing units lacking complete kitchen facilities
1.2%
0.5%
Housing units lacking complete plumbing facilities
Self-employed workers in own not incorporated business
14,487
22,217
State government workers
17,981
6,705
Unpaid family workers
709
617
Industries and Occupations
Major industries in Tucson include education, healthcare, and technology, with many working in these sectors. In contrast, Central Contra Costa sees a dominance of industries like technology, healthcare, and professional services, offering diverse job opportunities for those in these fields.
Tucson has quality healthcare facilities including Banner University Medical Center and Tucson Medical Center. Central Contra Costa also has quality healthcare facilities including John Muir Health and Kaiser Permanente.
Health (county statistics)
Type
Tucson
Central Contra Costa
General health status score of residents in this county from 1 (poor) to 5 (excellent)
Tucson has a growing infrastructure, with plans for continual improvement. The city is working towards developing its downtown area, public transportation, and other facilities. Central Contra Costa showcases well-developed infrastructure, with well-maintained roads, public facilities, and urban planning.
Infrastructure
Type
Tucson
Central Contra Costa
TV stations
20
24
Culture and Food
Tucson's culture is enriched by its Mexican heritage, reflected in its vibrant food scene, arts, and festivals. Central Contra Costa, with its proximity to San Francisco, offers a diverse cultural experience with a variety of cuisines, cultural events, and music festivals.
Sports Teams
Tucson houses several minor league teams and the sports teams of the University of Arizona. Central Contra Costa, within reach of San Francisco and Oakland, offers access to major league teams such as the San Francisco Giants (MLB), Golden State Warriors (NBA), and the San Francisco 49ers (NFL).
 Tucson, AZ
 Central Contra Costa, CA