Comparing Upper San Gabriel Valley to Ontario, California, both areas have their unique attributes and distinct lifestyle nuances. Where San Gabriel Valley is characterized for natural beauty and lower crime rates, Ontario prides itself on its vibrant economy and rich history. This comparison explores key elements such as crime and safety, weather, cost of living, education, economy, infrastructure, employment, real estate, neighborhoods, commuting, taxes, culture and food, sports, geography, and health care.
Upper San Gabriel Valley is generally safer than Ontario, with lower crime rates. Ontario hosts an overall crime rate higher than the national average, with property crimes being statistically higher than violent crimes. It's advisable for residents and tourists to be aware of their surroundings, particularly in densely populated areas.
Cost of Living
Upper San Gabriel Valley is generally more expensive than Ontario when considering the overall cost of living. Factors like housing, groceries, utilities, and transportation contribute to San Gabriel's higher living cost index.
Income Tax
California State's income tax rates apply uniformly across all cities, but high-income individuals could pay marginal rates of up to 13.3%.
Property Tax
Property taxes vary between the two cities but generally tend to be higher in Upper San Gabriel Valley due to the higher value of properties.
Sales Tax
Sales tax in both areas is 9.5%, comparatively high in line with the California state average.
Income
Type
Upper San Gabriel Valley
Ontario
Estimated median household income
$80,436
$73,872
Estimated per capita income
$33,562
$28,662
Cost of living index (U.S. average is 100)
159.5
84.1
If you make $50,000 in Ontario, you will have to make $94,828 in Upper San Gabriel Valley to maintain the same standard of living.
Geographical Conditions
San Gabriel Valley is notable for its stunning geography, distinguished by rolling hills, hiking trails, and natural attractions. Ontario, however, is mostly flat and urbanized.
Geographical information
Type
Upper San Gabriel Valley
Ontario
Land area
49.4 sq. miles
49.8 sq. miles
Population density
6,624.2 people per sq. mile
3,574.7 people per sq. mile
Relative area comparison
Upper San Gabriel Valley, CA Ontario, CA
Education
In terms of education, both areas have a good number of public and private schools serving their populations. However, Upper San Gabriel Valley stands out with higher-rated schools overall and has a few notable independent schools within the vicinity.
Ontario sports a diversified economy, with significant contributions from logistics, healthcare, retail, and manufacturing sectors. The San Gabriel Valley, while diversified, leans towards healthcare, retail trades, and professional services.
Biggest Employers
Ontario hosts the Ontario International Airport, one of the region's biggest employers, leading in the logistics industry. The City of Hope National Medical Center is a significant employer within the Upper San Gabriel Valley, together with various educational institutions.
In Upper San Gabriel Valley (Los Angeles County), 69.7% voted for Democrats and 27.8% for Republicans in 2012 Presidential Election. In Ontario (San Bernardino County), 52.3% voted for Democrats and 45.0% for Republicans.
Elections
Type
Democrats
Republicans
Other
Year
Upper San Gabriel Valley
Ontario
Upper San Gabriel Valley
Ontario
Upper San Gabriel Valley
Ontario
2020
71.0%
54.2%
26.9%
43.6%
2.1%
2.2%
2016
72.0%
52.1%
22.5%
41.5%
5.5%
6.4%
2012
69.7%
52.3%
27.8%
45.0%
2.4%
2.6%
2008
69.2%
52.2%
28.8%
45.8%
1.9%
2.0%
2004
63.3%
43.8%
35.7%
55.6%
1.0%
0.6%
2000
63.6%
47.3%
32.4%
48.8%
4.0%
3.9%
1996
59.3%
44.4%
31.0%
43.6%
9.7%
12.1%
Breakdown of population affiliated with a religious congregation
Type
Adherents
Congregations
Religion
Upper San Gabriel Valley
Ontario
Upper San Gabriel Valley
Ontario
CATHOLIC CHURCH
36.1%
21.9%
4.7%
4.3%
SOUTHERN BAPTIST CONVENTION
1.0%
2.2%
9.0%
9.6%
MUSLIM ESTIMATE
0.7%
0.6%
1.0%
1.1%
AMERICAN BAPTIST CHURCHES IN THE USA
0.5%
0.3%
3.1%
1.6%
SEVENTH DAY ADVENTIST CHURCH
0.5%
1.6%
2.4%
4.6%
EPISCOPAL CHURCH
0.4%
0.1%
1.4%
1.3%
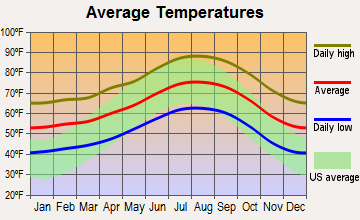
Weather
Both regions enjoy a Mediterranean climate, characterized by warm summers and mild winters. However, temperatures in Ontario get notably hotter during summer. On the other hand, the San Gabriel Valley has more moderate and comfortable temperatures year-round.
Weather and climate
Type
Upper San Gabriel Valley
Ontario
Temperature - Average
63.5°F
64.1°F
Humidity - Average morning or afternoon humidity
62.2%
65.5%
Humidity - Differences between morning and afternoon humidity
17.3%
20.4%
Humidity - Maximum monthly morning or afternoon humidity
67%
71.9%
Humidity - Minimum monthly morning or afternoon humidity
49.7%
51.5%
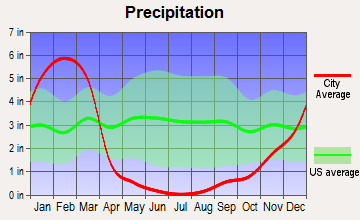
Precipitation - Yearly average
24.3 in
18.4 in
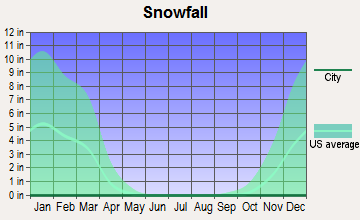
Snowfall - Yearly average
0 in
0 in
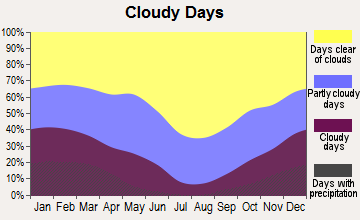
Clouds - Number of days clear of clouds
29.4%
27.6%
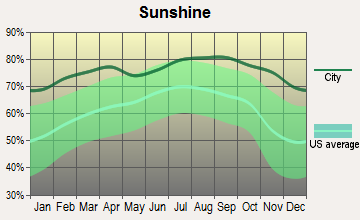
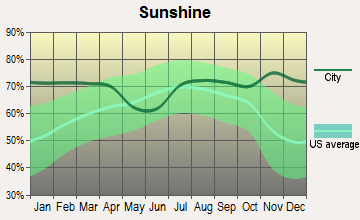
Sunshine amount - Average
78.4%
78.4%
Sunshine amount - Differences during a year
22%
21.9%
Sunshine amount - Maximum monthly
85%
84.8%
Sunshine amount - Minimum monthly
63%
62.9%
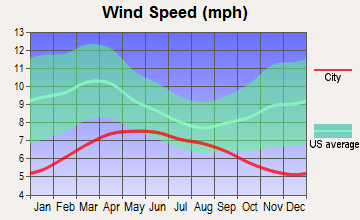
Wind speed - Average
2.6 mph
4 mph
Average climate in Upper San Gabriel Valley, California
Average climate in Ontario, California
Air pollution
Type
AQI
CO
NO2
OZONE
PB
PM10
PM25
SO2
Year
Upper San Gabriel Valley
Ontario
Upper San Gabriel Valley
Ontario
Upper San Gabriel Valley
Ontario
Upper San Gabriel Valley
Ontario
Upper San Gabriel Valley
Ontario
Upper San Gabriel Valley
Ontario
Upper San Gabriel Valley
Ontario
Upper San Gabriel Valley
Ontario
2018
142
152
0.37
0.37
14.2
15.4
28.5
28.3
0.007
0.006
28.5
35.4
14.1
15.2
0.4
0.4
2017
146
153
0.36
0.43
15.1
15.9
29.8
31.2
0.007
0.005
31.2
35.5
14.0
16.4
0.5
0.2
2016
136
140
0.33
0.39
15.5
16.6
28.1
31.1
0.007
0.006
28.6
29.5
13.0
16.7
0.4
0.3
2015
143
148
0.33
0.37
15.2
16.3
28.4
30.7
0.007
0.005
28.4
31.1
15.2
16.0
0.3
0.3
2014
141
145
0.35
0.36
16.7
17.2
28.0
29.1
0.007
0.006
31.3
33.4
14.9
17.4
0.5
0.3
2013
144
145
0.39
0.34
17.3
18.4
26.6
27.0
0.007
0.006
29.3
33.9
14.4
16.2
0.4
0.4
2012
148
148
0.43
0.39
18.2
19.2
25.9
27.7
0.006
0.006
28.7
34.3
16.5
18.2
0.5
0.5
2011
146
147
0.47
0.39
19.1
19.6
24.8
26.5
0.008
0.007
28.9
32.5
17.6
20.5
0.5
0.5
2010
133
143
0.48
0.41
19.2
20.2
24.6
27.8
0.011
0.008
27.0
29.8
15.5
18.7
0.5
1.1
2009
153
153
0.39
0.39
21.0
22.5
25.4
27.4
0.011
0.008
32.0
27.7
17.2
19.3
0.4
1.1
2008
155
161
0.54
0.45
23.1
22.9
24.9
27.8
0.013
0.009
32.1
31.3
16.9
18.3
0.6
1.4
2007
135
137
0.55
0.55
24.6
26.6
23.1
25.7
0.016
0.011
N/A
N/A
N/A
N/A
1.0
1.7
2006
128
127
0.58
0.61
24.9
29.1
22.8
25.3
0.009
0.007
N/A
N/A
N/A
N/A
1.5
1.7
2005
128
133
0.61
0.64
25.4
29.7
21.3
22.3
0.015
0.012
N/A
N/A
N/A
N/A
1.7
2.5
2004
134
142
0.71
0.70
26.0
29.0
23.8
22.9
0.018
0.012
N/A
N/A
N/A
N/A
2.4
1.7
2003
143
141
0.89
0.55
30.7
32.8
23.3
22.3
0.025
0.019
N/A
N/A
N/A
N/A
1.6
1.2
2002
137
136
0.91
0.48
32.5
34.7
21.9
22.1
0.022
0.018
N/A
N/A
N/A
N/A
2.2
0.9
2001
143
145
1.04
1.00
33.1
35.6
20.1
21.0
0.031
0.034
N/A
N/A
N/A
N/A
2.3
1.2
2000
151
153
1.07
1.05
33.5
37.0
20.1
21.1
0.028
0.038
N/A
N/A
N/A
N/A
1.3
1.8
Natural disasters
Type
Upper San Gabriel Valley
Ontario
Tornado activity compared to U.S. average
18%
18.1%
Earthquake activity compared to U.S. average
7,264.5%
7,358.4%
Natural disasters compared to U.S. average
57%
46%
Transportation
Both areas enjoy an array of public transit options, but Ontario enjoys an edge due to the Ontario International Airport and its strategic positioning close to numerous freeways.
Transport
Type
Upper San Gabriel Valley
Ontario
Amtrak stations
0
1
Amtrak stations nearby
3
3
FAA registered aircraft
0
56
FAA registered aircraft manufacturers and dealers
0
4
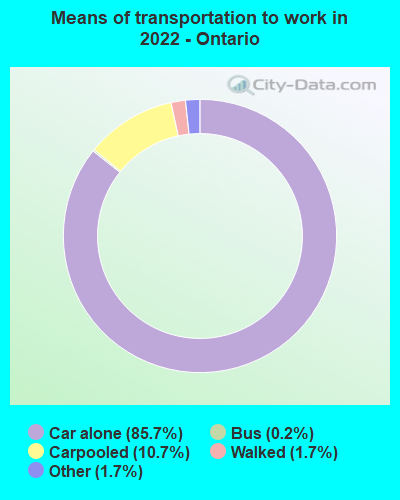
Means of transportation to work
Type
Upper San Gabriel Valley
Ontario
Bicycle
1.1%
0.1%
Bus
3.9%
0.8%
Carpooled
16.6%
12.4%
Car alone
71.1%
84.9%
Motorcycle
0.1%
0.1%
Railroad
0.1%
0.6%
Streetcar
0.1%
0.1%
Taxicab
0.1%
0%
Walked
3.2%
0.8%
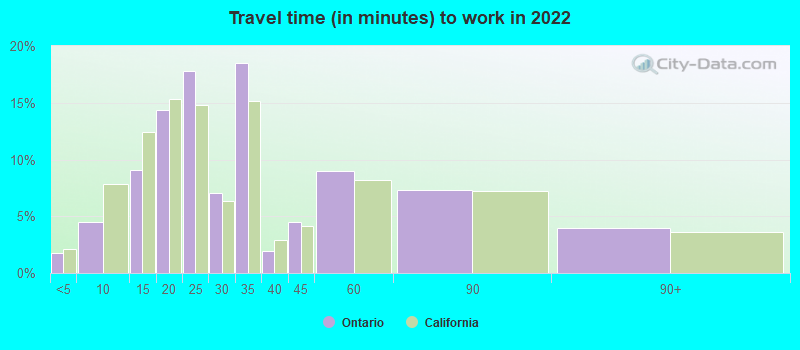
Average travel time to work
Type
Upper San Gabriel Valley
Ontario
Average
29.1 min
33.4 min
Real Estate
Real estate is generally more expensive in Upper San Gabriel Valley than in Ontario, which is owing to the higher cost of living and the vicinity's leafy neighborhoods.
Neighborhoods
Upper San Gabriel Valley is composed of several upscale neighborhoods, such as Arcadia and Pasadena. Ontario, being more affordable, attracts a more diverse population, resulting in a variety of neighborhood dynamics, both upscale and working-class.
Houses and residents
Type
Upper San Gabriel Valley
Ontario
Houses
99,295
57,356
Average household size (people)
3.3
3.6
Houses occupied
96,186 (96.9%)
55,819 (97.3%)
Houses occupied by owners
52,398 (54.5%)
32,424 (58.1%)
Houses occupied by renters
43,788 (45.5%)
23,395 (41.9%)
Median rent asked for vacant for-rent units
$1,771
$1,608
Median price asked for vacant for-sale houses and condos
$1,138,428
$368,754
Estimated median house or condo value
$740,686
$545,200
Median number of rooms in apartments
3.7
4.2
Median number of rooms in houses and condos
5.9
5.8
Renting percentage
44.9%
44.7%
Housing density (houses/condos per square mile)
2,008.8
1,152.1
Household income disparities
44%
41.4%
Housing units without a mortgage
11,525 (24.8%)
312 (1.3%)
Housing units with both a second mortgage and home equity loan
137 (0.3%)
875 (3.5%)
Housing units with a mortgage
34,867 (75.2%)
24,570 (98.7%)
Housing units with a home equity loan
3,133 (6.8%)
245 (1%)
Housing units with a second mortgage
4,036 (8.7%)
1,316 (5.3%)
Housing units lacking complete kitchen facilities
1.5%
2%
Housing units lacking complete plumbing facilities
Self-employed workers in own not incorporated business
10,209
5,269
State government workers
3,180
3,109
Unpaid family workers
401
0
Industries and Occupations
While the healthcare sector dominates in Upper San Gabriel Valley, Ontario's employment landscape is more diverse, with manufacturing, logistics, and retail trade leading its industries.
Both areas offer high-quality health care, with numerous hospitals and clinics serving their populations. City of Hope National Medical Center in Upper San Gabriel Valley is nationally recognized, and San Antonio Regional Hospital serves Ontario.
Health (county statistics)
Type
Upper San Gabriel Valley
Ontario
General health status score of residents in this county from 1 (poor) to 5 (excellent)
Ontario has a well-developed infrastructure, bolstered by robust logistics due to its proximity to the Los Angeles area's logistics hub. Upper San Gabriel Valley, though developed, generally leans towards residential and commercial infrastructures, as opposed to industrial infrastructure.
Infrastructure
Type
Upper San Gabriel Valley
Ontario
TV stations
27
10
Culture and Food
Both regions boast a rich blend of cultures, represented by their diverse food scenes. San Gabriel Valley is well known for its authentic Asian cuisine, while Ontario features a mix of cuisines, including Mexican and American classics.
Sports Teams
While neither area hosts a major league sports team, they both enjoy the proximity to Los Angeles, home of the Lakers, Clippers, Rams, Dodgers, and Kings.
 Upper San Gabriel Valley, CA
 Ontario, CA