Washington, DC, the nation's capital, and Fayetteville, NC, have unique attributes attracting different groups of people. DC is a power center, thriving on a robust economy, with a melting pot of cultures, while Fayetteville, known for its military base, has an appealing lower cost of living and a slower pace. Here's a detailed comparison considering multiple factors to help you understand the two cities' unique lifestyles.
Distance between
Washington, DC and
Fayetteville, NC : 285.8 miles
Washington's population is larger by 221%. Its population has grown by 97,991 people (17.1%) since 2000. The population of Fayetteville has grown by 87,763 people (72.5%) during that time.
Washington DC and Fayetteville both struggle with crime rates above the US average, however, DC’s rates are significantly higher. DC reported approximately 60% more crimes than Fayetteville in recent years. DC is also home to more varied crimes given its larger population. Both cities have taken steps to curb crime with some success, but crime remains a significant issue to consider.
City-data.com crime index counts serious crimes and violent crime more heavily. It adjusts for the number of visitors and daily workers commuting into cities. (higher means more crime, U.S. average = 301.1)
City-data.com crime index counts serious crimes and violent crime more heavily. It adjusts for the number of visitors and daily workers commuting into cities. (higher means more crime, U.S. average = 301.1)
Sex Offenders
According to our data, there are 1,072 registered sex offenders living in Washington and 610 registered sex offenders living in . The ratio of residents to sex offenders in Washington is 635 to 1; the ratio in Fayetteville is 336 to 1. The number of registered sex offenders compared to the number of residents is a smaller in Washington than in Fayetteville.
Cost of Living
Cost of living significantly differs between the two cities. DC is one of the most expensive places to live in the US with high housing costs being the primary driver. Fayetteville, however, has a cost of living index below the national average, attributed mainly to affordable housing, making it a more viable option for those seeking economic reprieve.
Income Tax
DC levies progressive income taxes, with rates ranging from 4% to 8.95%. North Carolina has a flat income tax rate of 5.25%.
Property Tax
DC's residential property tax rate is 0.85%, lower than the national average. Fayetteville's property tax rate is higher at 1.35%, but the area's low property prices balance this out in comparison.
Sales Tax
DC has a 6% sales tax, among the highest in the US. Fayetteville, in North Carolina, has a lower rate of 4.75%.
Income
Type
Washington
Fayetteville
Estimated median household income
$90,088
$51,629
Estimated per capita income
$65,808
$27,983
Cost of living index (U.S. average is 100)
124.2
88.7
If you make $50,000 in Fayetteville, you will have to make $70,011 in Washington to maintain the same standard of living.
Geographical Conditions
DC's terrain is relatively flat and lies along the Anacostia and Potomac Rivers. Fayetteville, located in the Sandhills region of North Carolina, has more diversely varied elevations and landscapes.
Washington DC hosts prestigious universities like Georgetown and George Washington University, along with high ranked primary and secondary schools. Fayetteville also holds commendable educational institutions like Fayetteville State University and good public schools, but DC has an edge in education due to the number of options available.
DC's economy is driven by the federal government, featuring strong sectors in education, healthcare, and tech. Fayetteville's economy is heavily tied to Fort Bragg, the largest military installation in the world. Despite a smaller job market, Fayetteville has shown economic resilience due to the steady flow of military and defense spending.
Biggest Employers
The Federal Government is DC’s largest employer. For Fayetteville, the Department of Defense, through Fort Bragg, is the biggest employer. This difference significantly influences the local economy and job prospects in both cities.
There were 376 building permits issued in Washington in 2012 (149 more than in 2011) compared to 337 building permits issued in Fayetteville in 2012 (181 less than in 2011).
In Washington (District of Columbia), 90.9% voted for Democrats and 7.3% for Republicans in 2012 Presidential Election. In Fayetteville (Cumberland County), 59.5% voted for Democrats and 39.8% for Republicans.
Elections
Type
Democrats
Republicans
Other
Year
Washington
Fayetteville
Washington
Fayetteville
Washington
Fayetteville
2020
92.6%
57.6%
5.4%
41.0%
2.0%
1.4%
2016
90.9%
56.2%
4.1%
40.2%
5.0%
3.6%
2012
90.9%
59.5%
7.3%
39.8%
1.8%
0.7%
2008
92.5%
58.7%
6.5%
41.0%
1.0%
0.3%
2004
89.6%
48.1%
9.4%
51.6%
1.0%
0.3%
2000
85.2%
50.1%
9.0%
49.4%
5.9%
0.5%
1996
85.2%
49.2%
9.3%
44.8%
5.5%
5.9%
Breakdown of population affiliated with a religious congregation
Type
Adherents
Congregations
Religion
Washington
Fayetteville
Washington
Fayetteville
CATHOLIC CHURCH
12.6%
2.8%
7.4%
1.6%
AMERICAN BAPTIST CHURCHES IN THE USA
6.2%
1.7%
10.3%
0.2%
SOUTHERN BAPTIST CONVENTION
4.4%
10.8%
10.3%
19.5%
EPISCOPAL CHURCH
3.1%
0.5%
5.3%
1.4%
SEVENTH DAY ADVENTIST CHURCH
0.9%
0.4%
1.8%
0.7%
MUSLIM ESTIMATE
0.7%
0.1%
1.1%
0.5%
EVANGELICAL LUTHERAN CHURCH IN AMERICA
0.5%
0.1%
2.1%
0.2%
Weather
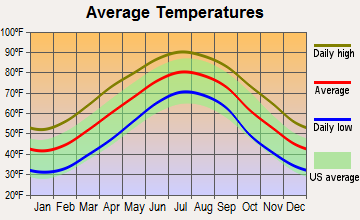
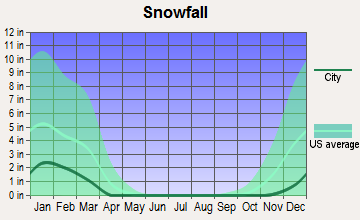
The climate of the two cities is quite distinct. Fayetteville experiences milder weather with warm, wet summers and cool winters. Washington DC, on the other hand, has hot, humid summers, and cold, snowy winters. Tourists and potential residents should take into account these weather characteristics when considering either destination.
Weather and climate
Type
Washington
Fayetteville
Temperature - Average
56.4°F
61.4°F
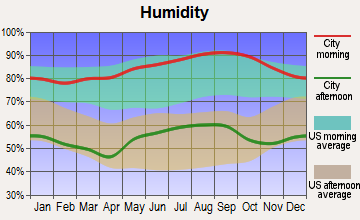
Humidity - Average morning or afternoon humidity
68.8%
74.1%
Humidity - Differences between morning and afternoon humidity
33%
42.8%
Humidity - Maximum monthly morning or afternoon humidity
81%
89.5%
Humidity - Minimum monthly morning or afternoon humidity
48%
46.7%
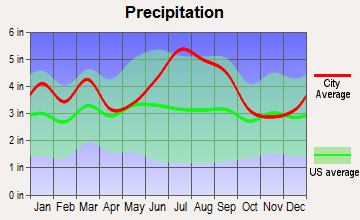
Precipitation - Yearly average
42.7 in
46.8 in
Snowfall - Yearly average
32.4 in
11.3 in
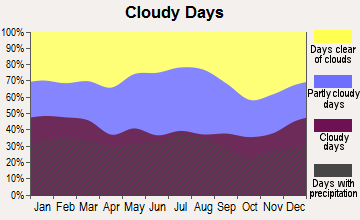
Clouds - Number of days clear of clouds
15.9%
18.4%
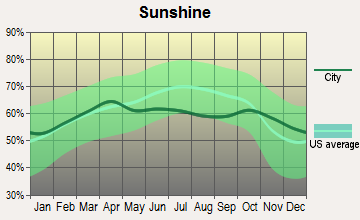
Sunshine amount - Average
61.5%
64.9%
Sunshine amount - Differences during a year
21%
13.1%
Sunshine amount - Maximum monthly
66%
65.7%
Sunshine amount - Minimum monthly
45%
52.6%
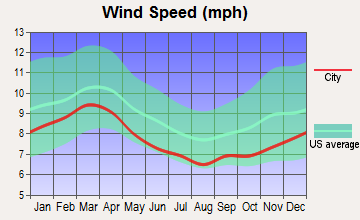
Wind speed - Average
9.7 mph
7.5 mph
Average climate in Washington, District of Columbia
Average climate in Fayetteville, North Carolina
Air pollution
Type
AQI
CO
NO2
OZONE
PB
PM10
PM25
SO2
Year
Washington
Fayetteville
Washington
Washington
Washington
Fayetteville
Washington
Washington
Fayetteville
Washington
Fayetteville
Washington
Fayetteville
2018
88
61
0.32
N/A
11.6
N/A
23.2
29.1
N/A
N/A
16.4
11.5
8.8
7.4
0.8
0.4
2017
84
67
0.32
N/A
12.3
N/A
24.9
32.9
N/A
N/A
16.5
11.5
9.8
9.0
1.0
N/A
2016
98
68
0.43
N/A
14.7
N/A
24.6
31.5
0.002
N/A
17.2
11.8
9.5
8.7
1.0
N/A
2015
91
60
0.34
N/A
14.8
N/A
26.2
29.5
0.002
N/A
17.0
N/A
10.4
7.1
1.3
0.1
2014
85
65
0.33
N/A
11.6
N/A
25.9
33.0
0.002
N/A
17.1
N/A
10.0
8.9
1.0
N/A
2013
88
65
0.34
N/A
11.7
N/A
25.6
28.4
0.002
N/A
17.3
N/A
11.6
8.5
1.0
N/A
2012
103
74
0.58
N/A
15.2
N/A
27.6
31.0
0.002
N/A
N/A
N/A
12.2
9.1
1.6
0.1
2011
105
80
0.67
N/A
15.4
N/A
27.7
33.9
0.002
N/A
N/A
N/A
11.4
10.7
3.1
N/A
2010
114
86
0.88
N/A
15.9
N/A
29.3
34.7
0.003
N/A
N/A
N/A
9.3
10.6
3.4
N/A
2009
90
75
0.86
N/A
16.2
N/A
24.4
31.1
0.002
N/A
N/A
N/A
7.6
10.5
4.6
1.1
2008
103
88
1.23
N/A
16.2
N/A
25.3
32.9
0.003
N/A
N/A
N/A
8.5
12.3
5.6
N/A
2007
113
93
1.17
N/A
16.8
N/A
27.1
35.5
0.004
N/A
N/A
N/A
10.4
13.7
5.1
N/A
2006
114
96
1.11
N/A
17.2
N/A
25.5
31.5
0.004
N/A
N/A
N/A
10.9
14.7
4.5
2.2
2005
105
125
0.86
N/A
20.5
N/A
22.7
34.5
0.006
N/A
N/A
N/A
11.7
N/A
4.5
N/A
2004
113
92
0.62
N/A
21.3
N/A
20.6
30.2
0.004
N/A
N/A
N/A
11.3
N/A
6.5
N/A
2003
108
92
0.90
N/A
23.6
N/A
20.8
31.9
N/A
N/A
N/A
N/A
12.2
N/A
8.3
N/A
2002
125
87
1.16
N/A
23.7
N/A
25.0
34.6
N/A
N/A
N/A
N/A
N/A
N/A
6.7
1.9
2001
113
124
1.07
N/A
23.9
N/A
22.0
36.3
0.017
N/A
N/A
N/A
N/A
N/A
6.7
N/A
2000
115
117
1.17
N/A
20.2
N/A
19.1
36.5
N/A
N/A
N/A
N/A
N/A
N/A
8.2
N/A
Natural disasters
Type
Washington
Fayetteville
Tornado activity compared to U.S. average
110.6%
112.7%
Earthquake activity compared to U.S. average
42.9%
49.2%
Natural disasters compared to U.S. average
19%
15%
Transportation
DC has an efficient public transportation system, including the Metrorail and Metrobus, and extensive facilities for cyclists. Fayetteville's transportation needs are catered to by the Fayetteville Area System of Transit (FAST), which is less extensive but continues to grow.
Transport
Type
Washington
Fayetteville
Amtrak stations
1
1
Amtrak stations nearby
3
1
FAA registered aircraft
456
110
FAA registered aircraft manufacturers and dealers
3
4
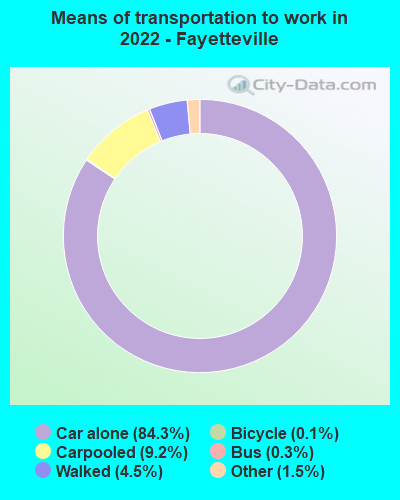
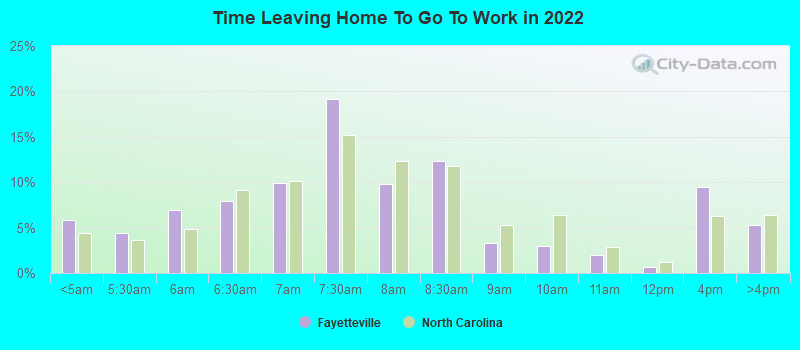
Means of transportation to work
Type
Washington
Fayetteville
Bicycle
2%
0.1%
Bus
6.3%
0.3%
Carpooled
7.8%
6.5%
Car alone
62.5%
87.8%
Motorcycle
0.1%
0.3%
Railroad
0.3%
0%
Streetcar
10.6%
0%
Subway
1.3%
0%
Taxicab
0.8%
0.2%
Walked
5.7%
4%
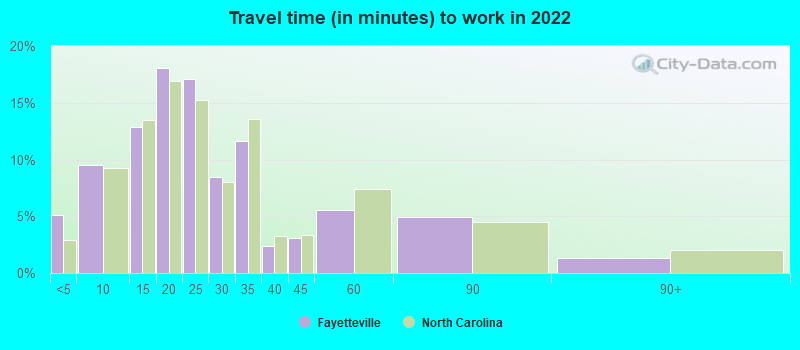
Average travel time to work
Type
Washington
Fayetteville
Average
39.2 min
24.4 min
Other means
26 min
21 min
Public transportation
38.9 min
42.6 min
Private vehicle occupancy
Type
Washington
Fayetteville
Average
1.1
1.1
Drove alone
89.4%
90.8%
In 2 person carpool
9.7%
7%
In 3 person carpool
0.6%
1.8%
In 4 person carpool
0.4%
0.1%
In 7+ person carpool
0%
0.2%
How many people usually rode to work in the car, truck or van.
Real Estate
The real estate market in DC is robust and expensive due to high demand, whereas in Fayetteville, housing is more affordable. Market conditions make investing and owning property more financially feasible in Fayetteville than in DC.
Neighborhoods
DC is divided into distinct neighborhoods with unique vibes, from historic Georgetown to hip Shaw. Fayetteville offers residential areas with a slower pace, like Haymount, and some with military influence, such as Fort Bragg.
Houses and residents
Type
Washington
Fayetteville
Houses
357,482
91,054
Average household size (people)
2.1
2.5
Median year apartment built
1965
1987
Median year house/condo built
1941
1982
Length of stay in the house since moving in
13.5 years
13.6 years
Houses occupied
319,565 (89.4%)
83,147 (91.3%)
Houses occupied by owners
132,936 (41.6%)
38,079 (45.8%)
Houses occupied by renters
186,629 (58.4%)
45,068 (54.2%)
Median rent asked for vacant for-rent units
$2,791
$571.42
Median monthly housing costs
$1,817
$1,041
Median price asked for vacant for-sale houses and condos
$996,150
$86,536
Estimated median house or condo value
$669,900
$150,200
Median numbers of rooms
3.8
5.4
Median number of rooms in apartments
3.1
4.4
Median number of rooms in houses and condos
6
6.4
Median house price - detached houses
Over $1,000,000
$214,819
Median house price - in 2-unit structures
Over $1,000,000
$152,480
Median house price - in 3-to-4-unit structures
$471,443
$234,147
Median house price - in 5 or more unit structures
$527,983
$194,723
Median house price - Townhouses or other attached units
$817,288
$236,623
Median house price - All housing units
$790,542
$214,671
Median house age
65
38
Renting percentage
58%
49.7%
Housing density (houses/condos per square mile)
5,821.9
1,549.4
House value disparities
26.7%
32.9%
Household income disparities
45.7%
43.4%
Median household income for houses/condes with a mortgage
$163,111
$73,385
Median household income for apartments without a mortgage
$108,852
$56,188
Housing units without a mortgage
777 (0.8%)
726 (2.8%)
Housing units with both a second mortgage and home equity loan
8,586 (8.5%)
593 (2.3%)
Housing units with a mortgage
100,122 (99.2%)
25,293 (97.2%)
Housing units with a home equity loan
1,057 (1%)
67 (0.3%)
Housing units with a second mortgage
12,793 (12.7%)
1,240 (4.8%)
House/condo owner moved in on average (years ago)
10
12
House/condo renter moved in on average (years ago)
1
1
Housing units lacking complete kitchen facilities
1.5%
1.1%
Housing units lacking complete plumbing facilities
1.5%
1.6%
Housing units in structures
Housing units in structures
Washington
Fayetteville
One, detached
11.2%
60.8%
One, attached
22.2%
2.8%
Two
2.7%
4.2%
3 or 4
6.8%
5.2%
5 to 9
7.3%
8.9%
10 to 19
8.5%
8.5%
20 to 49
7.6%
5.0%
50 or more
33.6%
1.9%
Mobile homes
0.2%
2.8%
Median real estate property taxes paid for housing units
Self-employed workers in own not incorporated business
16,654
3,292
State government workers
6,699
4,673
Unpaid family workers
580
78
Industries and Occupations
Fayetteville is predominantly military-oriented, with other industries like healthcare, retail, and education playing secondary roles. Washington DC has a diverse workforce spanning government, professional services, education, and healthcare fields.
Both cities have good health care facilities. DC is home to a number of top-ranked hospitals including MedStar Georgetown University Hospital. Similarly, Fayetteville's Cape Fear Valley Health System is highly respected.
Health (county statistics)
Type
Washington
Fayetteville
General health status score of residents in this county from 1 (poor) to 5 (excellent)
DC boasts a vibrant infrastructure with exceptional amenities, historical monuments, and a well-developed public transit system. Fayetteville's infrastructure is less extensive but effective, with city projects consistently focused on improving road networks and amenities for residents.
Infrastructure
Type
Washington
Fayetteville
Hospitals
114
16
TV stations
27
19
Arenas or stadiums
4
1
Bank branches located here
247
50
Bank institutions located here
34
13
Drinking water stations with no reported violations in the past
5
4
Drinking water stations with reported violations in the past
HMDA - Conventional home purchase loans - Applications denied
Year
Washington
Fayetteville
1999
1,328
1,353
2000
1,438
808
2001
935
603
2002
886
393
2003
1,319
355
2004
2,281
334
2005
2,920
401
2006
3,362
431
2007
2,548
299
2008
1,095
126
2009
514
93
Culture and Food
DC is renowned for its international dining scene, with a blend of cuisines from all over the world. Fayetteville offers comfort food rooted in Southern traditions, with barbecues and other regional delicacies being crowd favorites.
Sports Teams
DC is home to notable teams in all the top four American sports leagues, including the Washington Nationals (MLB), Washington Capitals (NHL), Washington Football Team (NFL), and Washington Wizards (NBA). Fayetteville, with its minor league baseball, lacks DC's sporting reputation.


 Washington, DC
 Fayetteville, NC