Washington, DC vs Kansas City, MO - Advanced U.S. city comparison tool

Washington, DC vs Kansas City, MO

Although both Washington, DC, and Kansas City, MO are vibrant and unique cities known for their rich cultural heritage and attractive lifestyle, they cater to different lifestyles with their own distinctive attributes. When you compare the two cities, you'll find that the cost of living, crime rate, climate, educational opportunities, industries, job markets, and infrastructures are quite different and provide unique benefits. Every individual or family might lean toward one or the other depending on their personal needs and preferences.
 
 
Distance between Washington, DC and Kansas City, MO : 940.6 miles

Washington's population is larger by 32%. Its population has grown by 97,991 people (17.1%) since 2000. The population of Kansas City has grown by 66,849 people (15.1%) during that time.

Population
Type Washington Kansas City
Population 670,050 508,394
Female / male percentage 52.4% / 47.6%
52.4%
47.6%
52.4% / 47.6%
52.4%
47.6%
Racial makeup - percentage
Ethnicity WashingtonKansas City
Black 42.7% 24.5%
White Non-Hispanic 36.4% 56.5%
Hispanic 11.5% 11.1%
Two or more 4.7% 4.4%
Asian 4.0% 2.6%
American Indian 0.0% 0.1%
Pacific Islander 0.0% 0.2%
Racial makeup - absolute values
Ethnicity WashingtonKansas City
Black 285,945 124,488
White Non-Hispanic 244,063 287,015
Hispanic 76,919 56,483
Two or more 31,528 22,523
Asian 26,908 13,118
American Indian 277 686
Pacific Islander 86 889

Crime and Safety

Safety is a significant concern for both residents and tourists. Washington DC, being the nation's capital, has a higher crime rate compared to the national average. While the city has made substantial efforts to curb crime, it remains a concern, especially in certain areas. Kansas City, on the other hand, also deals with crime but its rate is slightly lower than Washington DC's. It's essential to research and understand the specific areas in both cities before making a decision.

Crime by year per 100,000 residents
Type City-data.com crime indexRobberies per 100,000Murders per 100,000Rapes per 100,000Assaults per 100,000Burglaries per 100,000Theft per 100,000Auto theft per 100,000Arson per 100,000
Year WashingtonKansas CityWashingtonKansas CityWashingtonKansas CityWashingtonKansas CityWashingtonKansas CityWashingtonKansas CityWashingtonKansas CityWashingtonKansas CityWashingtonKansas City
2020 462.8 671.9 309.8 257.3 27.8 35.2 43.1 76.5 577.3 1,216.8 275.4 615.2 2,683.2 2,595.1 472.8 909.2 0.0 36.0
2019 490.9 629.7 334.3 294.8 23.5 30.6 48.5 75.0 570.9 1,061.4 260.7 628.5 3,659.5 2,521.8 325.6 784.9 0.0 32.7
2018 490.9 688.8 307.1 333.0 22.8 28.8 63.3 87.4 548.2 1,154.5 254.3 757.6 3,652.6 2,716.6 362.9 859.4 0.0 43.8
2017 480.7 755.4 338.8 389.1 16.7 31.6 63.8 100.8 529.4 1,233.7 260.5 965.3 3,529.0 2,683.6 366.7 915.2 0.0 42.1
2016 568.6 711.5 462.3 397.6 20.1 27.4 77.4 88.6 572.1 1,143.1 346.5 998.4 3,876.0 2,548.5 425.6 826.8 0.0 39.3
2015 591.5 653.5 506.4 361.2 24.1 23.2 73.5 80.9 598.6 957.4 442.0 1,032.4 3,599.1 2,601.1 475.1 826.2 0.0 42.0
2014 596.2 634.2 490.4 347.1 15.9 16.9 71.3 88.0 607.7 805.9 525.6 1,214.3 3,928.0 2,800.9 559.0 847.1 0.0 46.3
2013 583.4 666.7 566.2 357.9 15.9 21.3 60.8 84.2 576.1 798.9 512.6 1,361.1 3,574.6 3,010.7 486.8 924.6 0.0 44.5
2012 566.2 662.0 589.1 355.1 13.9 22.6 37.3 55.4 537.5 835.9 556.5 1,508.8 3,510.2 3,272.5 561.3 777.5 7.9 56.5
2011 565.0 651.6 607.8 362.1 17.5 23.4 27.8 58.9 477.2 759.3 622.8 1,492.4 3,256.3 3,343.1 702.1 736.8 9.9 65.4
2010 604.9 664.9 650.5 363.4 21.9 22.2 30.6 52.4 538.1 789.3 702.0 1,563.1 2,999.7 3,647.8 808.3 704.5 8.1 75.0
2009 611.9 666.2 666.7 406.5 24.0 20.6 25.0 56.9 549.5 816.4 616.4 1,491.9 3,003.7 3,288.1 883.7 727.7 9.2 61.3
2008 675.9 741.5 701.9 462.9 31.4 25.5 31.4 54.9 609.8 845.3 638.9 1,654.0 3,174.4 3,646.7 1,046.1 962.9 8.6 66.2
2007 670.3 928.8 677.4 526.7 30.8 20.1 32.6 104.3 606.2 1,220.6 666.3 1,743.3 2,800.7 4,316.7 1,244.8 1,354.0 10.7 66.1
2006 669.5 798.5 619.7 456.0 29.1 25.0 31.3 71.6 765.7 891.1 657.9 1,650.8 2,602.1 4,057.4 1,213.5 1,229.3 5.8 89.9
2005 526.9 685.9 636.1 446.5 35.4 28.1 30.0 65.9 700.1 918.7 648.7 1,658.6 2,572.5 4,823.0 1,356.4 1,292.7 11.1 88.2
2004 521.3 669.1 552.3 430.5 35.8 19.9 39.4 70.7 697.9 922.6 712.3 1,556.4 2,485.2 5,104.6 1,469.9 1,189.7 14.6 102.1
2003 623.1 660.1 680.9 423.8 44.0 18.4 48.5 69.1 795.6 868.0 828.9 1,546.3 3,081.7 5,151.3 1,694.9 1,255.7 0.0 107.2

City-data.com crime index counts serious crimes and violent crime more heavily. It adjusts for the number of visitors and daily workers commuting into cities. (higher means more crime, U.S. average = 301.1)


Crime per year
Type City-data.com crime indexRobberiesMurdersRapesAssaultsBurglariesTheftAuto theftArson
Year WashingtonKansas CityWashingtonKansas CityWashingtonKansas CityWashingtonKansas CityWashingtonKansas CityWashingtonKansas CityWashingtonKansas CityWashingtonKansas CityWashingtonKansas City
2019 490.9 629.7 2,359 1,462 166 152 342 372 4,029 5,264 1,840 3,117 25,827 12,507 2,298 3,893 0 162
2018 490.9 688.8 2,157 1,642 160 142 445 431 3,851 5,693 1,786 3,736 25,658 13,396 2,549 4,238 0 216
2017 480.7 755.4 2,351 1,887 116 153 443 489 3,674 5,983 1,808 4,681 24,490 13,014 2,545 4,438 0 204
2016 568.6 711.5 3,149 1,902 137 131 527 424 3,897 5,468 2,360 4,776 26,402 12,191 2,899 3,955 0 188
2015 591.5 653.5 3,404 1,710 162 110 494 383 4,024 4,532 2,971 4,887 24,194 12,313 3,194 3,911 0 199
2014 596.2 634.2 3,231 1,626 105 79 470 412 4,004 3,775 3,463 5,688 25,881 13,120 3,683 3,968 0 217
2013 583.4 666.7 3,660 1,666 103 99 393 392 3,724 3,719 3,314 6,336 23,108 14,015 3,147 4,304 0 207
2012 566.2 662.0 3,725 1,648 88 105 236 257 3,399 3,879 3,519 7,002 22,196 15,187 3,549 3,608 50 262
2011 565.0 651.6 3,756 1,671 108 108 172 272 2,949 3,504 3,849 6,887 20,124 15,427 4,339 3,400 61 302
2010 604.9 664.9 3,914 1,671 132 102 184 241 3,238 3,629 4,224 7,187 18,050 16,772 4,864 3,239 49 345
2009 611.9 666.2 3,998 1,970 144 100 150 276 3,295 3,957 3,696 7,231 18,012 15,937 5,299 3,527 55 297
2008 675.9 741.5 4,154 2,090 186 115 186 248 3,609 3,816 3,781 7,467 18,787 16,463 6,191 4,347 51 299
2007 670.3 928.8 3,985 2,358 181 90 192 467 3,566 5,465 3,920 7,805 16,476 19,327 7,323 6,062 63 296
2006 669.5 798.5 3,604 2,044 169 112 182 321 4,453 3,994 3,826 7,399 15,132 18,186 7,057 5,510 34 403
2005 526.9 685.9 3,502 2,000 195 126 165 295 3,854 4,115 3,571 7,429 14,162 21,603 7,467 5,790 61 395
2004 521.3 669.1 3,057 1,923 198 89 218 316 3,863 4,121 3,943 6,952 13,756 22,800 8,136 5,314 81 456
2003 623.1 660.1 3,836 1,890 248 82 273 308 4,482 3,871 4,670 6,896 17,362 22,973 9,549 5,600 0 478

City-data.com crime index counts serious crimes and violent crime more heavily. It adjusts for the number of visitors and daily workers commuting into cities. (higher means more crime, U.S. average = 301.1)

Sex Offenders

According to our data, there are 1,072 registered sex offenders living in Washington and 1,794 registered sex offenders living in .
The ratio of residents to sex offenders in Washington is 635 to 1; the ratio in Kansas City is 268 to 1.
The number of registered sex offenders compared to the number of residents is a smaller in Washington than in Kansas City.

Cost of Living

Living in Washington, DC is more expensive than Kansas City due to higher housing and transportation costs. According to a US Census report, the median home value in DC is around three times higher than in Kansas City. Also, basic amenities and services are more costly in Washington, DC.

Income Tax

The district of Columbia has a progressive income tax system topping out at 8.95% for high income earners. Kansas City residents must pay both state and city income taxes, but overall, the rates in Missouri are lower, ranging from 1.5% to 5.4%.

Property Tax

Although Washington, DC housing is more expensive, it has lower property tax rates averaging around 0.56%. In Kansas City, residents are subject to higher property tax rates that average around 1.35%.

Sales Tax

Washington, DC charges a city sales tax of 6%. Kansas City, in contrast, imposes a higher tax rate of 8.6% that includes both city and state sales taxes.
Income
Type Washington Kansas City
Estimated median household income $90,088 $63,396
Estimated per capita income $65,808 $36,456
Cost of living index (U.S. average is 100) 124.2 87.3

If you make $50,000 in Kansas City, you will have to make $71,134 in Washington to maintain the same standard of living.

Geographical Conditions

Washington, DC is located along the east coast, with relatively flat terrain and proximity to both beaches and mountains. Kansas City's location in the Midwest means it has more plains and rolling hills, with many parks and trails.
Geographical information
Type Washington Kansas City
Land area 61.4 sq. miles 313.5 sq. miles
Population density 10,912 people per sq. mile 1,621.4 people per sq. mile
Elevation 18 feet 882 feet
Relative area comparison
Washington, DC Kansas City, MO
First ancestry reported - percentage
Ancestry WashingtonKansas City
Irish 2.6% 4.7%
German 2.1% 9.0%
English 2.0% 4.5%
Italian 1.9% 2.3%
Polish 0.8% 0.8%
Russian 0.6% 0.2%
French 0.5% 0.5%
Greek 0.3% 0.2%
Ukrainian 0.3% 0.1%
Scotch-Irish 0.3% 0.5%
Scottish 0.3% 0.7%
Swedish 0.2% 0.4%
Dutch 0.2% 0.3%
Norwegian 0.2% 0.5%
Arab 0.1% 0.4%
Czech 0.1% 0.2%
Welsh 0.1% 0.2%
Population origin - absolute values
Ancestry WashingtonKansas City
Irish 10,076 12,304
German 8,090 23,752
English 7,856 11,886
Italian 7,617 6,120
Polish 2,971 1,974
Russian 2,464 615
French 2,059 1,341
Scottish 1,331 1,952
Greek 1,212 408
Scotch-Irish 1,071 1,342
Ukrainian 1,035 318
Dutch 788 894
Swedish 784 954
French Canadian 650 278
Norwegian 627 1,287
West Indian 624 20
Hungarian 490 110
Lithuanian 455 88
Welsh 333 580
Czech 325 566
Foreign born residents - absolute values
Type Count
Region WashingtonKansas City
All 93,065 39,373
Africa 14,129 6,697
Asia 19,894 11,610
Europe 15,928 2,775
Latin America 37,497 18,194
North America 2,125 399
Oceania 846 772
Foreign born residents - percentage
Type Percentage
Region WashingtonKansas City
All 13.9% 7.8%
Africa 2.1% 1.3%
Asia 3.0% 2.3%
Europe 2.4% 0.5%
Latin America 5.6% 3.6%
North America 0.3% 0.1%
Oceania 0.1% 0.2%

Education

For families with school-age children, education is an important consideration. Washington, DC is home to some of the best universities in the country, including Georgetown University and George Washington University. Apart from that, the District of Columbia Public Schools is also making strides in improving K-12 education. Kansas City, while smaller, also boasts reputable universities like the University of Missouri-Kansas City and good public schooling options.
School enrollment
Type Washington Kansas City
Nursery, preschool 13,521 (8.5%) 6,919 (5.7%)
Kindergarten 9,681 (6.1%) 5,837 (4.8%)
Grade 1 to 4 27,105 (17.1%) 26,925 (22.4%)
Grade 5 to 8 23,697 (14.9%) 26,970 (22.4%)
Grade 9 to 12 21,557 (13.6%) 21,603 (17.9%)
College undergrad 41,516 (26.2%) 20,992 (17.4%)
Graduate or professional 21,644 (13.6%) 11,150 (9.3%)
Students in private schools - absolute values
Type Count
Grade WashingtonKansas City
Grades 1 to 8 (elementary and middle school) 7,005 7,802
Grades 9 to 12 (high school) 3,749 4,118
Undergraduate colleges 31,525 5,891
Students in private schools - percentage
Type Percentage
Grade WashingtonKansas City
Grades 1 to 8 (elementary and middle school) 13.8% 14.5%
Grades 9 to 12 (high school) 17.4% 19.1%
Undergraduate colleges 75.9% 28.1%
Educational attainment
Type Washington Kansas City
Less than high school 7.2% 7.6%
High school or equiv. 14.8% 24.7%
Less than 1 year of college 3.1% 6.6%
1 or more years of college 8.7% 14.6%
Associate degree 3.2% 7.8%
Bachelor's degree 25.2% 24.6%
Master's degree 22.8% 10.2%
Profess. school degree 10.1% 2.6%
Doctorate degree 4.9% 1.2%
Education level (25-year-olds and older)
Type Washington Kansas City
Bachelor's degree or higher 63% 38.7%
Graduate or professional degree 37.8% 14%
High school or higher 92.8% 92.4%

Work and Economy

The economy of Washington, DC is unfailingly robust, anchored by the federal government. The city also has a strong presence of law firms, non-profits, and diplomatic missions. Kansas City, while having a smaller economy, is a hub for industries like telecommunications, manufacturing, and the service sector.

Biggest Employers

In Washington, DC, the federal government is the largest employer. Other major employers include MedStar Health, Inova Health, and Marriott International. In Kansas City, the top employers are the federal government, University of Missouri-Kansas City, and several healthcare systems.
Employment and residency - absolute values
Kind WashingtonKansas City
Work and live in this city 190,566 132,666
Work and live in this county 306,210 180,924
Workers who work outside the city they live in 381,493 308,879
Workers who work outside the county they live in 47,823 82,017
Working at home 170,971 52,196
Not working at home 183,062 210,745
Daytime population change due to commuting 410,794 101,966
Employment and residency - percentage
Kind WashingtonKansas City
Work and live in this city 73.0% 63.6%
Work and live in this county 86.5% 68.8%
Workers who work outside the city they live in 27.0% 36.4%
Workers who work outside the county they live in 13.5% 31.2%
Working at home 48.3% 19.9%
Not working at home 51.7% 80.1%
Daytime population change due to commuting 71.8% 23.1%
Geographical mobility: all
Type all
Mobility WashingtonKansas City
Same house 1 year ago 78.5% 82.3%
Moved from abroad 1.3% 0.5%
Moved within same county 10.8% 9.2%
Moved from different state 9.4% 4.5%
Moved within same state 0% 3.6%
Geographical mobility: Asian
Type Asian
Mobility WashingtonKansas City
Same house 1 year ago 74.3% 82.4%
Moved from abroad 3.9% 1.7%
Moved within same county 10.4% 4.0%
Moved from different state 11.5% 5.0%
Moved within same state 0% 6.9%
Geographical mobility: Black
Type Black
Mobility WashingtonKansas City
Same house 1 year ago 87.7% 83.4%
Moved from abroad 0.3% 0.4%
Moved within same county 6.0% 10.7%
Moved from different state 6.0% 3.5%
Moved within same state 0% 2.0%
Geographical mobility: White
Type White
Mobility WashingtonKansas City
Same house 1 year ago 71.1% 81.3%
Moved from abroad 1.3% 0.4%
Moved within same county 15.4% 9.3%
Moved from different state 12.1% 4.9%
Moved within same state 0% 4.1%

In Washington (District of Columbia), 90.9% voted for Democrats and 7.3% for Republicans in 2012 Presidential Election. In Kansas City (Jackson County), 58.9% voted for Democrats and 39.3% for Republicans.

Elections
Type DemocratsRepublicansOther
Year WashingtonKansas CityWashingtonKansas CityWashingtonKansas City
2020 92.6% 60.1% 5.4% 38.1% 2.0% 1.8%
2016 90.9% 55.5% 4.1% 38.1% 5.0% 6.4%
2012 90.9% 58.9% 7.3% 39.3% 1.8% 1.7%
2008 92.5% 62.1% 6.5% 36.8% 1.0% 1.1%
2004 89.6% 58.2% 9.4% 41.4% 1.0% 0.4%
2000 85.2% 59.0% 9.0% 38.4% 5.9% 2.5%
1996 85.2% 56.2% 9.3% 34.3% 5.5% 9.5%
Breakdown of population affiliated with a religious congregation
Type AdherentsCongregations
Religion WashingtonKansas CityWashingtonKansas City
CATHOLIC CHURCH 12.6% 10.3% 7.4% 6.4%
AMERICAN BAPTIST CHURCHES IN THE USA 6.2% 0.3% 10.3% 1.4%
SOUTHERN BAPTIST CONVENTION 4.4% 9.5% 10.3% 13.7%
EPISCOPAL CHURCH 3.1% 0.8% 5.3% 1.7%
SEVENTH DAY ADVENTIST CHURCH 0.9% 0.5% 1.8% 1.0%
MUSLIM ESTIMATE 0.7% 0.4% 1.1% 1.1%
EVANGELICAL LUTHERAN CHURCH IN AMERICA 0.5% 0.2% 2.1% 1.0%
LUTHERAN CHURCH 0.1% 1.4% 0.3% 1.8%
SALVATION ARMY 0.1% 0.4% 0.5% 0.6%

Weather

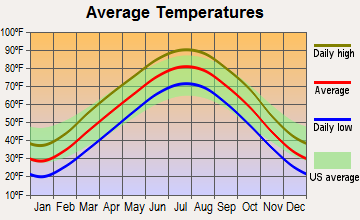
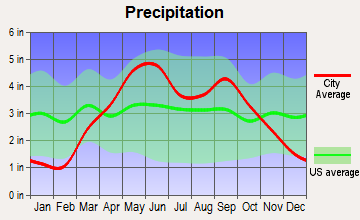
Weather-wise, both cities experience four seasons. Washington, DC, however, has a milder and more humid climate, with hot summers and cold winters. Kansas City experiences hotter summers and colder, snowier winters. Weather preferences vary by individual, but for those who enjoy a true four-season climate, Kansas City might prove preferable.
Weather and climate
Type Washington Kansas City
Temperature - Average 56.4°F 56.2°F
Humidity - Average morning or afternoon humidity 68.8% 76.3%
Humidity - Differences between morning and afternoon humidity 33% 30.1%
Humidity - Maximum monthly morning or afternoon humidity 81% 86%
Humidity - Minimum monthly morning or afternoon humidity 48% 56%
Precipitation - Yearly average 42.7 in 36.3 in
Snowfall - Yearly average 32.4 in 38 in
Clouds - Number of days clear of clouds 15.9% 20.1%
Sunshine amount - Average 61.5% 67.3%
Sunshine amount - Differences during a year 21% 25.9%
Sunshine amount - Maximum monthly 66% 74%
Sunshine amount - Minimum monthly 45% 48%
Wind speed - Average 9.7 mph 11.2 mph

Average climate in Washington, District of Columbia

Chicago, Illinois average temperatures Chicago, Illinois average precipitation Chicago, Illinois humidity Chicago, Illinois wind speed Chicago, Illinois snowfall Chicago, Illinois sunshine Chicago, Illinois clear and cloudy days
 

Average climate in Kansas City, Missouri

Chicago, Illinois average temperatures Chicago, Illinois average precipitation Chicago, Illinois humidity Chicago, Illinois wind speed Chicago, Illinois snowfall Chicago, Illinois sunshine Chicago, Illinois clear and cloudy days
 

Air pollution
Type AQICONO2OZONEPBPM10PM25SO2
Year WashingtonKansas CityWashingtonKansas CityWashingtonKansas CityWashingtonKansas CityWashington WashingtonKansas CityWashingtonKansas CityWashingtonKansas City
2018 88 89 0.32 0.29 11.6 11.1 23.2 29.6 N/A N/A 16.4 24.5 8.8 7.4 0.8 0.9
2017 84 88 0.32 0.29 12.3 11.6 24.9 30.4 N/A N/A 16.5 26.7 9.8 10.0 1.0 1.4
2016 98 85 0.43 0.30 14.7 12.0 24.6 28.9 0.002 N/A 17.2 24.9 9.5 9.0 1.0 1.5
2015 91 90 0.34 0.30 14.8 12.9 26.2 28.9 0.002 N/A 17.0 33.6 10.4 8.3 1.3 4.6
2014 85 90 0.33 0.28 11.6 13.0 25.9 28.6 0.002 N/A 17.1 28.5 10.0 9.3 1.0 5.0
2013 88 88 0.34 0.41 11.7 13.2 25.6 29.3 0.002 N/A 17.3 30.8 11.6 10.3 1.0 5.6
2012 103 105 0.58 0.52 15.2 14.2 27.6 31.9 0.002 N/A N/A N/A 12.2 10.3 1.6 6.4
2011 105 108 0.67 0.45 15.4 15.0 27.7 29.9 0.002 N/A N/A N/A 11.4 10.9 3.1 4.8
2010 114 97 0.88 0.40 15.9 15.0 29.3 27.4 0.003 N/A N/A N/A 9.3 11.9 3.4 5.4
2009 90 96 0.86 0.29 16.2 14.8 24.4 28.3 0.002 N/A N/A N/A 7.6 9.6 4.6 6.1
2008 103 89 1.23 0.40 16.2 17.0 25.3 25.7 0.003 N/A N/A N/A 8.5 11.5 5.6 6.0
2007 113 104 1.17 0.42 16.8 18.4 27.1 29.1 0.004 N/A N/A N/A 10.4 13.1 5.1 4.2
2006 114 104 1.11 0.36 17.2 18.5 25.5 29.2 0.004 N/A N/A N/A 10.9 12.4 4.5 5.1
2005 105 105 0.86 0.55 20.5 18.3 22.7 28.4 0.006 N/A N/A N/A 11.7 N/A 4.5 4.5
2004 113 83 0.62 0.45 21.3 11.6 20.6 26.2 0.004 N/A N/A N/A 11.3 N/A 6.5 4.0
2003 108 99 0.90 0.41 23.6 10.9 20.8 28.0 N/A N/A N/A N/A 12.2 N/A 8.3 3.0
2002 125 100 1.16 0.40 23.7 8.9 25.0 27.0 N/A N/A N/A N/A N/A N/A 6.7 2.5
2001 113 88 1.07 0.52 23.9 7.9 22.0 27.0 0.017 N/A N/A N/A N/A N/A 6.7 1.2
2000 115 102 1.17 0.75 20.2 8.8 19.1 29.2 N/A N/A N/A N/A N/A N/A 8.2 2.2
Natural disasters
Type Washington Kansas City
Tornado activity compared to U.S. average 110.6% 200.4%
Earthquake activity compared to U.S. average 42.9% 598.9%
Natural disasters compared to U.S. average 19% 24%

Transportation

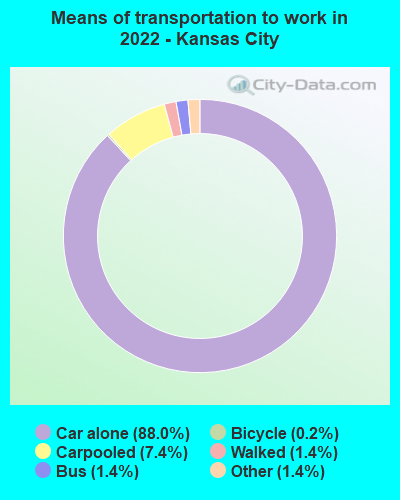
Public transportation is more extensive in Washington, DC, with an extensive metro and bus system, making commuting easier. Kansas City also has public transport but is not as extensive. Driving is often a more feasible mode of transportation in Kansas City.
Transport
Type Washington Kansas City
Amtrak stations 1 1
Amtrak stations nearby 3 3
FAA registered aircraft 456 0
FAA registered aircraft manufacturers and dealers 3 0
Means of transportation to work
Type Washington Kansas City
Bicycle 2% 0.4%
Bus 6.3% 1.5%
Carpooled 7.8% 8.7%
Car alone 62.5% 86.8%
Railroad 0.3% 0%
Streetcar 10.6% 0%
Subway 1.3% 0%
Taxicab 0.8% 0.2%
Walked 5.7% 1.3%
Means of transportation to work
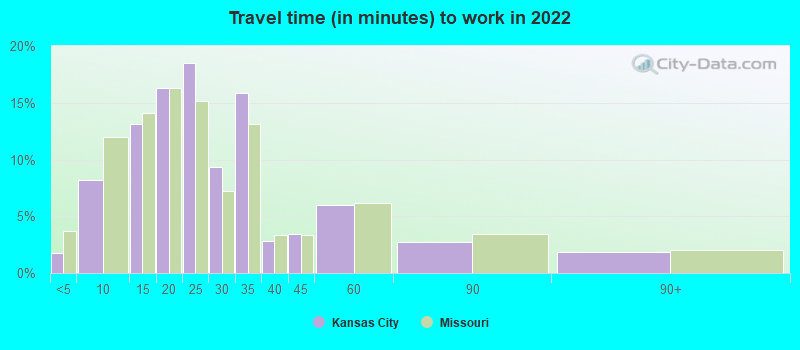
Average travel time to work
Type Washington Kansas City
Average 39.2 min 25.5 min
Other means 26 min 21.7 min
Public transportation 38.9 min 38.9 min
Travel time to work
Time leaving to work
Travel time to work
Time leaving to work
Private vehicle occupancy
Type Washington Kansas City
Average 1.1 1.1
Drove alone 89.4% 89.4%
In 2 person carpool 9.7% 8%
In 3 person carpool 0.6% 2.1%
In 4 person carpool 0.4% 0.3%
In 5-6 person carpool 0% 0.2%

How many people usually rode to work in the car, truck or van.

Real Estate

Real estate in Washington, DC is more costly, with tightly packed residential areas and a competitive market. Kansas City offers cheaper real estate and you'd find larger properties for less money, giving you more bang for your buck.

Neighborhoods

Both Washington DC and Kansas City have diverse neighborhoods. DC offers everything from urban areas filled with historical brownstones to more suburban-feeling areas. Kansas City is known for its culturally rich neighborhoods, including the Crossroads Arts District and Hyde Park.
Houses and residents
Type Washington Kansas City
Houses 357,482 243,950
Average household size (people) 2.1 2.3
Median year apartment built 1965 1975
Median year house/condo built 1941 1967
Length of stay in the house since moving in 13.5 years 12 years
Houses occupied 319,565 (89.4%) 219,020 (89.8%)
Houses occupied by owners 132,936 (41.6%) 118,384 (54.1%)
Houses occupied by renters 186,629 (58.4%) 100,636 (45.9%)
Median rent asked for vacant for-rent units $2,791 $933.71
Median monthly housing costs $1,817 $1,092
Median price asked for vacant for-sale houses and condos $996,150 $71,644
Estimated median house or condo value $669,900 $213,400
Median numbers of rooms 3.8 5.5
Median number of rooms in apartments 3.1 4.3
Median number of rooms in houses and condos 6 6.6
Median house price - detached houses Over $1,000,000 $250,072
Median house price - in 2-unit structures Over $1,000,000 $212,485
Median house price - in 3-to-4-unit structures $471,443 $147,015
Median house price - in 5 or more unit structures $527,983 $274,597
Median house price - Townhouses or other attached units $817,288 $203,232
Median house price - All housing units $790,542 $247,285
Median house age 65 52
Renting percentage 58% 43.8%
Housing density (houses/condos per square mile) 5,821.9 778
House value disparities 26.7% 36%
Household income disparities 45.7% 43.9%
Median household income for houses/condes with a mortgage $163,111 $96,255
Median household income for apartments without a mortgage $108,852 $64,961
Housing units without a mortgage 777 (0.8%) 1,566 (2%)
Housing units with both a second mortgage and home equity loan 8,586 (8.5%) 5,650 (7.2%)
Housing units with a mortgage 100,122 (99.2%) 77,422 (98%)
Housing units with a home equity loan 1,057 (1%) 403 (0.5%)
Housing units with a second mortgage 12,793 (12.7%) 6,848 (8.7%)
House/condo owner moved in on average (years ago) 10 9
House/condo renter moved in on average (years ago) 1 1
Housing units lacking complete kitchen facilities 1.5% 3.8%
Housing units lacking complete plumbing facilities 1.5% 2.2%
Housing units in structures
Housing units in structures WashingtonKansas City
One, detached 11.2% 60.7%
One, attached 22.2% 3.9%
Two 2.7% 3.1%
3 or 4 6.8% 4.4%
5 to 9 7.3% 5.8%
10 to 19 8.5% 6.2%
20 to 49 7.6% 5.8%
50 or more 33.6% 9.3%
Mobile homes 0.2% 0.6%
Boats, RVs, vans, etc. 0.0% 0.1%
Median real estate property taxes paid for housing units
Type Washington Kansas City
With mortgages $3,795 (0.6%) $2,501 (1.1%)
With no mortgages $3,467 (0.5%) $2,043 (1.2%)
Marital status
Type Washington Kansas City
Divorced 9.2% 12.1%
Never married 54.6% 38.3%
Now married 31.1% 44%
Separated 1.3% 1.5%
Widowed 3.8% 4.1%
Class of workers - percentage
Class of Workers WashingtonKansas City
Employee of private company 45.8% 69.8%
Private not-for-profit wage and salary workers 19.6% 10.7%
Federal government workers 18.9% 3.4%
Local government workers 5.9% 5.8%
Self-employed workers in own not incorporated business 4.7% 4.9%
Self-employed in own incorporated business 3.1% 2.7%
State government workers 1.9% 2.6%
Unpaid family workers 0.2% 0.1%
Class of workers - absolute values
Class of Workers WashingtonKansas City
Employee of private company 162,710 185,467
Federal government workers 67,042 9,069
Local government workers 21,114 15,454
Private not-for-profit wage and salary workers 69,677 28,319
Self-employed in own incorporated business 10,922 7,178
Self-employed workers in own not incorporated business 16,654 13,035
State government workers 6,699 6,835
Unpaid family workers 580 197

Industries and Occupations

Job seekers in Washington, DC will find opportunities in federal and local government roles, law, international relations, and education. Thank to the concentration of NGOs, non-profit roles are also abundant. Kansas City's dominant sectors include healthcare, education, and finance, as well as the government sector.
Most common male industries
Industry WashingtonKansas City
Professional, scientific, and technical services 23.1% 12.6%
Public administration 18.5% 5.8%
Other services, except public administration 7.2% 5.0%
Educational services 6.4% 4.7%
Retail trade 5.3% 9.2%
Transportation and warehousing 4.8% 9.7%
Finance and insurance 4.7% 6.0%
Health care and social assistance 4.6% 5.8%
Accommodation and food services 4.4% 6.9%
Real estate and rental and leasing 3.9% 2.5%
Construction 3.8% 8.4%
Information 3.8% 2.1%
Administrative and support and waste management services 3.6% 4.1%
Arts, entertainment, and recreation 2.6% 2.8%
Manufacturing 1.6% 9.4%
Wholesale trade 0.9% 3.1%
Utilities 0.5% 0.6%
Mining, quarrying, and oil and gas extraction 0.0% 0.1%
Agriculture, forestry, fishing and hunting 0.0% 1.1%
Most common female industries
Industry WashingtonKansas City
Professional, scientific, and technical services 21.7% 10.4%
Public administration 18.6% 4.2%
Educational services 11.3% 10.7%
Other services, except public administration 10.9% 5.8%
Health care and social assistance 10.2% 25.0%
Administrative and support and waste management services 4.8% 3.9%
Retail trade 4.3% 10.1%
Finance and insurance 3.8% 7.1%
Accommodation and food services 3.1% 7.3%
Information 2.8% 0.8%
Real estate and rental and leasing 2.3% 1.6%
Arts, entertainment, and recreation 2.2% 2.1%
Transportation and warehousing 1.2% 3.1%
Manufacturing 1.0% 4.9%
Construction 0.9% 0.9%
Management of companies and enterprises 0.3% 0.1%
Wholesale trade 0.3% 1.5%
Agriculture, forestry, fishing and hunting 0.1% 0.1%
Utilities 0.1% 0.3%
Most common male occupations
Occupation WashingtonKansas City
Management occupations 18.9% 12.4%
Business and financial operations occupations 11.5% 4.7%
Computer and mathematical occupations 9.7% 7.2%
Legal occupations 9.5% 1.4%
Office and administrative support occupations 5.5% 6.8%
Arts, design, entertainment, sports, and media occupations 5.4% 2.9%
Sales and related occupations 5.0% 8.2%
Educational instruction, and library occupations 4.9% 2.9%
Life, physical, and social science occupations 3.8% 1.3%
Transportation occupations 3.5% 7.5%
Food preparation and serving related occupations 3.3% 4.5%
Architecture and engineering occupations 2.4% 3.7%
Installation, maintenance, and repair occupations 2.0% 4.8%
Community and social service occupations 1.9% 1.5%
Construction and extraction occupations 1.8% 5.8%
Firefighting and prevention, and other protective service workers including supervisors 1.7% 2.7%
Health diagnosing and treating practitioners and other technical occupations 1.7% 2.2%
Building and grounds cleaning and maintenance occupations 1.6% 3.1%
Material moving occupations 1.4% 6.0%
Personal care and service occupations 1.4% 1.2%
Most common female occupations
Occupation WashingtonKansas City
Management occupations 19.1% 11.6%
Business and financial operations occupations 14.3% 7.6%
Educational instruction, and library occupations 8.7% 8.4%
Legal occupations 8.2% 1.4%
Office and administrative support occupations 7.7% 15.0%
Arts, design, entertainment, sports, and media occupations 5.7% 2.2%
Sales and related occupations 5.2% 9.2%
Computer and mathematical occupations 4.8% 2.4%
Life, physical, and social science occupations 4.5% 1.8%
Health diagnosing and treating practitioners and other technical occupations 4.3% 7.2%
Community and social service occupations 2.5% 3.1%
Food preparation and serving related occupations 2.4% 5.0%
Building and grounds cleaning and maintenance occupations 2.3% 2.1%
Personal care and service occupations 2.1% 4.2%
Firefighting and prevention, and other protective service workers including supervisors 1.9% 1.4%
Healthcare support occupations 1.5% 5.8%
Architecture and engineering occupations 1.3% 0.7%
Health technologists and technicians 1.1% 3.7%
Material moving occupations 0.7% 2.8%
Production occupations 0.6% 2.6%
Food environment data per 10,000 residents
Food environment statistics WashingtonKansas City
Number of convenience stores (no gas) 0.8 2.8
Number of convenience stores (with gas) 1.7 0.6
Number of full-service restaurants 11.0 6.9
Number of grocery stores 3.2 1.6
Number of supercenters and club stores 0.0 0.2
Food environment - absolute values
Food environment statistics WashingtonKansas City
Number of convenience stores (no gas) 45 185
Number of convenience stores (with gas) 97 40
Number of full-service restaurants 645 460
Number of grocery stores 189 109
Number of supercenters and club stores 0 10
Obesity and diabetes
Food environment statistics rate WashingtonKansas City
Adult diabetes rate 8.5% 9.1%
Adult obesity rate 22.0% 30.8%
Low-income preschool obesity rate 14.4% 14.0%

Health Care

Both cities have excellent healthcare institutions. Washington, DC houses prestigious hospitals like MedStar Georgetown University Hospital and George Washington University Hospital. Kansas City hosts several renowned healthcare facilities, including the University of Missouri Healthcare and Saint Luke's Hospital.
Health (county statistics)
Type Washington Kansas City
General health status score of residents in this county from 1 (poor) to 5 (excellent) 3.7 3.5
Average weight of females (lbs) 160.6 lbs 166.3 lbs
Average weight of males (lbs) 185.7 lbs 203.4 lbs
Residents visited a dentist within the past year 74.9% 71.7%
Residents exercised in the past month 79.2% 72.6%
Adult residents drank alcohol in the past 30 days 81% 55.3%
Residents smoked 100+ cigarettes in their lives 43.6% 42%

Fatal vehicle accidents per 100,000 residents
Type Total count per 100,000Drunk per 100,000Fatal count per 100,000Pedestrian count per 100,000Person count per 100,000Vehicle count per 100,000
Year WashingtonKansas CityWashingtonKansas CityWashingtonKansas CityWashingtonKansas CityWashingtonKansas CityWashingtonKansas City
2021 6.0 12.6 0.0 0.0 6.1 13.2 3.1 3.3 13.3 28.9 10.0 21.0
2020 4.9 14.6 1.3 6.7 5.2 15.4 1.6 4.1 10.4 32.3 7.5 23.0
2019 3.1 12.1 0.4 5.0 3.2 12.7 1.4 2.4 7.8 26.0 4.8 18.5
2018 4.3 12.4 0.7 3.7 4.4 13.2 2.4 3.5 8.5 27.4 6.2 19.7
2017 4.2 14.7 1.9 4.9 4.4 16.6 1.9 3.1 7.6 37.6 6.2 27.6
2016 3.8 11.0 1.5 4.1 3.9 11.4 1.3 1.9 8.1 20.1 6.3 16.0
2015 3.4 10.1 0.7 3.4 3.4 10.5 2.7 2.3 6.6 26.3 4.7 16.4
2014 3.2 7.9 0.8 5.3 3.5 8.7 1.5 1.1 5.3 19.8 4.4 12.3
2013 3.1 9.2 0.9 4.3 3.1 9.9 1.5 1.9 7.1 22.5 5.1 15.4
2012 2.2 10.1 0.2 3.7 2.4 10.3 1.1 2.2 4.7 22.8 3.5 15.5
2011 3.6 10.4 1.3 4.3 4.4 11.0 1.6 3.0 7.6 24.6 5.5 16.2
2010 4.0 9.6 1.5 4.1 4.0 10.7 2.7 1.3 6.5 20.9 5.2 14.8
2009 4.7 9.1 1.3 4.8 4.8 10.6 2.8 2.5 12.0 23.8 7.3 13.3
2008 5.4 9.4 1.7 3.3 5.8 10.2 1.7 2.3 12.4 24.6 7.6 14.2
2007 6.1 6.1 3.4 2.1 7.5 6.3 3.8 2.1 16.0 16.2 8.2 10.9
2006 5.7 10.4 1.9 4.3 6.3 10.6 2.9 1.7 15.6 27.2 8.4 16.4
2005 7.6 9.5 2.7 4.7 8.2 9.5 3.4 1.1 20.4 22.0 10.7 16.2
2004 7.1 9.2 2.2 2.8 7.4 9.8 2.2 3.3 21.7 25.7 12.1 12.6
2003 10.7 10.1 1.4 4.8 11.4 10.4 3.3 2.9 31.3 28.4 16.6 16.3
2002 7.4 12.5 0.9 5.3 8.1 14.2 1.6 4.0 20.2 34.1 12.6 18.7
2001 10.0 13.7 1.4 6.7 11.8 14.4 2.2 3.1 34.6 35.2 15.2 22.0
2000 7.9 12.2 0.2 4.8 8.4 13.4 3.8 2.0 24.3 38.0 11.5 21.3
1999 7.7 11.4 0.6 5.7 7.9 12.8 3.5 2.1 19.5 31.3 11.6 19.0
1998 9.4 10.3 2.7 3.2 10.2 11.7 3.1 4.3 29.0 26.1 14.8 14.4
1997 10.8 14.5 2.6 6.2 11.3 15.8 5.3 2.8 30.1 38.3 18.2 22.5
1996 10.8 12.6 1.1 5.1 11.5 14.0 4.5 1.8 45.1 33.1 17.3 21.6
1995 9.6 10.1 2.2 5.3 10.3 11.0 2.9 1.8 26.1 21.6 14.7 12.9
1994 11.5 9.0 1.8 3.9 12.2 9.2 4.8 3.0 32.4 22.3 14.9 12.9
1993 9.5 12.2 0.9 5.8 9.9 14.0 4.7 3.2 28.5 26.7 15.4 17.0
1992 8.0 10.8 1.5 5.1 8.6 12.0 2.9 2.8 22.9 26.9 11.5 17.7
1991 10.1 12.2 2.4 6.0 10.6 14.5 4.4 1.8 26.6 32.5 15.0 20.0
1990 7.6 13.3 3.3 5.7 7.9 14.5 0.0 0.0 21.7 34.5 10.4 21.1
1989 11.5 13.3 2.0 7.1 11.8 15.1 0.0 0.0 27.9 39.4 16.1 22.2
1988 9.1 13.5 2.3 5.5 9.9 13.9 0.0 0.0 25.0 33.8 12.6 20.8
1987 8.3 13.2 2.1 6.2 8.6 14.4 0.0 0.0 20.0 32.3 12.8 20.7
1986 7.1 14.5 1.8 7.5 7.1 17.0 0.0 0.0 21.0 41.8 10.8 22.3
1985 9.2 16.8 2.2 7.7 9.6 17.7 0.0 0.0 22.0 41.2 12.0 26.0
1984 8.9 12.9 3.2 6.3 10.2 14.9 0.0 0.0 21.6 28.9 12.8 19.6
1983 9.2 12.8 3.8 5.9 10.5 13.7 0.0 0.0 23.1 30.2 13.8 19.4
1982 5.4 15.5 2.7 7.4 5.5 16.6 0.0 0.0 11.5 38.4 7.9 24.0
1981 7.2 11.9 2.0 4.9 7.7 12.5 0.0 0.0 15.7 28.0 10.5 16.8
1980 6.0 18.5 1.9 7.6 6.4 20.8 0.0 0.0 13.2 42.9 8.3 24.3
1979 6.5 14.5 2.6 5.7 6.8 17.0 0.0 0.0 13.1 32.6 8.9 19.6
1978 7.1 14.8 2.0 7.2 7.4 14.8 0.0 0.0 16.5 31.7 9.7 20.9
1977 8.5 14.2 2.4 6.7 8.6 15.2 0.0 0.0 18.3 36.3 11.3 20.4
1976 10.2 12.1 3.9 2.5 10.2 13.4 0.0 0.0 24.2 31.4 13.4 18.2
1975 10.0 11.9 3.9 2.5 10.0 13.2 0.0 0.0 23.8 31.0 13.2 18.0

Fatal vehicle accidents
Type Total countDrunkFatal countPedestrian countPerson countVehicle count
Year WashingtonKansas CityWashingtonKansas CityWashingtonKansas CityWashingtonKansas CityWashingtonKansas CityWashingtonKansas City
1975 70 57 27 12 70 63 0 0 166 148 92 86
1976 70 57 27 12 70 63 0 0 166 148 92 86
1977 57 66 16 31 58 71 0 0 123 169 76 95
1978 47 68 13 33 49 68 0 0 109 146 64 96
1979 42 66 17 26 44 77 0 0 85 148 58 89
1980 38 83 12 34 41 93 0 0 84 192 53 109
1981 46 53 13 22 49 56 0 0 100 125 67 75
1982 34 69 17 33 35 74 0 0 73 171 50 107
1983 58 57 24 26 66 61 0 0 145 134 87 86
1984 56 57 20 28 64 66 0 0 135 128 80 87
1985 57 74 14 34 60 78 0 0 137 182 75 115
1986 44 64 11 33 44 75 0 0 130 184 67 98
1987 51 58 13 27 53 63 0 0 123 142 79 91
1988 56 59 14 24 61 61 0 0 153 148 77 91
1989 70 58 12 31 72 66 0 0 170 172 98 97
1990 46 58 20 25 48 63 0 0 131 150 63 92
1991 60 53 14 26 63 63 26 8 158 141 89 87
1992 47 47 9 22 50 52 17 12 134 117 67 77
1993 55 53 5 25 57 61 27 14 164 116 89 74
1994 65 39 10 17 69 40 27 13 183 97 84 56
1995 53 44 12 23 57 48 16 8 144 94 81 56
1996 58 55 6 22 62 61 24 8 243 144 93 94
1997 57 63 14 27 60 69 28 12 159 167 96 98
1998 49 45 14 14 53 51 16 19 151 114 77 63
1999 40 50 3 25 41 56 18 9 101 137 60 83
2000 45 54 1 21 48 59 22 9 139 168 66 94
2001 58 61 8 30 68 64 13 14 200 157 88 98
2002 43 56 5 24 47 64 9 18 117 153 73 84
2003 62 46 8 22 66 47 19 13 181 129 96 74
2004 41 42 13 13 43 45 13 15 126 118 70 58
2005 44 44 16 22 48 44 20 5 119 102 62 75
2006 33 49 11 20 37 50 17 8 91 128 49 77
2007 36 29 20 10 44 30 22 10 94 77 48 52
2008 32 45 10 16 34 49 10 11 73 118 45 68
2009 28 44 8 23 29 51 17 12 72 115 44 64
2010 24 44 9 19 24 49 16 6 39 96 31 68
2011 22 48 8 20 27 51 10 14 47 114 34 75
2012 14 47 1 17 15 48 7 10 30 106 22 72
2013 20 43 6 20 20 46 10 9 46 105 33 72
2014 21 37 5 25 23 41 10 5 35 93 29 58
2015 23 48 5 16 23 50 18 11 45 125 32 78
2016 26 53 10 20 27 55 9 9 56 97 43 77
2017 29 72 13 24 31 81 13 15 53 184 43 135
2018 30 61 5 18 31 65 17 17 60 135 44 97
2019 22 60 3 25 23 63 10 12 55 129 34 92
2020 34 74 9 34 36 78 11 21 72 164 52 117
2021 40 64 0 0 41 67 21 17 89 147 67 107
Police full-time law enforcement employees
Year WashingtonKansas City
2021 4,179 1,839
2020 4,466 1,241
2019 4,524 1,819
2018 4,520 1,819
2017 4,473 1,819
2016 4,352 1,875
2015 4,487 1,824
2014 4,368 1,997
2013 4,403 1,937
2012 4,332 1,869
2011 4,299 1,961
2010 4,477 1,993
2009 4,613 2,033
2008 4,637 1,979
2007 4,494 2,102
2006 4,342 2,045
2005 4,278 1,998
2004 4,372 1,944
2003 4,182 1,947
Police full-time law enforcement employees (per 1,000 residents)
Year WashingtonKansas City
2021 6.2 3.7
2020 6.3 2.5
2019 6.4 3.7
2018 6.4 3.7
2017 6.4 3.8
2016 6.4 3.9
2015 6.7 3.9
2014 6.6 4.3
2013 6.8 4.2
2012 6.9 4.0
2011 7.0 4.3
2010 7.4 4.3
2009 7.7 4.2
2008 7.8 4.4
2007 7.6 4.7
2006 7.5 4.6
2005 7.8 4.5
2004 7.9 4.4
2003 7.4 4.4
Place of birth - Foreign born
Residents WashingtonKansas City
All residents 13.3% 8.0%
American Indian / Alaska Native residents 50.7% 29.0%
Asian residents 58.7% 60.4%
Black or African American residents 7.0% 6.9%
Native Hawaiian / Pacific Islander residents 31.2% 49.9%
Other race residents 50.0% 37.0%
Two or more races residents 19.9% 12.0%
White residents 8.3% 2.4%
White alone, not Hispanic / Latino residents 8.6% 2.2%
Place of birth - Native, outside of US
Residents WashingtonKansas City
All residents 2.4% 0.9%
American Indian / Alaska Native residents 0.1% 0.0%
Asian residents 3.4% 2.9%
Black or African American residents 1.1% 0.5%
Native Hawaiian / Pacific Islander residents 8.4% 10.3%
Other race residents 3.4% 2.1%
Two or more races residents 5.0% 2.0%
White residents 2.5% 0.7%
White alone, not Hispanic / Latino residents 2.4% 0.6%
Place of birth - Born in state of residence
Residents WashingtonKansas City
All residents 35.0% 53.6%
American Indian / Alaska Native residents 25.7% 38.1%
Asian residents 5.6% 16.7%
Black or African American residents 58.4% 63.7%
Native Hawaiian / Pacific Islander residents 7.7% 2.7%
Other race residents 31.9% 37.0%
Two or more races residents 29.3% 52.9%
White residents 13.9% 53.2%
White alone, not Hispanic / Latino residents 13.7% 53.0%
Place of birth - Born in other state
Residents WashingtonKansas City
All residents 49.3% 37.5%
American Indian / Alaska Native residents 23.6% 32.9%
Asian residents 32.3% 20.0%
Black or African American residents 33.5% 28.9%
Native Hawaiian / Pacific Islander residents 52.7% 37.1%
Other race residents 14.7% 23.9%
Two or more races residents 45.8% 33.1%
White residents 75.2% 43.7%
White alone, not Hispanic / Latino residents 75.3% 44.2%
English speakers (speaking English at home)
Type Washington Kansas City
Born in the United States residents 92.7% 95.2%
Foreign born residents 29.1% 18.6%
Native, born elsewhere residents 58.4% 68.6%
Total residents 82.7% 88.1%
Mechanisms of homicide
Mechanism WashingtonKansas City
Homicides from 2000 to 2006 1,308 721
Cut / Pierce 126 57
Firearm 1,010 530
Mechanisms of homicide per 1,000,000 residents
Mechanism WashingtonKansas City
Homicides from 2000 to 2006 322.7 154.4
Cut / Pierce 31.1 12.2
Firearm 249.2 113.5
Mechanisms of suicide per 1,000,000 residents
Mechanism WashingtonKansas City
Suicides from 2000 to 2006 55.8 133.4
Fall 5.9 0
Firearm 18.8 71.7
Poisoning 8.4 27.0
Suffocation 16.0 25.1

Infrastructure

The infrastructure in Washington, DC includes well-maintained public parks, a myriad of historical sites, and landmark buildings. Kansas City also boasts unique infrastructures, including excellent City Libraries, and the world-class Nelson-Atkins Museum of Art.
Infrastructure
Type Washington Kansas City
Hospitals 114 30
TV stations 27 14
Arenas or stadiums 4 2
Bank branches located here 247 140
Bank institutions located here 34 41
Main business address for public companies 30 27
Drinking water stations with no reported violations in the past 5 0
Drinking water stations with reported violations in the past 10 1

Schools

School facilities
Type Washington Kansas City
Private elementary/middle schools 34 20
Private high schools 24 20
Public elementary/middle schools 157 113
Public high schools 44 35
Colleges/Universities 25 35
HMDA - Conventional home purchase loans - Applications denied
Year WashingtonKansas City
1999 1,328 1,565
2000 1,438 1,758
2001 935 1,494
2002 886 1,380
2003 1,319 1,975
2004 2,281 3,011
2005 2,920 3,470
2006 3,362 3,499
2007 2,548 2,228
2008 1,095 742
2009 514 447

Culture and Food

Both cities are cultural hubs. Washington, DC offers a plethora of museums, cultural institutions, restaurants, and festivals. Kansas City has a hearty cultural scene too, known for its jazz history, barbeque cuisine, and artistic communities.

Sports Teams

Sporting fans in both cities won't be disappointed. Washington, DC is home to teams such as the Washington Football Team, Wizards, Capitals, and Nationals. Kansas City, on the other hand, cheers for the Chiefs, Royals, and Sporting Kansas City.