Washington, D.C., U.S.'s capital, is known for its cultural diversity, bustling economy, and iconic landmarks, while Newark, New Jersey's most populous city, is recognized for its rich industrial history, diverse communities, and revitalization efforts. Both cities have unique attributes that may appeal to different individuals based on their lifestyle preferences, priorities, and needs. Here's a comprehensive comparison of these two dynamic cities.
Distance between
Washington, DC and
Newark, NJ : 195.8 miles
Washington's population is larger by 118%. Its population has grown by 97,991 people (17.1%) since 2000. The population of Newark has grown by 33,674 people (12.3%) during that time.
Both Washington, D.C. and Newark have been known for high crime rates compared to the national average, although in recent years both cities have seen crime decrease. In Washington, D.C., crime is concentrated in specific neighborhoods. The capital also has a larger police force relative to its population, and there's a strong police presence around the tourist areas to ensure safety. Newark, on the other hand, has been striving hard to shed its reputation for high crime rates, with continuing efforts to improve safety in various neighborhoods.
City-data.com crime index counts serious crimes and violent crime more heavily. It adjusts for the number of visitors and daily workers commuting into cities. (higher means more crime, U.S. average = 301.1)
City-data.com crime index counts serious crimes and violent crime more heavily. It adjusts for the number of visitors and daily workers commuting into cities. (higher means more crime, U.S. average = 301.1)
Sex Offenders
According to our data, there are 1,072 registered sex offenders living in Washington and 560 registered sex offenders living in . The ratio of residents to sex offenders in Washington is 635 to 1; the ratio in Newark is 503 to 1. The number of registered sex offenders compared to the number of residents is a smaller in Washington than in Newark.
Cost of Living
As the nation's capital, Washington, D.C. has a higher cost of living compared to Newark and the national average. Housing is the most significant factor in the cost of living difference. Newark, though not as expensive as D.C., is still higher than the national average, largely due to housing costs near the city center and transportation costs.
Income Tax
D.C. has a progressive income tax rate ranging from 4% to 8.95%. In Newark, the state of New Jersey imposes a progressive income tax rate ranging from 1.4% to 10.75%. Thus, income tax is often higher in New Jersey.
Property Tax
Property tax in D.C. depends on the value of the property, with the current rate being 0.85% per $100 of assessed value, which tends to be lower than Newark's property tax which is considerably higher, around 2.68%.
Sales Tax
The sales tax in D.C. is 6.0%, which is higher than Newark, where the combined city and state sales tax is 6.625%. Although both rates are relatively close, the slightly higher tax in D.C. may impact the overall cost of living.
Income
Type
Washington
Newark
Estimated median household income
$90,088
$43,242
Estimated per capita income
$65,808
$23,767
Cost of living index (U.S. average is 100)
124.2
118.1
If you make $50,000 in Newark, you will have to make $52,583 in Washington to maintain the same standard of living.
Geographical Conditions
Washington D.C. is located on the east coast of the U.S. along the Potomac River and has a relatively flat landscape. Newark is in northeastern New Jersey, roughly 8 miles west of Manhattan, NY. The city is also a significant coastal environment due to its location on Newark Bay.
Washington, D.C. is home to many highly ranked universities and colleges like Georgetown University and The George Washington University. Public education is improving, with increases in graduation rates and more students attending charter schools. Newark’s educational landscape is mixed. It has some excellent schools like the Science Park High School, but the public school system has been criticized for its performance.
D.C.’s economy is heavily influenced by the presence of the federal government, though it's increasingly diverse with growing sectors in business services and education. Newark’s economy is also diverse, with sectors such as health care, retail trade, and manufacturing. Both cities have significant unemployment rates, with Newark having a slightly higher rate than D.C.
Biggest Employers
The federal government is the largest employer in Washington, D.C., followed by MedStar Health and Inova Health System. In Newark, some of the biggest employers include Prudential, Panasonic Corporation of North America, and Rutgers University.
There were 376 building permits issued in Washington in 2012 (149 more than in 2011) compared to 1 building permits issued in Newark in 2012.
In Washington (District of Columbia), 90.9% voted for Democrats and 7.3% for Republicans in 2012 Presidential Election. In Newark (Essex County), 78.3% voted for Democrats and 21.4% for Republicans.
Elections
Type
Democrats
Republicans
Other
Year
Washington
Newark
Washington
Newark
Washington
Newark
2020
92.6%
77.4%
5.4%
21.9%
2.0%
0.7%
2016
90.9%
77.2%
4.1%
20.2%
5.0%
2.6%
2012
90.9%
78.3%
7.3%
21.4%
1.8%
0.3%
2008
92.5%
76.2%
6.5%
23.5%
1.0%
0.3%
2004
89.6%
70.7%
9.4%
28.9%
1.0%
0.4%
2000
85.2%
71.9%
9.0%
25.9%
5.9%
2.2%
1996
85.2%
69.0%
9.3%
25.6%
5.5%
5.4%
Breakdown of population affiliated with a religious congregation
Type
Adherents
Congregations
Religion
Washington
Newark
Washington
Newark
CATHOLIC CHURCH
12.6%
33.4%
7.4%
10.7%
AMERICAN BAPTIST CHURCHES IN THE USA
6.2%
2.1%
10.3%
8.2%
SOUTHERN BAPTIST CONVENTION
4.4%
0.3%
10.3%
2.6%
EPISCOPAL CHURCH
3.1%
0.9%
5.3%
3.6%
SEVENTH DAY ADVENTIST CHURCH
0.9%
0.8%
1.8%
2.8%
MUSLIM ESTIMATE
0.7%
3.0%
1.1%
2.8%
EVANGELICAL LUTHERAN CHURCH IN AMERICA
0.5%
0.1%
2.1%
1.0%
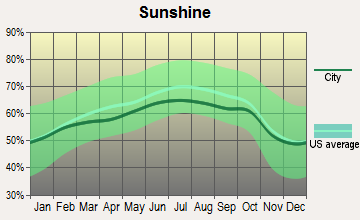
Weather
Washington, D.C. experiences a humid subtropical climate, with hot, humid summers, cool winters, and substantial rainfall throughout the year. Newark also experiences a humid subtropical climate, but with cooler winters, sometimes prone to heavy snow. The summers in Newark are slightly milder than Washington, DC.
Weather and climate
Type
Washington
Newark
Temperature - Average
56.4°F
54°F
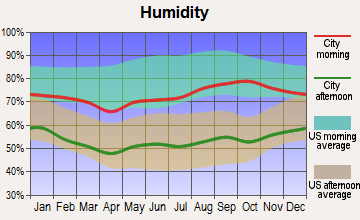
Humidity - Average morning or afternoon humidity
68.8%
67.3%
Humidity - Differences between morning and afternoon humidity
33%
30%
Humidity - Maximum monthly morning or afternoon humidity
81%
77%
Humidity - Minimum monthly morning or afternoon humidity
48%
47%
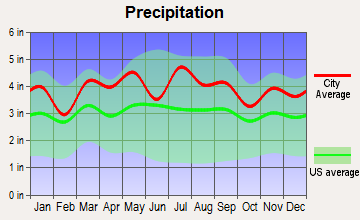
Precipitation - Yearly average
42.7 in
47 in
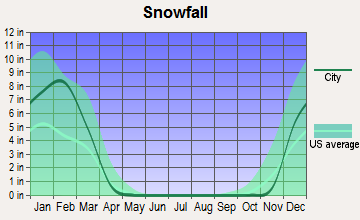
Snowfall - Yearly average
32.4 in
60.3 in
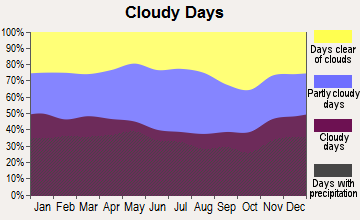
Clouds - Number of days clear of clouds
15.9%
15.7%
Sunshine amount - Average
61.5%
60.2%
Sunshine amount - Differences during a year
21%
20%
Sunshine amount - Maximum monthly
66%
64%
Sunshine amount - Minimum monthly
45%
44%
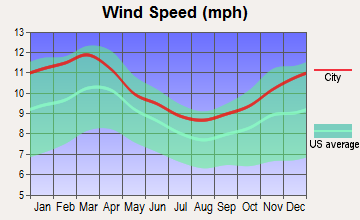
Wind speed - Average
9.7 mph
10.6 mph
Average climate in Washington, District of Columbia
Average climate in Newark, New Jersey
Air pollution
Type
AQI
CO
NO2
OZONE
PB
PM10
PM25
SO2
Year
Washington
Newark
Washington
Newark
Washington
Newark
Washington
Newark
Washington
Newark
Washington
Newark
Washington
Newark
Washington
Newark
2018
88
95
0.32
0.30
11.6
14.4
23.2
23.4
N/A
N/A
16.4
N/A
8.8
8.7
0.8
0.2
2017
84
99
0.32
0.30
12.3
15.1
24.9
22.7
N/A
N/A
16.5
N/A
9.8
8.7
1.0
0.2
2016
98
95
0.43
0.31
14.7
15.5
24.6
23.6
0.002
N/A
17.2
N/A
9.5
8.8
1.0
0.3
2015
91
100
0.34
0.33
14.8
16.7
26.2
23.2
0.002
N/A
17.0
N/A
10.4
8.7
1.3
0.5
2014
85
95
0.33
0.33
11.6
18.8
25.9
23.5
0.002
N/A
17.1
N/A
10.0
8.2
1.0
0.8
2013
88
97
0.34
0.35
11.7
18.3
25.6
23.5
0.002
N/A
17.3
N/A
11.6
9.1
1.0
0.8
2012
103
99
0.58
0.33
15.2
18.5
27.6
23.5
0.002
N/A
N/A
N/A
12.2
9.2
1.6
1.1
2011
105
108
0.67
0.36
15.4
21.2
27.7
22.7
0.002
N/A
N/A
N/A
11.4
8.5
3.1
2.0
2010
114
114
0.88
0.33
15.9
19.4
29.3
26.3
0.003
N/A
N/A
N/A
9.3
8.2
3.4
1.9
2009
90
104
0.86
0.38
16.2
21.6
24.4
19.6
0.002
N/A
N/A
N/A
7.6
9.8
4.6
2.3
2008
103
111
1.23
0.46
16.2
22.4
25.3
21.8
0.003
0.013
N/A
N/A
8.5
12.4
5.6
3.4
2007
113
123
1.17
0.51
16.8
23.5
27.1
22.3
0.004
0.016
N/A
N/A
10.4
12.7
5.1
4.3
2006
114
116
1.11
0.64
17.2
24.6
25.5
21.5
0.004
0.018
N/A
N/A
10.9
12.9
4.5
5.3
2005
105
113
0.86
0.78
20.5
26.1
22.7
20.5
0.006
N/A
N/A
N/A
11.7
N/A
4.5
7.2
2004
113
108
0.62
0.79
21.3
25.4
20.6
19.5
0.004
0.030
N/A
N/A
11.3
N/A
6.5
6.8
2003
108
108
0.90
0.76
23.6
26.1
20.8
18.1
N/A
0.013
N/A
26.9
12.2
N/A
8.3
6.0
2002
125
124
1.16
0.65
23.7
28.5
25.0
18.3
N/A
0.008
N/A
26.1
N/A
N/A
6.7
3.8
2001
113
125
1.07
0.79
23.9
30.1
22.0
21.2
0.017
0.020
N/A
26.7
N/A
N/A
6.7
6.2
2000
115
116
1.17
1.02
20.2
31.2
19.1
20.0
N/A
0.022
N/A
22.2
N/A
N/A
8.2
6.7
Natural disasters
Type
Washington
Newark
Tornado activity compared to U.S. average
110.6%
64.1%
Earthquake activity compared to U.S. average
42.9%
31.6%
Natural disasters compared to U.S. average
19%
30%
Transportation
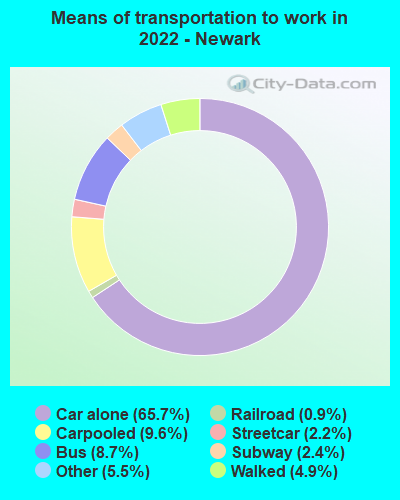
Both cities have well-established public transportation systems. In D.C., the Metrorail and Metrobus are the most common means of public transportation. Newark residents often rely on the Newark Light Rail, buses, and the PATH train. Both cities have traffic congestion issues, but D.C. ranks higher in terms of congestion levels.
Transport
Type
Washington
Newark
Amtrak stations
1
2
Amtrak stations nearby
3
3
FAA registered aircraft
456
20
FAA registered aircraft manufacturers and dealers
3
0
Means of transportation to work
Type
Washington
Newark
Bicycle
2%
0.2%
Bus
6.3%
6.8%
Carpooled
7.8%
9.2%
Car alone
62.5%
69.3%
Railroad
0.3%
0.2%
Streetcar
10.6%
0.9%
Subway
1.3%
1.2%
Taxicab
0.8%
0.7%
Walked
5.7%
3.5%
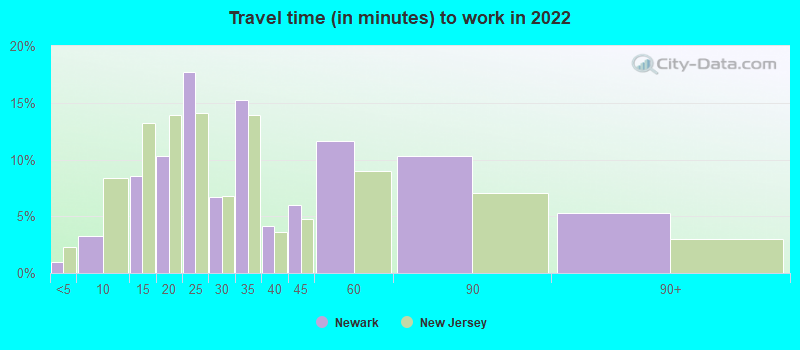
Average travel time to work
Type
Washington
Newark
Average
39.2 min
33.2 min
Other means
26 min
28 min
Public transportation
38.9 min
45.1 min
Private vehicle occupancy
Type
Washington
Newark
Average
1.1
1.2
Drove alone
89.4%
81.7%
In 2 person carpool
9.7%
14.8%
In 3 person carpool
0.6%
2.4%
In 4 person carpool
0.4%
0.6%
In 7+ person carpool
0%
0.4%
How many people usually rode to work in the car, truck or van.
Real Estate
Real estate in Washington, D.C. is more expensive than in Newark. The median home cost in D.C. is significantly higher than in Newark. Both cities have active rental markets, but again, rents are considerably higher in D.C.
Neighborhoods
Washington, D.C. offers varied neighborhoods from the historic Georgetown to the urban living experience in areas like Adams Morgan and Capitol Hill. Newark also presents an array of neighborhoods such as the Ironbound District known for its vibrant food scene or the tranquil Forest Hill.
Houses and residents
Type
Washington
Newark
Houses
357,482
122,145
Average household size (people)
2.1
2.8
Median year apartment built
1965
1967
Median year house/condo built
1941
1960
Length of stay in the house since moving in
13.5 years
17.1 years
Houses occupied
319,565 (89.4%)
115,145 (94.3%)
Houses occupied by owners
132,936 (41.6%)
24,002 (20.8%)
Houses occupied by renters
186,629 (58.4%)
91,143 (79.2%)
Median rent asked for vacant for-rent units
$2,791
$408.22
Median monthly housing costs
$1,817
$1,277
Median price asked for vacant for-sale houses and condos
$996,150
$153,754
Estimated median house or condo value
$669,900
$323,200
Median numbers of rooms
3.8
4.5
Median number of rooms in apartments
3.1
4.2
Median number of rooms in houses and condos
6
5.7
Median house price - detached houses
Over $1,000,000
$321,688
Median house price - in 2-unit structures
Over $1,000,000
$347,644
Median house price - in 3-to-4-unit structures
$471,443
$337,992
Median house price - in 5 or more unit structures
$527,983
$210,604
Median house price - Townhouses or other attached units
$817,288
$224,107
Median house price - All housing units
$790,542
$325,388
Median house age
65
55
Renting percentage
58%
77.9%
Housing density (houses/condos per square mile)
5,821.9
5,132.8
House value disparities
26.7%
31.5%
Household income disparities
45.7%
47.8%
Median household income for houses/condes with a mortgage
$163,111
$71,676
Median household income for apartments without a mortgage
$108,852
$62,906
Housing units without a mortgage
777 (0.8%)
459 (2.7%)
Housing units with both a second mortgage and home equity loan
8,586 (8.5%)
647 (3.8%)
Housing units with a mortgage
100,122 (99.2%)
16,603 (97.3%)
Housing units with a home equity loan
1,057 (1%)
0 (0%)
Housing units with a second mortgage
12,793 (12.7%)
769 (4.5%)
House/condo owner moved in on average (years ago)
10
18
House/condo renter moved in on average (years ago)
1
5
Housing units lacking complete kitchen facilities
1.5%
2.3%
Housing units lacking complete plumbing facilities
1.5%
1%
Housing units in structures
Housing units in structures
Washington
Newark
One, detached
11.2%
10.7%
One, attached
22.2%
11.4%
Two
2.7%
19.5%
3 or 4
6.8%
21.1%
5 to 9
7.3%
8.2%
10 to 19
8.5%
6.0%
20 to 49
7.6%
6.5%
50 or more
33.6%
15.8%
Mobile homes
0.2%
0.9%
Boats, RVs, vans, etc.
0.0%
0.1%
Median real estate property taxes paid for housing units
Self-employed workers in own not incorporated business
16,654
7,752
State government workers
6,699
5,591
Unpaid family workers
580
121
Industries and Occupations
In Washington, D.C., the most prevalent industries are public administration, professional, scientific, and technical services. Newark, on the other hand, has a balanced mix of industries including manufacturing, education, healthcare, and retail trade.
In health care, D.C. ranks higher than Newark. It's home to some top-rated hospitals, including MedStar Georgetown University Hospital and George Washington University Hospital. In contrast, Newark's top hospital is the Rutgers New Jersey Medical School.
Health (county statistics)
Type
Washington
Newark
General health status score of residents in this county from 1 (poor) to 5 (excellent)
Washington, D.C. has world-class infrastructure, with well-maintained roads, transit systems, and public amenities. It's home to three major airports and has robust telecommunications and utilities infrastructure. Newark also has solid infrastructure due to its status as a significant transportation and shipping hub.
Infrastructure
Type
Washington
Newark
Hospitals
114
8
TV stations
27
31
Bank branches located here
247
69
Bank institutions located here
34
19
Main business address for public companies
30
15
Drinking water stations with no reported violations in the past
5
0
Drinking water stations with reported violations in the past
HMDA - Conventional home purchase loans - Applications denied
Year
Washington
Newark
1999
1,328
429
2000
1,438
515
2001
935
536
2002
886
547
2003
1,319
740
2004
2,281
1,167
2005
2,920
2,198
2006
3,362
3,193
2007
2,548
2,300
2008
1,095
508
2009
514
182
Culture and Food
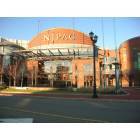
D.C. has a rich and diverse cultural scene featuring world-class museums, performing arts venues, and a multicultural food scene that spans the globe. Newark, while smaller, also offers a vibrant cultural scene, particularly in performing arts with contributions from notable institutions such as the New Jersey Performing Arts Center. Its food scene is marked by multicultural influences, with Portuguese and Brazilian cuisine reigning in the Ironbound district.
Sports Teams
D.C. is home to multiple major league sports teams, including the Washington Nationals (MLB), Washington Wizards (NBA), and the Washington Capitals (NHL). Newark primarily hosts the New Jersey Devils (NHL), while other major league teams in football and baseball play in nearby East Rutherford.


 Washington, DC
 Newark, NJ