Washington, D.C., the U.S. capital, and Virginia Beach, a coastal city in southeastern Virginia, offer different but appealing lifestyles. D.C. is bustling, full of history and political activity, whereas Virginia Beach offers a relaxed, seaside lifestyle. Comparisons between the two reveal differences in crime and safety, weather, cost of living, education, and more. Understanding these contrasts will help guide decisions for relocation or vacation planning.
Distance between
Washington, DC and
Virginia Beach, VA : 152.3 miles
Washington's population is larger by 46%. Its population has grown by 97,991 people (17.1%) since 2000. The population of Virginia Beach has grown by 32,415 people (7.6%) during that time.
Washington, D.C. has a higher crime rate than the national average, including property crimes and violent crimes. Despite this, the city is making progress in reducing crime rates. Virginia Beach, on the other hand, has a lower crime rate than the national average, making it one of the safest cities in the country. It is a family-friendly city with several safe neighborhoods.
City-data.com crime index counts serious crimes and violent crime more heavily. It adjusts for the number of visitors and daily workers commuting into cities. (higher means more crime, U.S. average = 301.1)
City-data.com crime index counts serious crimes and violent crime more heavily. It adjusts for the number of visitors and daily workers commuting into cities. (higher means more crime, U.S. average = 301.1)
Sex Offenders
According to our data, there are 1,072 registered sex offenders living in Washington and 706 registered sex offenders living in . The ratio of residents to sex offenders in Washington is 635 to 1; the ratio in Virginia Beach is 641 to 1. The number of registered sex offenders compared to the number of residents in Washington is near to than in Virginia Beach.
Cost of Living
When compared to the national average, the cost of living in Washington, D.C., is significantly higher. This is due to high housing costs, taxes, and expenses associated with urban living. Virginia Beach, on the other hand, has a lower cost of living with more affordable housing options and lower overall expenses.
Income Tax
Washington, D.C. operates on a progressive income tax system, with rates ranging from 4% to 8.95% depending on income. Virginia has a progressive income tax, with rates ranging from 2% to 5.75%.
Property Tax
Property taxes in Washington are generally lower than the national average, attracting many home buyers. Virginia Beach's property tax rates are also reasonable and generally comparable to other cities in the state of Virginia.
Sales Tax
Washington, D.C.'s general sales tax rate is 6%. This rate applies to most retail sales within the district. Virginia Beach, located in Virginia, has a combined state and local sales tax rate of 6%, which includes a 4.3% state sales tax along with a 1.7% local rate.
Income
Type
Washington
Virginia Beach
Estimated median household income
$90,088
$81,634
Estimated per capita income
$65,808
$42,498
Cost of living index (U.S. average is 100)
124.2
97
If you make $50,000 in Virginia Beach, you will have to make $64,021 in Washington to maintain the same standard of living.
Geographical Conditions
Washington, D.C. is a coastal plain on the east coast of the U.S., bordering Maryland and Virginia. Virginia Beach is located on the southeastern coast of Virginia, bordered by the Atlantic Ocean and Chesapeake Bay.
Washington, D.C., is home to some of the nation's top universities, including George Washington University and Georgetown University. It also has a number of high-performing public and private schools, but struggles with inconsistency in quality. Virginia Beach's school system is generally very well-regarded, with several top-performing public schools and universities such as Regent University.
Washington's economy is driven by the federal government, but there is also a significant presence in sectors like tourism, education, and health services. Virginia Beach, however, has a diverse economy with sectors like defense, tourism, agribusiness and maritime industry playing key roles. Unemployment rates in both cities are generally comparable to the national average.
Biggest Employers
In Washington, D.C., the federal government is the biggest employer, followed by universities and hospitals, including Georgetown University and MedStar Health. Virginia Beach's largest employers encompass the health sector, schools, and the military, including Sentara Healthcare and the Virginia Beach City Public Schools.
There were 376 building permits issued in Washington in 2012 (149 more than in 2011) compared to 335 building permits issued in Virginia Beach in 2012 (200 less than in 2011).
In Washington (District of Columbia), 90.9% voted for Democrats and 7.3% for Republicans in 2012 Presidential Election. In Virginia Beach (Virginia Beach city), 48.1% voted for Democrats and 50.7% for Republicans.
Elections
Type
Democrats
Republicans
Other
Year
Washington
Virginia Beach
Washington
Virginia Beach
Washington
Virginia Beach
2020
92.6%
51.6%
5.4%
46.2%
2.0%
2.2%
2016
90.9%
44.8%
4.1%
48.4%
5.0%
6.8%
2012
90.9%
48.1%
7.3%
50.7%
1.8%
1.2%
2008
92.5%
49.3%
6.5%
50.1%
1.0%
0.6%
2004
89.6%
40.4%
9.4%
59.3%
1.0%
0.4%
2000
85.2%
41.8%
9.0%
56.1%
5.9%
2.1%
1996
85.2%
41.4%
9.3%
50.6%
5.5%
8.0%
Breakdown of population affiliated with a religious congregation
Type
Adherents
Congregations
Religion
Washington
Virginia Beach
Washington
Virginia Beach
CATHOLIC CHURCH
12.6%
10.7%
7.4%
4.2%
AMERICAN BAPTIST CHURCHES IN THE USA
6.2%
0.4%
10.3%
0.4%
SOUTHERN BAPTIST CONVENTION
4.4%
4.9%
10.3%
13.6%
EPISCOPAL CHURCH
3.1%
1.4%
5.3%
4.2%
SEVENTH DAY ADVENTIST CHURCH
0.9%
0.1%
1.8%
1.1%
MUSLIM ESTIMATE
0.7%
0.8%
1.1%
0.4%
EVANGELICAL LUTHERAN CHURCH IN AMERICA
0.5%
0.4%
2.1%
1.5%
Weather
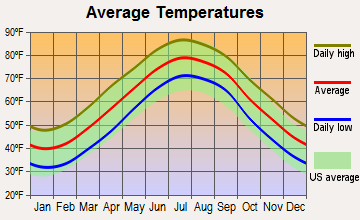
Both cities experience humid subtropical climates. Washington, D.C., has hot, humid summers and generally mild winters, but the city can face harsh conditions with heavy snowfall. In contrast, Virginia Beach enjoys a slightly milder climate due to its proximity to the Atlantic Ocean. It has warm summers and mild winters, which attracts tourists seeking a beach vacation.
Weather and climate
Type
Washington
Virginia Beach
Temperature - Average
56.4°F
59.7°F
Humidity - Average morning or afternoon humidity
68.8%
73%
Humidity - Differences between morning and afternoon humidity
33%
32%
Humidity - Maximum monthly morning or afternoon humidity
81%
83%
Humidity - Minimum monthly morning or afternoon humidity
48%
51%
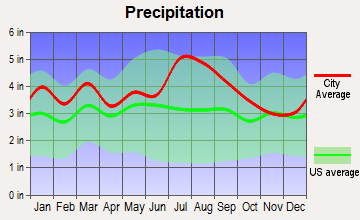
Precipitation - Yearly average
42.7 in
45.9 in
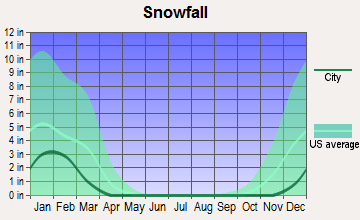
Snowfall - Yearly average
32.4 in
15.4 in
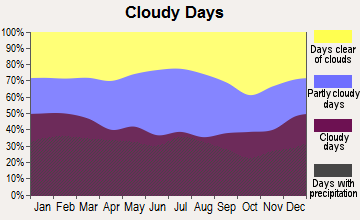
Clouds - Number of days clear of clouds
15.9%
17.6%
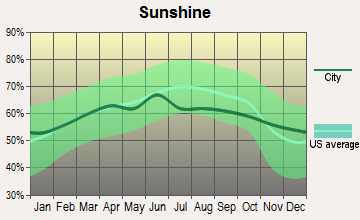
Sunshine amount - Average
61.5%
66.8%
Sunshine amount - Differences during a year
21%
14%
Sunshine amount - Maximum monthly
66%
67%
Sunshine amount - Minimum monthly
45%
53%
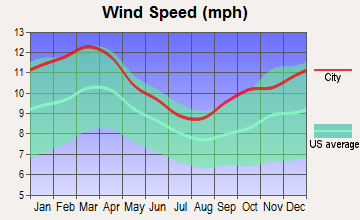
Wind speed - Average
9.7 mph
10.4 mph
Average climate in Washington, District of Columbia
Average climate in Virginia Beach, Virginia
Air pollution
Type
AQI
CO
NO2
OZONE
PB
PM10
PM25
SO2
Year
Washington
Virginia Beach
Washington
Virginia Beach
Washington
Virginia Beach
Washington
Virginia Beach
Washington
Virginia Beach
Washington
Washington
Virginia Beach
Washington
Virginia Beach
2018
88
57
0.32
0.27
11.6
6.3
23.2
31.3
N/A
0.002
16.4
N/A
8.8
6.1
0.8
0.4
2017
84
60
0.32
0.22
12.3
6.8
24.9
33.2
N/A
0.002
16.5
N/A
9.8
6.9
1.0
0.3
2016
98
66
0.43
0.21
14.7
6.5
24.6
31.7
0.002
0.002
17.2
N/A
9.5
6.1
1.0
0.4
2015
91
57
0.34
0.27
14.8
7.3
26.2
33.8
0.002
0.002
17.0
N/A
10.4
6.4
1.3
0.5
2014
85
59
0.33
0.27
11.6
7.5
25.9
33.8
0.002
0.002
17.1
N/A
10.0
6.8
1.0
1.1
2013
88
66
0.34
0.28
11.7
7.1
25.6
31.2
0.002
0.002
17.3
N/A
11.6
6.8
1.0
1.1
2012
103
76
0.58
0.29
15.2
7.8
27.6
34.6
0.002
0.002
N/A
N/A
12.2
8.1
1.6
1.1
2011
105
66
0.67
0.27
15.4
9.2
27.7
35.1
0.002
0.003
N/A
N/A
11.4
8.8
3.1
1.7
2010
114
71
0.88
0.25
15.9
4.8
29.3
38.4
0.003
0.004
N/A
N/A
9.3
N/A
3.4
2.2
2009
90
51
0.86
0.25
16.2
9.7
24.4
31.5
0.002
0.012
N/A
N/A
7.6
N/A
4.6
2.6
2008
103
77
1.23
0.23
16.2
10.3
25.3
36.2
0.003
0.004
N/A
N/A
8.5
N/A
5.6
3.3
2007
113
81
1.17
0.18
16.8
12.2
27.1
36.3
0.004
0.004
N/A
N/A
10.4
N/A
5.1
4.3
2006
114
62
1.11
0.32
17.2
N/A
25.5
36.2
0.004
0.004
N/A
N/A
10.9
N/A
4.5
3.4
2005
105
67
0.86
0.28
20.5
N/A
22.7
35.4
0.006
N/A
N/A
N/A
11.7
N/A
4.5
3.4
2004
113
80
0.62
0.30
21.3
15.9
20.6
33.3
0.004
N/A
N/A
N/A
11.3
N/A
6.5
4.3
2003
108
84
0.90
0.34
23.6
16.2
20.8
34.3
N/A
N/A
N/A
N/A
12.2
N/A
8.3
3.9
2002
125
99
1.16
0.40
23.7
17.8
25.0
38.0
N/A
N/A
N/A
N/A
N/A
N/A
6.7
5.9
2001
113
92
1.07
0.42
23.9
18.2
22.0
36.3
0.017
N/A
N/A
N/A
N/A
N/A
6.7
6.0
2000
115
85
1.17
0.44
20.2
15.7
19.1
36.5
N/A
N/A
N/A
N/A
N/A
N/A
8.2
6.5
Natural disasters
Type
Washington
Virginia Beach
Tornado activity compared to U.S. average
110.6%
61.5%
Earthquake activity compared to U.S. average
42.9%
35.2%
Natural disasters compared to U.S. average
19%
0%
Transportation
Washington, D.C.'s public transit system is extensive, with Metrorail and Metrobus routes serving the city and suburbs. Virginia Beach, however, relies heavily on private vehicles for commuting, with limited public transit services.
Transport
Type
Washington
Virginia Beach
Amtrak stations
1
1
Amtrak stations nearby
3
2
FAA registered aircraft
456
374
FAA registered aircraft manufacturers and dealers
3
4
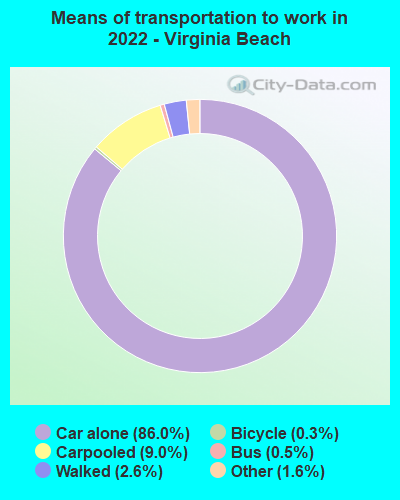
Means of transportation to work
Type
Washington
Virginia Beach
Bicycle
2%
0.2%
Bus
6.3%
1%
Carpooled
7.8%
9.5%
Car alone
62.5%
84.2%
Motorcycle
0.1%
0.1%
Railroad
0.3%
0%
Streetcar
10.6%
0%
Subway
1.3%
0%
Taxicab
0.8%
0%
Walked
5.7%
3.2%
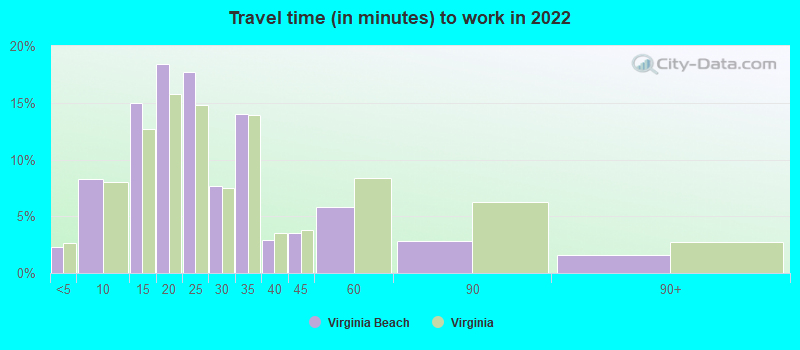
Average travel time to work
Type
Washington
Virginia Beach
Average
39.2 min
24.8 min
Other means
26 min
23.7 min
Public transportation
38.9 min
41.9 min
Private vehicle occupancy
Type
Washington
Virginia Beach
Average
1.1
1.1
Drove alone
89.4%
90.3%
In 2 person carpool
9.7%
8%
In 3 person carpool
0.6%
1.3%
In 4 person carpool
0.4%
0.2%
How many people usually rode to work in the car, truck or van.
Real Estate
Due to high demand, Washington, D.C.'s real-estate market is competitive, with higher home prices compared to the national average. Virginia Beach offers a more affordable housing market, albeit seasonal price fluctuations are common due to its coastal location.
Neighborhoods
D.C. is known for its historic neighborhoods like Georgetown and Capitol Hill, while the more modern Navy Yard and Wharf District capture urban waterfront living. Virginia Beach offers neighborhoods that cater to different lifestyles, from lively beachfront communities to peaceful suburban neighborhoods.
Houses and residents
Type
Washington
Virginia Beach
Houses
357,482
190,981
Average household size (people)
2.1
2.6
Median year apartment built
1965
1988
Median year house/condo built
1941
1983
Length of stay in the house since moving in
13.5 years
13.5 years
Houses occupied
319,565 (89.4%)
182,775 (95.7%)
Houses occupied by owners
132,936 (41.6%)
119,144 (65.2%)
Houses occupied by renters
186,629 (58.4%)
63,631 (34.8%)
Median rent asked for vacant for-rent units
$2,791
$1,833
Median monthly housing costs
$1,817
$1,490
Median price asked for vacant for-sale houses and condos
$996,150
$508,833
Estimated median house or condo value
$669,900
$328,500
Median numbers of rooms
3.8
6
Median number of rooms in apartments
3.1
4.6
Median number of rooms in houses and condos
6
7
Median house price - detached houses
Over $1,000,000
$459,164
Median house price - in 2-unit structures
Over $1,000,000
$200,674
Median house price - in 3-to-4-unit structures
$471,443
$279,464
Median house price - in 5 or more unit structures
$527,983
$229,647
Median house price - Townhouses or other attached units
$817,288
$261,878
Median house price - All housing units
$790,542
$401,957
Median house age
65
36
Renting percentage
58%
34.7%
Housing density (houses/condos per square mile)
5,821.9
769.2
House value disparities
26.7%
29%
Household income disparities
45.7%
40.6%
Median household income for houses/condes with a mortgage
$163,111
$104,941
Median household income for apartments without a mortgage
$108,852
$82,507
Housing units without a mortgage
777 (0.8%)
2,373 (2.6%)
Housing units with both a second mortgage and home equity loan
8,586 (8.5%)
9,070 (10%)
Housing units with a mortgage
100,122 (99.2%)
88,748 (97.4%)
Housing units with a home equity loan
1,057 (1%)
287 (0.3%)
Housing units with a second mortgage
12,793 (12.7%)
10,952 (12%)
House/condo owner moved in on average (years ago)
10
10
House/condo renter moved in on average (years ago)
1
1
Housing units lacking complete kitchen facilities
1.5%
1%
Housing units lacking complete plumbing facilities
1.5%
0.4%
Housing units in structures
Housing units in structures
Washington
Virginia Beach
One, detached
11.2%
53.2%
One, attached
22.2%
18.3%
Two
2.7%
1.7%
3 or 4
6.8%
4.6%
5 to 9
7.3%
9.0%
10 to 19
8.5%
4.5%
20 to 49
7.6%
2.1%
50 or more
33.6%
5.4%
Mobile homes
0.2%
1.1%
Median real estate property taxes paid for housing units
Self-employed workers in own not incorporated business
16,654
9,992
State government workers
6,699
6,577
Unpaid family workers
580
251
Industries and Occupations
Washington's major industries include government, education and health services. Meanwhile, Virginia Beach's primary industries include defense, tourism, and the maritime industry. Common occupations in D.C. include management and business roles, while in Virginia Beach, roles in sales, management and military occupations dominate.
Both cities have access to high-quality healthcare facilities. In Washington, D.C., there is a high concentration of top-rated hospitals, including Georgetown University Hospital and George Washington University Hospital. Virginia Beach healthcare includes the highly-rated Sentara Virginia Beach General Hospital and the Naval Medical Center.
Health (county statistics)
Type
Washington
Virginia Beach
General health status score of residents in this county from 1 (poor) to 5 (excellent)
Washington, D.C., boasts a well-developed infrastructure for pedestrians and cyclists. In contrast, Virginia Beach emphasizes car travel, but efforts are being made to improve pedestrian accessibility and public transit. Both cities have extensive parks and recreational spaces.
Infrastructure
Type
Washington
Virginia Beach
Hospitals
114
7
TV stations
27
24
Bank branches located here
247
96
Bank institutions located here
34
16
Main business address for public companies
30
2
Drinking water stations with no reported violations in the past
5
6
Drinking water stations with reported violations in the past
HMDA - Conventional home purchase loans - Applications denied
Year
Washington
Virginia Beach
1999
1,328
0
2000
1,438
0
2001
935
0
2002
886
0
2003
1,319
941
2004
2,281
1,388
2005
2,920
1,545
2006
3,362
1,502
2007
2,548
1,073
2008
1,095
340
2009
514
167
Culture and Food
D.C. is a significant hub for cultural and historical attractions, like the Smithsonian museums and the Kennedy Center. Its food scene is influenced by international cuisine. Virginia Beach, on the other hand, is renowned for its stunning beaches, festivals, and seafood dining options.
Sports Teams
D.C. is a haven for sports fans, home to major professional teams like the Washington Nationals (MLB), Washington Capitals (NHL), and Washington Football Team (NFL). Virginia Beach does not have any major league teams, but offers plenty of recreational sports opportunities, from beach volleyball to surfing.


 Washington, DC
 Virginia Beach, VA