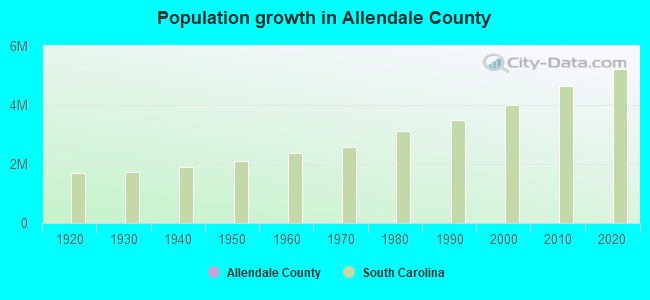
Allendale County, South Carolina (SC)
County owner-occupied free and clear houses and condos in 2010: 1,363
County owner-occupied houses and condos in 2000: 2,839
Renter-occupied apartments: 1,311 (it was 1,076 in 2000)
| % of renters here: | 27% |
| State: | 31% |
Land area: 408 sq. mi.
Water area: 4.4 sq. mi.
Population density: 20 people per square mile (low).
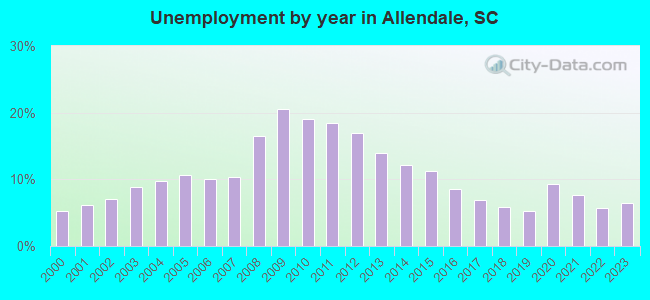
Industries providing employment: Educational, health and social services (28.7%), Manufacturing (13.2%), Retail trade (12.0%).
Type of workers:
- Private wage or salary: 72%
- Government: 24%
- Self-employed, not incorporated: 4%
- Unpaid family work: 0%
- OSM Map
- General Map
- Google Map
- MSN Map

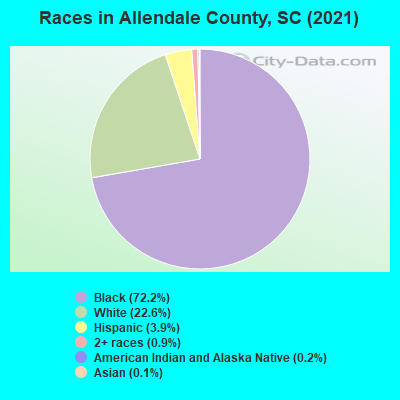
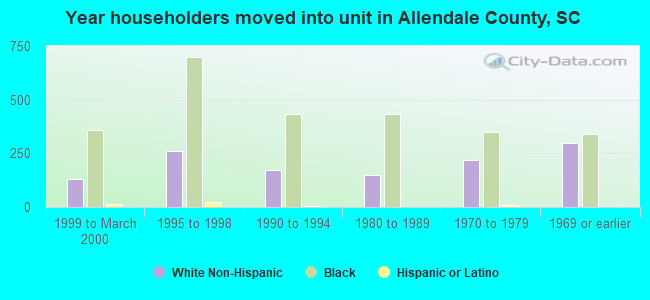
- 5,79171.0%Black Non-Hispanic Alone
- 1,82922.4%White Non-Hispanic Alone
- 3234.0%Hispanic or Latino
- 1531.9%Two or more races
- 400.5%Asian alone
- 150.2%American Indian and Alaska Native alone
- 10.01%Native Hawaiian and Other
Pacific Islander alone
| Median resident age: | 43.6 years |
| South Carolina median age: | 40.5 years |
| Males: 4,522 | |
| Females: 3,770 |


| Allendale County: | 2.0 people |
| South Carolina: | 2 people |
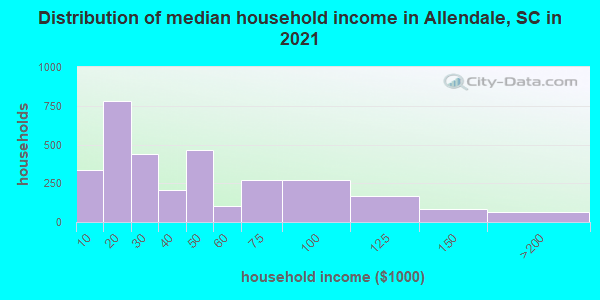
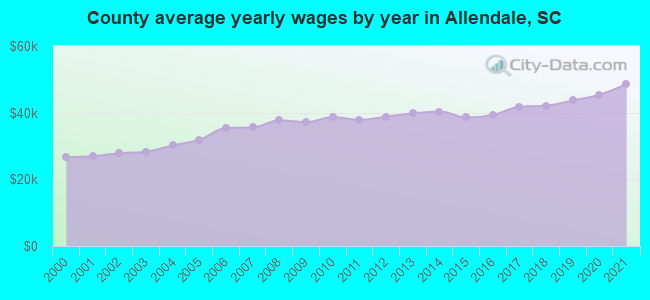
Estimated median household income in 2022: $37,382 ($20,898 in 1999)
| This county: | $37,382 |
| South Carolina: | $64,115 |
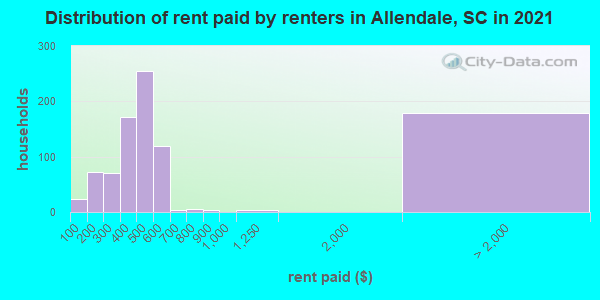
Median contract rent in 2022 for apartments: $478 (lower quartile is $316, upper quartile is $540)
| This county: | $478 |
| State: | $893 |
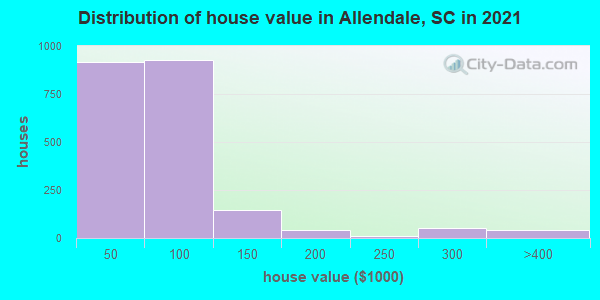
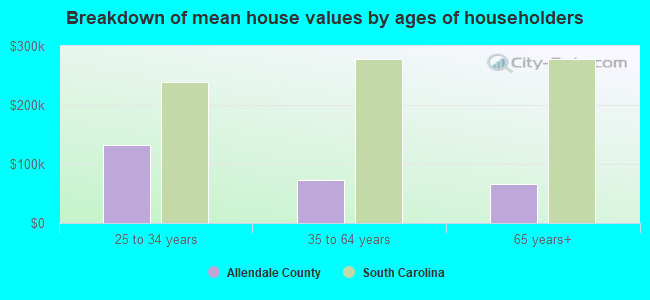
Estimated median house or condo value in 2022: $72,777 (it was $44,300 in 2000)
| Allendale: | $72,777 |
| South Carolina: | $254,600 |
Median monthly housing costs for homes and condos with a mortgage: $1,015
Median monthly housing costs for units without a mortgage: $393
Institutionalized population: 1,299
Crime in 2021 (reported by the sheriff's office or county police, not the county total):
- Murders: 0
- Rapes: 0
- Robberies: 0
- Assaults: 4
- Burglaries: 1
- Thefts: 27
- Auto thefts: 4
Crime in 2020 (reported by the sheriff's office or county police, not the county total):
- Murders: 0
- Rapes: 1
- Robberies: 0
- Assaults: 4
- Burglaries: 6
- Thefts: 28
- Auto thefts: 10
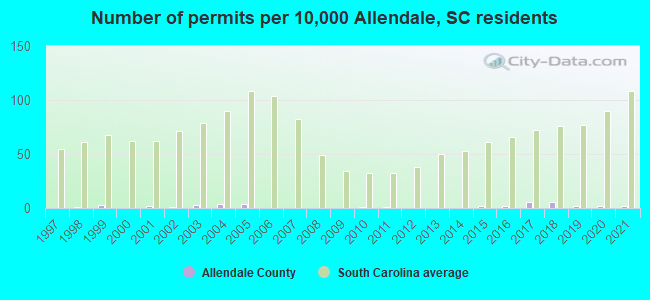
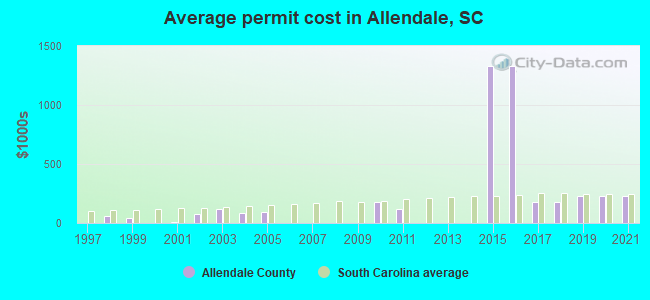
Single-family new house construction building permits:
- 2022: 2 buildings, average cost: $150,000
- 2021: 2 buildings, average cost: $228,400
- 2020: 2 buildings, average cost: $228,400
- 2019: 2 buildings, average cost: $228,400
- 2018: 7 buildings, average cost: $175,600
- 2017: 7 buildings, average cost: $175,600
- 2016: 2 buildings, average cost: $1,332,500
- 2015: 2 buildings, average cost: $1,332,500
- 2014: 0 buildings
- 2013: 0 buildings
- 2012: 0 buildings
- 2011: 1 building, cost: $120,000
- 2010: 1 building, cost: $173,500
- 2009: 0 buildings
- 2008: 0 buildings
- 2007: 0 buildings
- 2006: 0 buildings
- 2005: 4 buildings, average cost: $88,500
- 2004: 4 buildings, average cost: $81,200
- 2003: 3 buildings, average cost: $117,500
- 2002: 1 building, cost: $80,000
- 2001: 2 buildings, average cost: $10,100
- 2000: 0 buildings
- 1999: 3 buildings, average cost: $42,300
- 1998: 1 building, cost: $57,000
- 1997: 0 buildings
Median real estate property taxes paid for housing units with mortgages in 2022: $577 (0.6%)
Median real estate property taxes paid for housing units with no mortgage in 2022: $539 (0.9%)
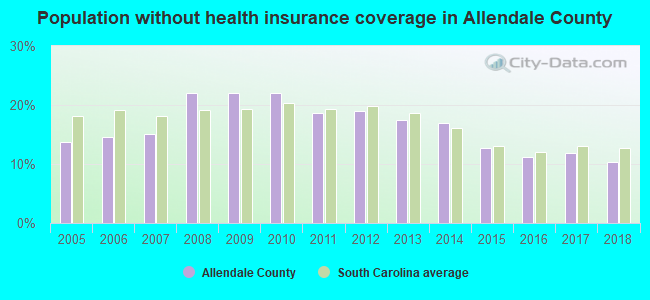
| Allendale County: | 26.5% |
| South Carolina: | 14.0% |
Median age of residents in 2022: 43.6 years old
(Males: 40.7 years old, Females: 46.9 years old)
(Median age for: White residents: 50.6 years old, Black residents: 42.6 years old, Asian residents: 33.2 years old, Hispanic or Latino residents: 26.7 years old, Other race residents: 35.1 years old)
Fair market rent in 2006 for a 1-bedroom apartment in Allendale County is $433 a month.
Fair market rent for a 2-bedroom apartment is $481 a month.
Fair market rent for a 3-bedroom apartment is $597 a month.
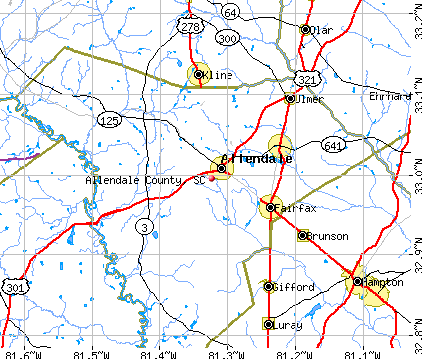
Cities in this county include: Allendale, Fairfax, Millett, Sycamore, Ulmer.
Neighboring counties: Ellis County, Texas  , Richmond County, Georgia
  , Upson County, Georgia , Warren County, Georgia , Palo Pinto County, Texas .
| Here: | 6.0% |
| South Carolina: | 3.1% |

Current college students: 439
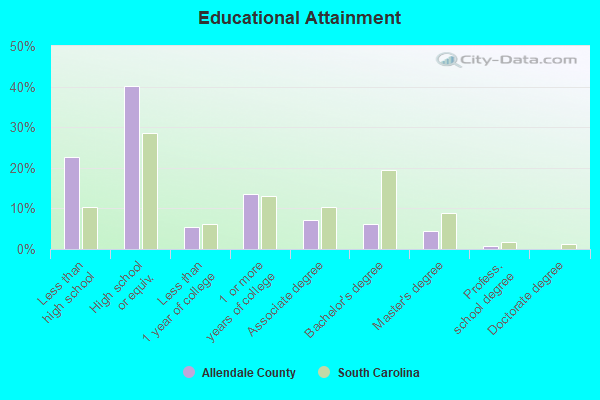
People 25 years of age or older with a high school degree or higher: 78.9%
People 25 years of age or older with a bachelor's degree or higher: 10.8%
Number of foreign born residents: 80 (24.4% naturalized citizens)
| Allendale County: | 1.0% |
| Whole state: | 5.2% |
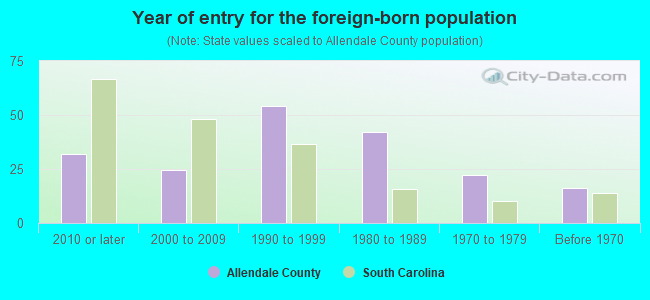
- Year of entry for the foreign-born population
- 232010 or later
- 182000 to 2009
- 151990 to 1999
- 421980 to 1989
- 221970 to 1979
- 16Before 1970
Mean travel time to work (commute): % minutes
Percentage of county residents living and working in this county: 93.0%


Housing units in structures:
- One, detached: 2,858
- One, attached: 82
- Two: 40
- 3 or 4: 137
- 5 to 9: 39
- 10 to 19: 2
- 20 to 49: 66
- 50 or more: 20
- Mobile homes: 946
Housing units in Allendale County with a mortgage: 788 (44 second mortgage, 1 home equity loan, 19 both second mortgage and home equity loan)
Houses without a mortgage: 28
| Here: | 96.6% with mortgage |
| State: | 97.3% with mortgage |
Religion statistics for Allendale County
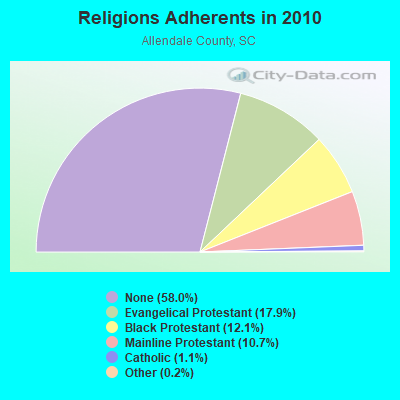
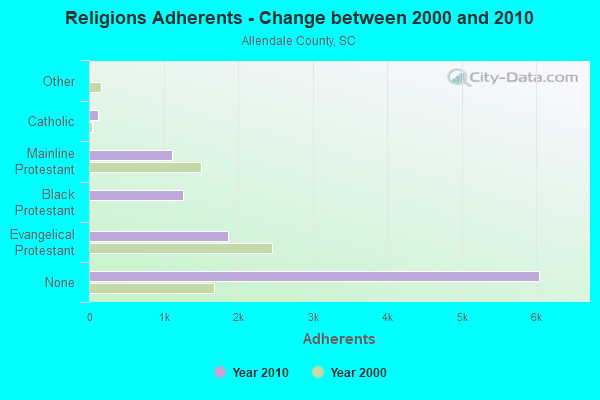
| Religion | Adherents | Congregations |
|---|---|---|
| Evangelical Protestant | 1,868 | 9 |
| Black Protestant | 1,264 | 7 |
| Mainline Protestant | 1,112 | 13 |
| Catholic | 115 | 1 |
| Other | 20 | - |
| None | 6,040 | - |
Source: Clifford Grammich, Kirk Hadaway, Richard Houseal, Dale E.Jones, Alexei Krindatch, Richie Stanley and Richard H.Taylor. 2012. 2010 U.S.Religion Census: Religious Congregations & Membership Study. Association of Statisticians of American Religious Bodies. Jones, Dale E., et al. 2002. Congregations and Membership in the United States 2000. Nashville, TN: Glenmary Research Center.
Food Environment Statistics:
| Allendale County: | 2.87 / 10,000 pop. |
| State: | 1.99 / 10,000 pop. |
| This county: | 3.83 / 10,000 pop. |
| South Carolina: | 0.85 / 10,000 pop. |
| Allendale County: | 4.78 / 10,000 pop. |
| South Carolina: | 5.38 / 10,000 pop. |
| This county: | 0.96 / 10,000 pop. |
| State: | 7.75 / 10,000 pop. |
| Allendale County: | 13.9% |
| South Carolina: | 10.6% |
| Allendale County: | 34.5% |
| State: | 29.4% |
| Here: | 11.9% |
| State: | 13.4% |
Agriculture in Allendale County:
Average size of farms: 690 acresAverage value of agricultural products sold per farm: $66,534
Average value of crops sold per acre for harvested cropland: $225.16
The value of nursery, greenhouse, floriculture, and sod as a percentage of the total market value of agricultural products sold: 0.00%
The value of livestock, poultry, and their products as a percentage of the total market value of agricultural products sold: 19.78%
Average total farm production expenses per farm: $100,399
Harvested cropland as a percentage of land in farms: 34.33%
Average market value of all machinery and equipment per farm: $82,469
The percentage of farms operated by a family or individual: 89.10%
Average age of principal farm operators: 59 years
Average number of cattle and calves per 100 acres of all land in farms: 6.13
Corn for grain: 10244 harvested acres
All wheat for grain: 9191 harvested acres
Upland cotton: 2593 harvested acres
Soybeans for beans: 13031 harvested acres
Vegetables: 743 harvested acres
Earthquake activity:
Allendale County-area historical earthquake activity is significantly above South Carolina state average. It is 33% smaller than the overall U.S. average.On 8/2/1974 at 08:52:09, a magnitude 4.9 (4.3 MB, 4.9 LG, Class: Light, Intensity: IV - V) earthquake occurred 90.5 miles away from Allendale County center
On 11/22/1974 at 05:25:55, a magnitude 4.7 (4.7 MB) earthquake occurred 68.8 miles away from the county center
On 8/21/1992 at 16:31:55, a magnitude 4.4 (4.1 MB, 4.1 LG, 4.4 LG, Depth: 6.2 mi) earthquake occurred 70.2 miles away from the county center
On 8/9/2020 at 12:07:37, a magnitude 5.1 (5.1 MW, Depth: 4.7 mi, Class: Moderate, Intensity: VI - VII) earthquake occurred 241.2 miles away from the county center
On 8/23/2011 at 17:51:04, a magnitude 5.8 (5.8 MW, Depth: 3.7 mi) earthquake occurred 389.9 miles away from Allendale County center
On 2/15/2014 at 03:23:38, a magnitude 4.1 (4.1 MW, Depth: 3.2 mi) earthquake occurred 72.1 miles away from the county center
Magnitude types: regional Lg-wave magnitude (LG), body-wave magnitude (MB), moment magnitude (MW)
Most recent natural disasters:
- South Carolina Covid-19 Pandemic, Incident Period: January 20, 2020, FEMA Id: 4492, Natural disaster type: Other
- South Carolina Hurricane Dorian, Incident Period: August 31, 2019 - September 6, 2019, FEMA Id: 4464, Natural disaster type: Hurricane
- South Carolina Hurricane Irma, Incident Period: September 6, 2017 - September 13, 2017, FEMA Id: 4346, Natural disaster type: Hurricane
- South Carolina Hurricane Matthew, Incident Period: October 04, 2016 to October 30, 2016, Emergency Declared EM-3378: October 06, 2016, FEMA Id: 3378, Natural disaster type: Hurricane
- South Carolina Hurricane Matthew, Incident Period: October 04, 2016 to October 30, 2016, Major Disaster (Presidential) Declared DR-4286: October 11, 2016, FEMA Id: 4286, Natural disaster type: Hurricane
- South Carolina Severe Storms and Flooding, Incident Period: October 01, 2015 to October 23, 2015, Emergency Declared EM-3373: October 03, 2015, FEMA Id: 3373, Natural disaster type: Storm, Flood
- South Carolina Severe Storms and Flooding, Incident Period: October 01, 2015 to October 23, 2015, Major Disaster (Presidential) Declared DR-4241: October 05, 2015, FEMA Id: 4241, Natural disaster type: Storm, Flood
- South Carolina Severe Winter Storm, Incident Period: February 10, 2014 to February 19, 2014, Emergency Declared EM-3369: February 12, 2014, FEMA Id: 3369, Natural disaster type: Winter Storm
- South Carolina Severe Winter Storm, Incident Period: February 10, 2014 to February 15, 2014, Major Disaster (Presidential) Declared DR-4166: March 12, 2014, FEMA Id: 4166, Natural disaster type: Winter Storm
- South Carolina Hurricane Katrina Evacuation, Incident Period: August 29, 2005 to October 01, 2005, Emergency Declared EM-3233: September 10, 2005, FEMA Id: 3233, Natural disaster type: Hurricane
- 4 other natural disasters have been reported since 1953.
The number of natural disasters in Allendale County (14) is near the US average (15).
Major Disasters (Presidential) Declared: 5
Emergencies Declared: 6
Causes of natural disasters: Hurricanes: 7, Winter Storms: 3, Floods: 2, Storms: 2, Drought: 1, Other: 1 (Note: some incidents may be assigned to more than one category).
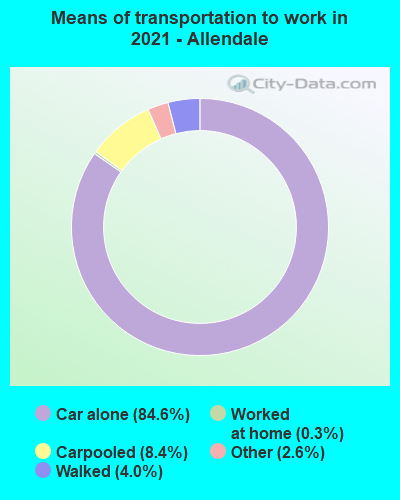
Means of transportation to work:
- Drove a car alone: 1,768 (80.4%)
- Carpooled: 247 (11.2%)
- Taxicab, motorcycle, or other means: 36 (1.6%)
- Bicycle: 1 (0.0%)
- Walked: 29 (1.3%)
- Worked at home: 65 (3.0%)

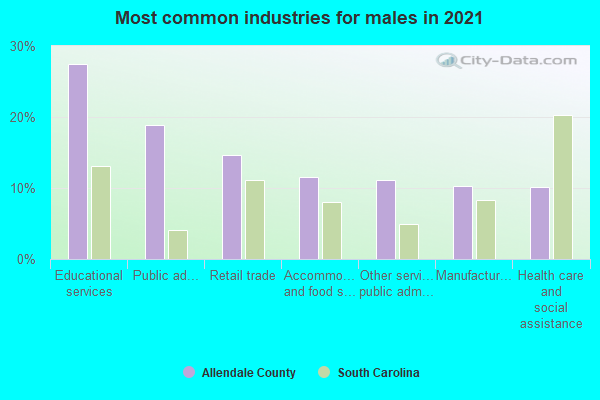
- Educational services (23%)
- Health care and social assistance (21%)
- Retail trade (18%)
- Manufacturing (11%)
- Accommodation and food services (11%)
- Public administration (9%)
- Other services, except public administration (7%)
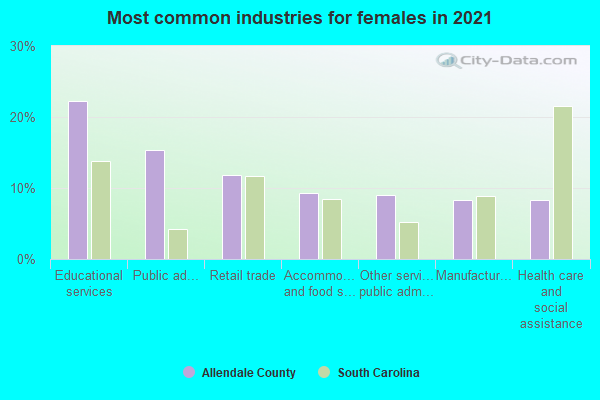
- Educational services (19%)
- Health care and social assistance (18%)
- Retail trade (16%)
- Manufacturing (10%)
- Accommodation and food services (10%)
- Public administration (8%)
- Other services, except public administration (6%)
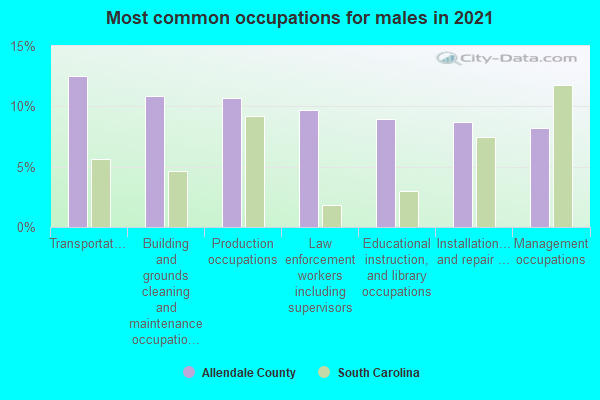
- Transportation occupations (18%)
- Educational instruction, and library occupations (12%)
- Material moving occupations (11%)
- Production occupations (10%)
- Installation, maintenance, and repair occupations (8%)
- Management occupations (7%)
- Farming, fishing, and forestry occupations (7%)
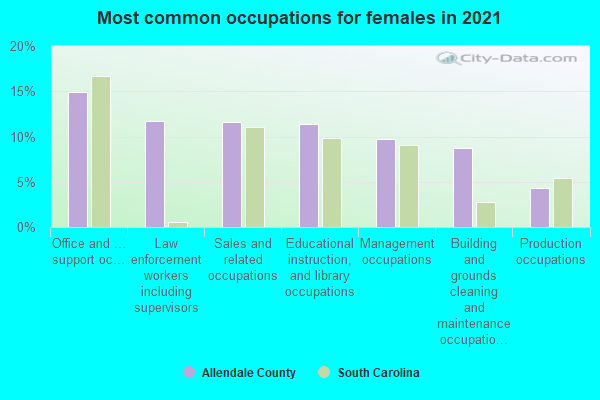
- Sales and related occupations (15%)
- Office and administrative support occupations (14%)
- Management occupations (14%)
- Educational instruction, and library occupations (11%)
- Law enforcement workers including supervisors (6%)
- Healthcare support occupations (5%)
- Building and grounds cleaning and maintenance occupations (5%)

- Mexico (40%)
- Thailand (14%)
- Germany (14%)
- Trinidad and Tobago (10%)
- Taiwan (8%)
- Jamaica (6%)
- Sweden (0%)

- American (13%)
- German (2%)
- French (except Basque) (1%)
- Celtic (1%)
- Irish (1%)
- Scotch-Irish (1%)
- Jamaican (1%)

People in group quarters in Allendale County, South Carolina in 2010:
- 1,236 people in state prisons
- 35 people in nursing facilities/skilled-nursing facilities
- 28 people in local jails and other municipal confinement facilities
- 22 people in emergency and transitional shelters (with sleeping facilities) for people experiencing homelessness
- 17 people in group homes intended for adults
- 4 people in residential treatment centers for adults
People in group quarters in Allendale County, South Carolina in 2000:
- 1,070 people in state prisons
- 59 people in nursing homes
- 19 people in local jails and other confinement facilities (including police lockups)
- 16 people in hospitals/wards and hospices for chronically ill
- 16 people in other hospitals or wards for chronically ill
- 13 people in other noninstitutional group quarters
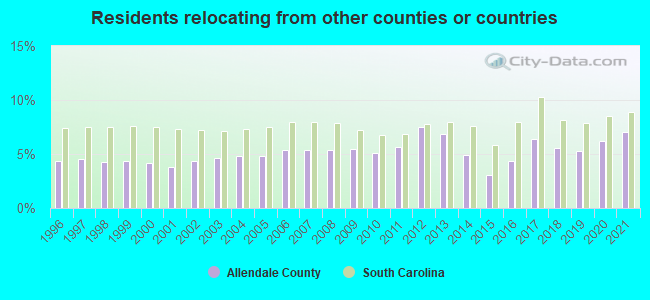
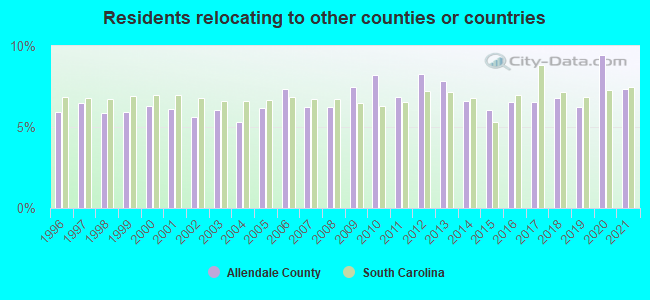
7.06% of this county's 2021 resident taxpayers lived in other counties in 2020 ($22,526 average adjusted gross income)
| Here: | 7.06% |
| South Carolina average: | 8.89% |
10 or fewer of this county's residents moved from foreign countries.
5.50% relocated from other counties in South Carolina ($17,132 average AGI)
1.56% relocated from other states ($5,395 average AGI)
Allendale County: 1.56% South Carolina average: 4.96%
Top counties from which taxpayers relocated into this county between 2020 and 2021:
| from Hampton County, SC | |
| from Barnwell County, SC |
7.36% of this county's 2020 resident taxpayers moved to other counties in 2021 ($25,231 average adjusted gross income)
| Here: | 7.36% |
| South Carolina average: | 7.46% |
10 or fewer of this county's residents moved to foreign countries.
5.18% relocated to other counties in South Carolina ($18,598 average AGI)
2.18% relocated to other states ($6,633 average AGI)
Allendale County: 2.18% South Carolina average: 3.47%
Top counties to which taxpayers relocated from this county between 2020 and 2021:
| to Barnwell County, SC | |
| to Hampton County, SC | |
| to Clark County, NV |
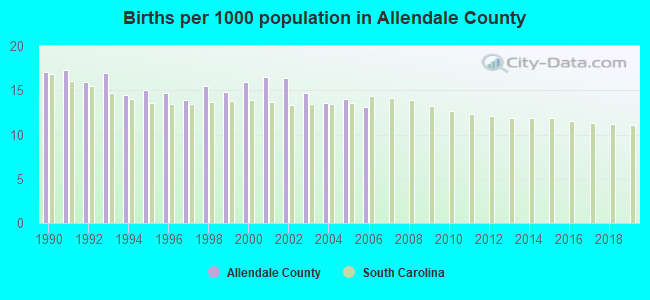
Births per 1000 population from 1990 to 1999: 15.6
Births per 1000 population from 2000 to 2006: 14.9
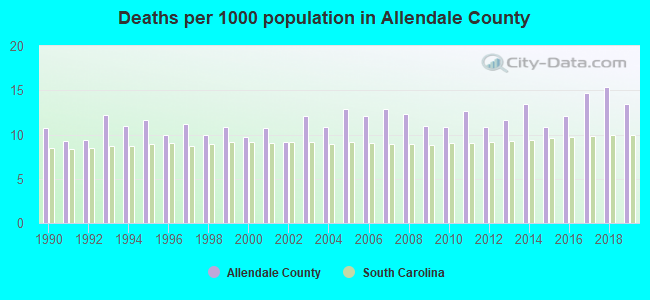
Deaths per 1000 population from 1990 to 1999: 10.6
Deaths per 1000 population from 2000 to 2009: 11.4
Deaths per 1000 population from 2010 to 2020: 13.0
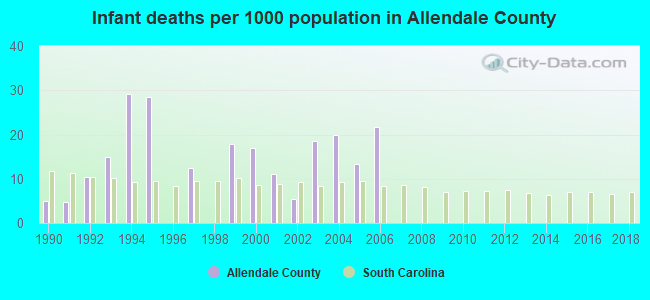
Infant deaths per 1000 live births from 1990 to 1999: 12.3
Infant deaths per 1000 live births from 2000 to 2006: 15.3
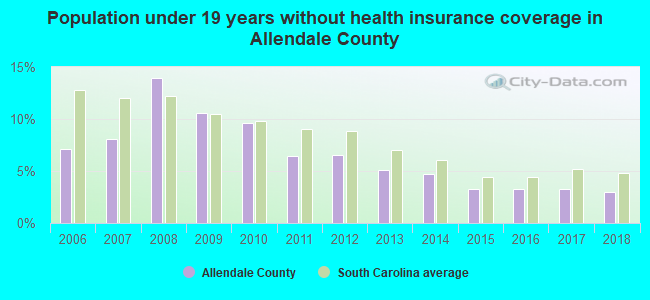
Persons under 19 years old without health insurance coverage in 2018: 3.0%
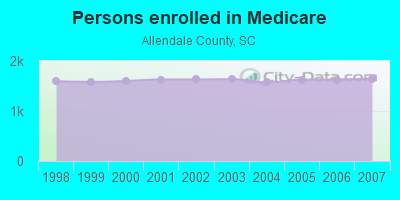
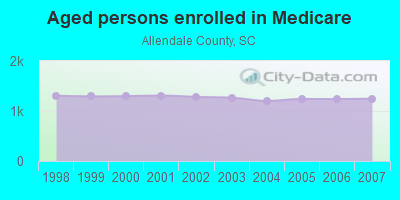
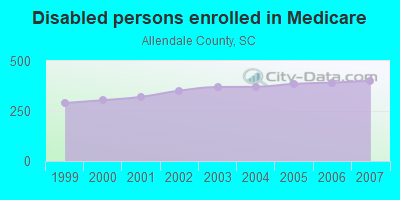
Persons enrolled in hospital insurance and/or supplemental medical insurance (Medicare) in July 1, 2007: 1,647 (1,246 aged, 401 disabled)
Children under 18 without health insurance coverage in 2007: 192 (7%)
Most common underlying causes of death in Allendale County, South Carolina in 1999 - 2019:
- Acute myocardial infarction, unspecified (89)
- Atherosclerotic heart disease (23)
- Alzheimer disease, unspecified (13)
- Bronchus or lung, unspecified - Malignant neoplasms (10)
- Cardiac arrest, unspecified (10)
- Chronic obstructive pulmonary disease, unspecified (10)
Population without health insurance coverage in 2000: 24%
Children under 18 without health insurance coverage in 2000: 21%
Short term general hospital admissions per 100,000 population in 2004: 5,090
Short term general hospital beds per 100,000 population in 2004: 624
Emergency room visits per 100,000 population in 2004: 77,696
General practice office based MDs per 100,000 population in 2005: 1,557
Medical specialist MDs per 100,000 population in 2005: 971
Dentists per 100,000 population in 1998: 18
Total births per 100,000 population, July 2005 - July 2006 : 35
Total deaths per 100,000 population, July 2005 - July 2006: 37
EPA green book nonattainment status in 2004-2006: 1
Crimes per 100,000 population in 1996: 1
Household type by relationship:
Households: 8,292- Male householders: 1,396 (575 living alone), Female householders: 2,008 (725 living alone)
1,036 spouses (1,036 opposite-sex spouses), 114 unmarried partners, (76 opposite-sex unmarried partners), 1,914 children (1,668 natural, 250 adopted, 0 stepchildren), 379 grandchildren, 165 brothers or sisters, 21 parents, 0 foster children, 158 other relatives, 120 non-relatives
- In group quarters: 960
Size of family households: 1,042 2-persons, 316 3-persons, 267 4-persons, 129 5-persons, 134 6-persons, 69 7-or-more-persons.
Size of nonfamily households: 1,300 1-person, 124 2-persons, 26 3-persons.
414 married couples with children.
632 single-parent households (18 men, 614 women).
97.2% of residents of Allendale speak English at home.
1.4% of residents speak Spanish at home (27% speak English very well, 53% speak English well, 20% speak English not well).
0.4% of residents speak other Indo-European language at home (100% speak English very well).
0.7% of residents speak Asian or Pacific Island language at home (100% speak English very well).
0.2% of residents speak other language at home (100% speak English very well).
In fiscal year 2004:
Federal Government expenditure: $87,955,000 ($7,952 per capita)
Department of Defense expenditure: $3,908,000
Federal direct payments to individuals for retirement and disability: $24,885,000
Federal other direct payments to individuals: $17,565,000
Federal direct payments not to individuals: $2,205,000
Federal grants: $38,954,000
Federal procurement contracts: $2,256,000 ($1,914,000 Department of Defense)
Federal salaries and wages: $2,091,000 ($834,000 Department of Defense)
Federal Government direct loans: $1,039,000
Federal guaranteed/insured loans: $205,000
Federal Government insurance: $5,318,000
Population change from April 1, 2000 to July 1, 2005:
Births: 936| Here: | 86 per 1000 residents |
| State: | 69 per 1000 residents |
Deaths: 633
| Here: | 58 per 1000 residents |
| State: | 46 per 1000 residents |
Net international migration: +43
| Here: | +4 per 1000 residents |
| State: | +9 per 1000 residents |
Net internal migration: -628
| Here: | |
| State: |
Total withdrawal of fresh water for public supply: 1.20 millions of gallons per day (all from ground)
| Here: | 5.9 |
| State: | 6.4 |
| Here: | 5.1 |
| State: | 4.5 |
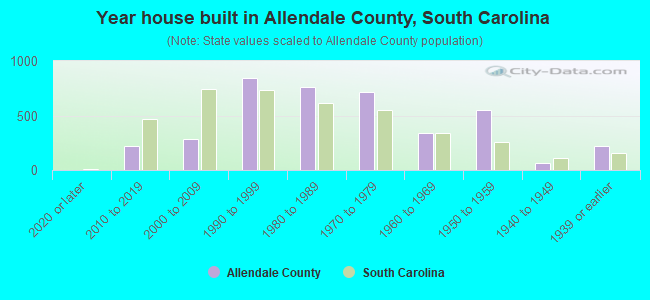
- Year house built in Allendale County, South Carolina
- 312020 or later
- 3542010 to 2019
- 2762000 to 2009
- 8991990 to 1999
- 6481980 to 1989
- 6221970 to 1979
- 3321960 to 1969
- 4901950 to 1959
- 1271940 to 1949
- 2091939 or earlier
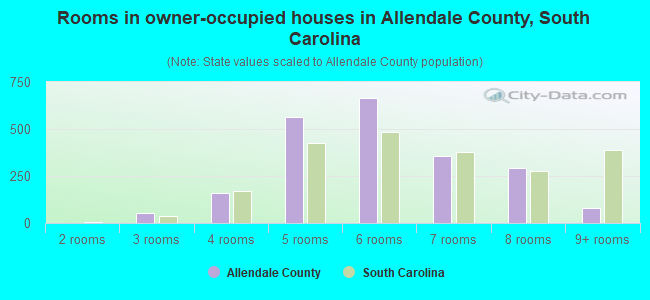
- Rooms in owner-occupied houses in Allendale County, South Carolina
- 01 room
- 02 rooms
- 523 rooms
- 1424 rooms
- 6405 rooms
- 7336 rooms
- 2947 rooms
- 2798 rooms
- 1509+ rooms
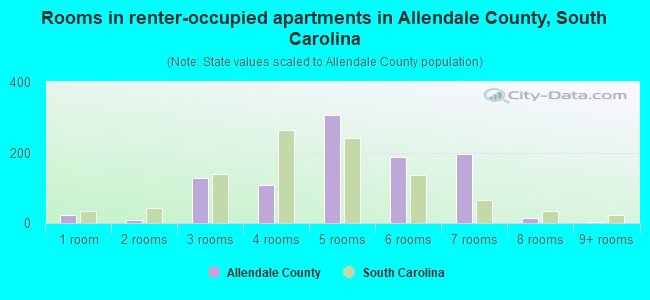
- Rooms in renter-occupied apartments in Allendale County, South Carolina
- 241 room
- 292 rooms
- 1493 rooms
- 1404 rooms
- 3435 rooms
- 2276 rooms
- 1317 rooms
- 68 rooms
- 19+ rooms
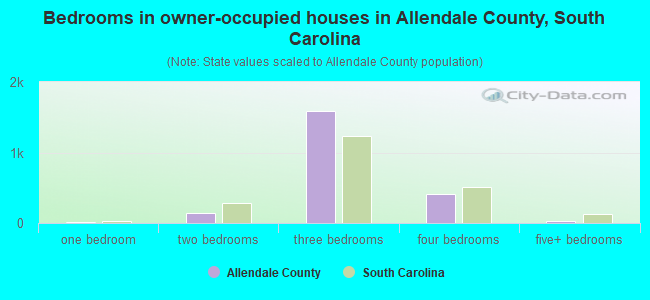
- Bedrooms in owner-occupied houses in Allendale County, South Carolina
- 0no bedroom
- 91 bedroom
- 1492 bedrooms
- 1,6073 bedrooms
- 4864 bedrooms
- 525+ bedrooms
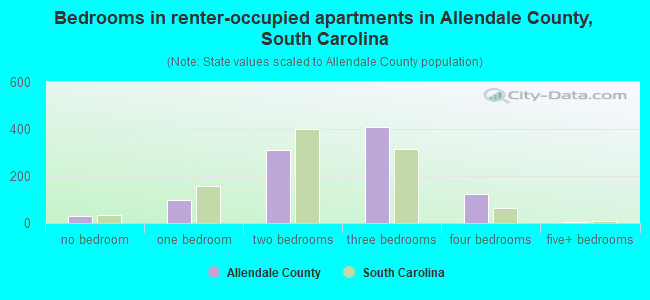
- Bedrooms in renter-occupied apartments in Allendale County, South Carolina
- 37no bedroom
- 1471 bedroom
- 3352 bedrooms
- 4363 bedrooms
- 1234 bedrooms
- 15+ bedrooms
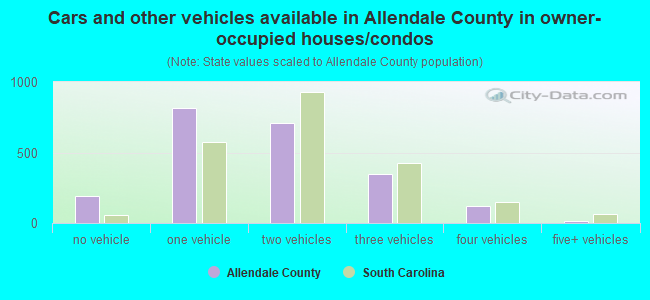
- Cars and other vehicles available in Allendale County in owner-occupied houses/condos
- 213no vehicle
- 7801 vehicle
- 7302 vehicles
- 3853 vehicles
- 1334 vehicles
- 625+ vehicles
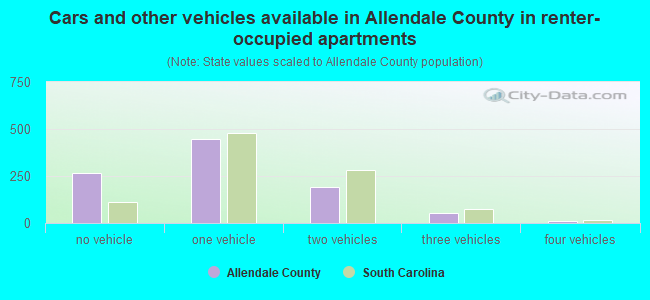
- Cars and other vehicles available in Allendale County in renter-occupied apartments
- 221no vehicle
- 5331 vehicle
- 2542 vehicles
- 653 vehicles
- 84 vehicles
- 05+ vehicles
91.6% of Allendale County residents lived in the same house 1 years ago.
Out of people who lived in different houses, 18% lived in this county.
Out of people who lived in different counties, 88% lived in South Carolina.
| Allendale County: | 91.6% |
| State average: | 86.5% |
Place of birth for U.S.-born residents:
- This state: 6,472
- Other state: 1,533
- Northeast: 247
- Midwest: 260
- South: 900
- West: 118
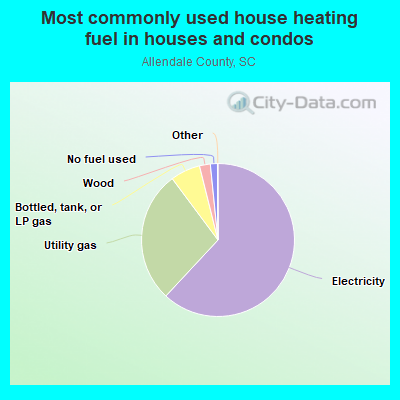
- 67.2%Electricity
- 24.1%Utility gas
- 4.6%Bottled, tank, or LP gas
- 3.0%Wood
- 1.2%No fuel used

- 67.9%Electricity
- 22.0%Utility gas
- 6.8%Bottled, tank, or LP gas
- 3.0%No fuel used
- 0.2%Wood
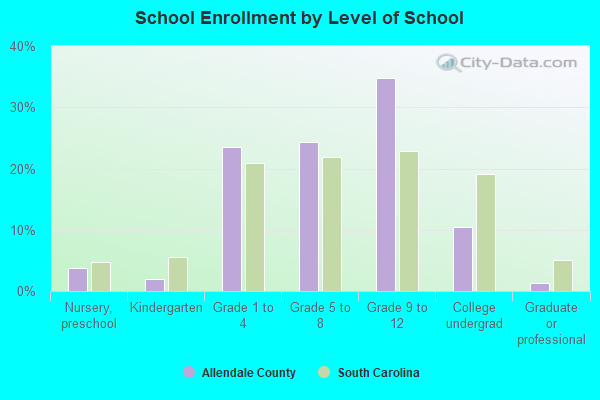
Private vs. public school enrollment:
| Here: | 10.6% |
| South Carolina: | 14.4% |
| Here: | 5.8% |
| South Carolina: | 11.1% |
| Here: | 49.4% |
| South Carolina: | 21.9% |

Allendale County government finances - Expenditure in 2018:
- Bond Funds - Cash and Securities: $14,899,000
- Charges - Air Transportation: $169,000
Other: $49,000
Solid Waste Management: $12,000
- Current Operations - General - Other: $1,957,000
Police Protection: $979,000
Correctional Institutions: $708,000
Financial Administration: $665,000
Judicial and Legal Services: $568,000
Regular Highways: $484,000
Health - Other: $395,000
Solid Waste Management: $327,000
Air Transportation: $212,000
Local Fire Protection: $120,000
Parks and Recreation: $114,000
Libraries: $100,000
General Public Buildings: $89,000
Central Staff Services: $40,000
Water Utilities: $25,000
- Federal Intergovernmental - Other: $107,000
- Long Term Debt - Outstanding Unspecified Public Purpose: $15,008,000
Beginning Outstanding - Unspecified Public Purpose: $15,008,000
Retired Nonguaranteed - Public Debt for Private Purpose: $2,000
Beginning Outstanding - Public Debt for Private Purpose: $2,000
- Miscellaneous - General Revenue - Other: $995,000
Fines and Forfeits: $64,000
Rents: $32,000
Interest Earnings: $1,000
- Other Funds - Cash and Securities: $2,610,000
- Revenue - Water Utilities: $212,000
- Sinking Funds - Cash and Securities: $2,000
- State Intergovernmental - General Local Government Support: $138,000
Housing and Community Development: $86,000
Other: $47,000
- Tax - Property: $4,491,000
General Sales and Gross Receipts: $420,000
Motor Vehicle License: $5,000
- Total Salaries and Wages: $3,145,000
Allendale County government finances - Revenue in 2018:
- Bond Funds - Cash and Securities: $14,899,000
- Charges - Air Transportation: $169,000
Other: $49,000
Solid Waste Management: $12,000
- Current Operations - General - Other: $1,957,000
Police Protection: $979,000
Correctional Institutions: $708,000
Financial Administration: $665,000
Judicial and Legal Services: $568,000
Regular Highways: $484,000
Health - Other: $395,000
Solid Waste Management: $327,000
Air Transportation: $212,000
Local Fire Protection: $120,000
Parks and Recreation: $114,000
Libraries: $100,000
General Public Buildings: $89,000
Central Staff Services: $40,000
Water Utilities: $25,000
- Federal Intergovernmental - Other: $107,000
- Long Term Debt - Outstanding Unspecified Public Purpose: $15,008,000
Beginning Outstanding - Unspecified Public Purpose: $15,008,000
Retired Nonguaranteed - Public Debt for Private Purpose: $2,000
Beginning Outstanding - Public Debt for Private Purpose: $2,000
- Miscellaneous - General Revenue - Other: $995,000
Fines and Forfeits: $64,000
Rents: $32,000
Interest Earnings: $1,000
- Other Funds - Cash and Securities: $2,610,000
- Revenue - Water Utilities: $212,000
- Sinking Funds - Cash and Securities: $2,000
- State Intergovernmental - General Local Government Support: $138,000
Housing and Community Development: $86,000
Other: $47,000
- Tax - Property: $4,491,000
General Sales and Gross Receipts: $420,000
Motor Vehicle License: $5,000
- Total Salaries and Wages: $3,145,000
Allendale County government finances - Debt in 2018:
- Bond Funds - Cash and Securities: $14,899,000
- Charges - Air Transportation: $169,000
Other: $49,000
Solid Waste Management: $12,000
- Current Operations - General - Other: $1,957,000
Police Protection: $979,000
Correctional Institutions: $708,000
Financial Administration: $665,000
Judicial and Legal Services: $568,000
Regular Highways: $484,000
Health - Other: $395,000
Solid Waste Management: $327,000
Air Transportation: $212,000
Local Fire Protection: $120,000
Parks and Recreation: $114,000
Libraries: $100,000
General Public Buildings: $89,000
Central Staff Services: $40,000
Water Utilities: $25,000
- Federal Intergovernmental - Other: $107,000
- Long Term Debt - Outstanding Unspecified Public Purpose: $15,008,000
Beginning Outstanding - Unspecified Public Purpose: $15,008,000
Retired Nonguaranteed - Public Debt for Private Purpose: $2,000
Beginning Outstanding - Public Debt for Private Purpose: $2,000
- Miscellaneous - General Revenue - Other: $995,000
Fines and Forfeits: $64,000
Rents: $32,000
Interest Earnings: $1,000
- Other Funds - Cash and Securities: $2,610,000
- Revenue - Water Utilities: $212,000
- Sinking Funds - Cash and Securities: $2,000
- State Intergovernmental - General Local Government Support: $138,000
Housing and Community Development: $86,000
Other: $47,000
- Tax - Property: $4,491,000
General Sales and Gross Receipts: $420,000
Motor Vehicle License: $5,000
- Total Salaries and Wages: $3,145,000
Allendale County government finances - Cash and Securities in 2018:
- Bond Funds - Cash and Securities: $14,899,000
- Charges - Air Transportation: $169,000
Other: $49,000
Solid Waste Management: $12,000
- Current Operations - General - Other: $1,957,000
Police Protection: $979,000
Correctional Institutions: $708,000
Financial Administration: $665,000
Judicial and Legal Services: $568,000
Regular Highways: $484,000
Health - Other: $395,000
Solid Waste Management: $327,000
Air Transportation: $212,000
Local Fire Protection: $120,000
Parks and Recreation: $114,000
Libraries: $100,000
General Public Buildings: $89,000
Central Staff Services: $40,000
Water Utilities: $25,000
- Federal Intergovernmental - Other: $107,000
- Long Term Debt - Outstanding Unspecified Public Purpose: $15,008,000
Beginning Outstanding - Unspecified Public Purpose: $15,008,000
Retired Nonguaranteed - Public Debt for Private Purpose: $2,000
Beginning Outstanding - Public Debt for Private Purpose: $2,000
- Miscellaneous - General Revenue - Other: $995,000
Fines and Forfeits: $64,000
Rents: $32,000
Interest Earnings: $1,000
- Other Funds - Cash and Securities: $2,610,000
- Revenue - Water Utilities: $212,000
- Sinking Funds - Cash and Securities: $2,000
- State Intergovernmental - General Local Government Support: $138,000
Housing and Community Development: $86,000
Other: $47,000
- Tax - Property: $4,491,000
General Sales and Gross Receipts: $420,000
Motor Vehicle License: $5,000
- Total Salaries and Wages: $3,145,000
Supplemental Security Income (SSI) in 2006:
- Total number of recipients: 732
- Number of aged recipients: 91
- Number of blind and disabled recipients: 641
- Number of recipients under 18: 126
- Number of recipients between 18 and 64: 400
- Number of recipients older than 64: 206
- Number of recipients also receiving OASDI: 287
- Amount of payments (thousands of dollars): 311
| Most common first names in Allendale County, SC among deceased individuals | ||
| Name | Count | Lived (average) |
|---|---|---|
| John | 83 | 71.5 years |
| James | 75 | 68.0 years |
| Willie | 73 | 67.7 years |
| William | 72 | 71.7 years |
| Mary | 65 | 72.0 years |
| Annie | 55 | 79.6 years |
| George | 45 | 73.4 years |
| Henry | 35 | 71.6 years |
| Joseph | 30 | 71.0 years |
| Robert | 30 | 64.4 years |
| Most common last names in Allendale County, SC among deceased individuals | ||
| Last name | Count | Lived (average) |
|---|---|---|
| Williams | 93 | 70.1 years |
| Smith | 51 | 69.5 years |
| Johnson | 47 | 70.1 years |
| Brown | 44 | 72.0 years |
| Priester | 43 | 73.0 years |
| Gray | 37 | 73.0 years |
| Thomas | 36 | 73.5 years |
| Sanders | 32 | 77.0 years |
| Green | 32 | 76.6 years |
| Youmans | 32 | 70.2 years |
| Businesses in Allendale County, SC | ||||
| Name | Count | Name | Count | |
|---|---|---|---|---|
| FedEx | 1 | Subway | 1 | |
| Hardee's | 1 | U-Haul | 2 | |
| Rite Aid | 1 | |||
Allendale County on our top lists:
- #34 on the list of "Top 101 counties with highest percentage of residents voting for Obama (Democrat) in the 2012 Presidential Election"