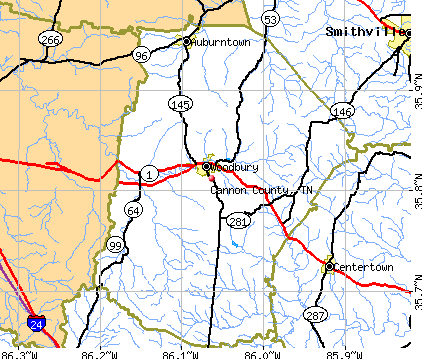
Cannon County, Tennessee (TN)
County owner-occupied free and clear houses and condos in 2010: 1,790
County owner-occupied houses and condos in 2000: 3,924
Renter-occupied apartments: 1,281 (it was 1,074 in 2000)
| % of renters here: | 21% |
| State: | 32% |
Land area: 266 sq. mi.
Water area: 0.1 sq. mi.
Population density: 56 people per square mile (average).
Industries providing employment: Educational, health and social services (20.6%), Manufacturing (18.2%), Retail trade (13.8%).
Type of workers:
- Private wage or salary: 75%
- Government: 17%
- Self-employed, not incorporated: 8%
- Unpaid family work: 0%
- OSM Map
- General Map
- Google Map
- MSN Map

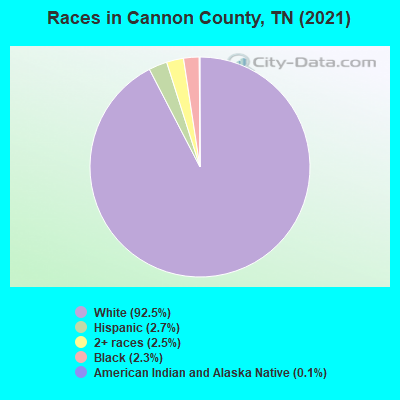
- 13,57492.3%White Non-Hispanic Alone
- 4252.9%Hispanic or Latino
- 3502.4%Black Non-Hispanic Alone
- 3362.3%Two or more races
- 140.10%American Indian and Alaska Native alone
- 20.01%Native Hawaiian and Other
Pacific Islander alone
| Median resident age: | 41.0 years |
| Tennessee median age: | 39.2 years |
| Males: 7,444 | |
| Females: 7,303 |

 | Wish You Were Here (24 replies) |
| Sell the fairgrounds? (117 replies) |
| Tennessee's 2020 Census results (70 replies) |
| COVID-19 in Tennessee (237 replies) |
| Innovative Development - Best Spot!? (2 replies) |
| Need to get out of the city (6 replies) |
| Cannon County: | 2.0 people |
| Tennessee: | 2 people |
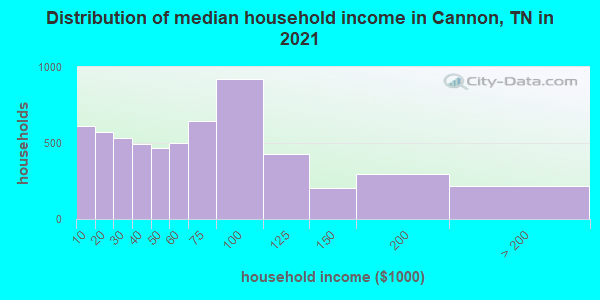
Estimated median household income in 2022: $58,748 ($32,809 in 1999)
| This county: | $58,748 |
| Tennessee: | $65,254 |
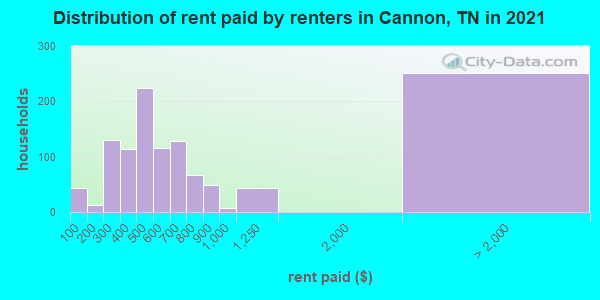
Median contract rent in 2022 for apartments: $537 (lower quartile is $367, upper quartile is $776)
| This county: | $537 |
| State: | $884 |
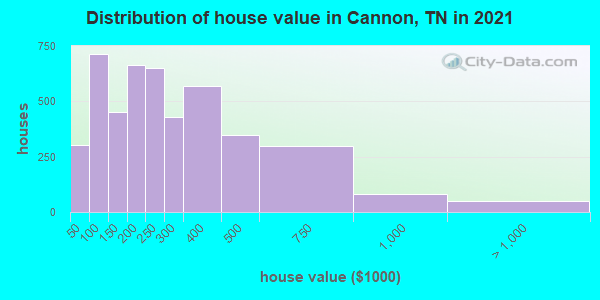
Estimated median house or condo value in 2022: $267,130 (it was $80,500 in 2000)
| Cannon: | $267,130 |
| Tennessee: | $284,800 |
Mean price in 2022:
Median monthly housing costs for homes and condos with a mortgage: $1,316Detached houses: $308,916
Here: $308,916 State: $374,382 Townhouses or other attached units: $3,530,028
Here: $3,530,028 State: $354,101 Mobile homes: $90,695
Here: $90,695 State: $101,421
Median monthly housing costs for units without a mortgage: $391
Institutionalized population: 148
Crime in 2021 (reported by the sheriff's office or county police, not the county total):
- Murders: 0
- Rapes: 0
- Robberies: 0
- Assaults: 4
- Burglaries: 8
- Thefts: 9
- Auto thefts: 6
Crime in 2020 (reported by the sheriff's office or county police, not the county total):
- Murders: 0
- Rapes: 0
- Robberies: 0
- Assaults: 9
- Burglaries: 20
- Thefts: 18
- Auto thefts: 11
Health of residents in Cannon County based on CDC Behavioral Risk Factor Surveillance System Survey Questionnaires from 2013 to 2021:
General health status score of residents in this county from 1 (poor) to 5 (excellent) is 3.5. This is about average.69.9% of residents exercised in the past month. This is less than average.
42.1% of residents smoked 100+ cigarettes in their lives. This is about average.
48.0% of adult residents drank alcohol in the past 30 days. This is less than average.
65.5% of residents visited a dentist within the past year. This is less than average.
Average weight of males is 202 pounds. This is more than average.
Average weight of females is 168 pounds. This is more than average.
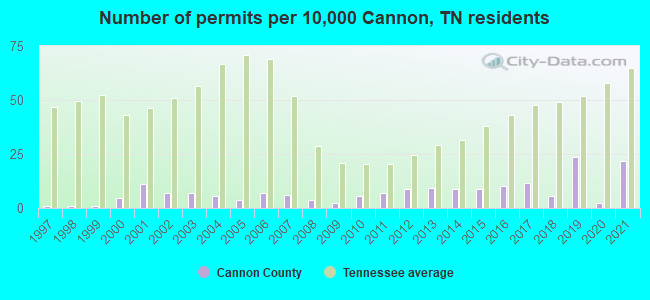
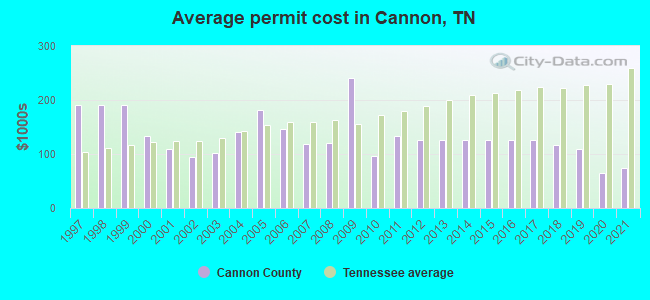
Single-family new house construction building permits:
- 2022: 25 buildings, average cost: $172,900
- 2021: 28 buildings, average cost: $74,800
- 2020: 3 buildings, average cost: $64,900
- 2019: 30 buildings, average cost: $110,100
- 2018: 7 buildings, average cost: $116,100
- 2017: 15 buildings, average cost: $126,200
- 2016: 13 buildings, average cost: $126,200
- 2015: 11 buildings, average cost: $126,200
- 2014: 11 buildings, average cost: $126,200
- 2013: 12 buildings, average cost: $126,200
- 2012: 11 buildings, average cost: $126,300
- 2011: 9 buildings, average cost: $132,900
- 2010: 7 buildings, average cost: $96,800
- 2009: 3 buildings, average cost: $239,600
- 2008: 5 buildings, average cost: $121,300
- 2007: 8 buildings, average cost: $119,100
- 2006: 9 buildings, average cost: $146,200
- 2005: 5 buildings, average cost: $180,900
- 2004: 7 buildings, average cost: $140,000
- 2003: 9 buildings, average cost: $100,900
- 2002: 9 buildings, average cost: $95,400
- 2001: 14 buildings, average cost: $109,100
- 2000: 6 buildings, average cost: $133,300
- 1999: 1 building, cost: $190,000
- 1998: 1 building, cost: $190,000
- 1997: 1 building, cost: $190,000
Median real estate property taxes paid for housing units with mortgages in 2022: $1,184 (0.4%)
Median real estate property taxes paid for housing units with no mortgage in 2022: $1,093 (0.6%)
| Cannon County: | 14.4% |
| Tennessee: | 13.3% |
Median age of residents in 2022: 41.0 years old
(Males: 38.3 years old, Females: 42.9 years old)
(Median age for: White residents: 42.3 years old, Black residents: 35.3 years old, American Indian residents: 58.6 years old, Hispanic or Latino residents: 21.9 years old, Other race residents: 22.2 years old)
Area name: Nashville-Davidson--Murfreesboro, TN HUD Metro FMR Area
Fair market rent in 2006 for a 1-bedroom apartment in Cannon County is $579 a month.
Fair market rent for a 2-bedroom apartment is $666 a month.
Fair market rent for a 3-bedroom apartment is $864 a month.
Cities in this county include: South Cannon, North Cannon, Plateau of the Barrens, Woodbury, Auburntown.
Neighboring counties: McKinley County, New Mexico  , Gibson County , Muskogee County, Oklahoma , Woods County, Oklahoma .
| Here: | 2.7% |
| Tennessee: | 3.0% |
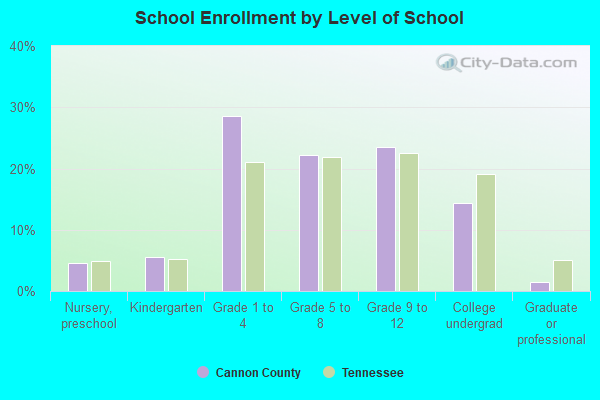
Current college students: 323
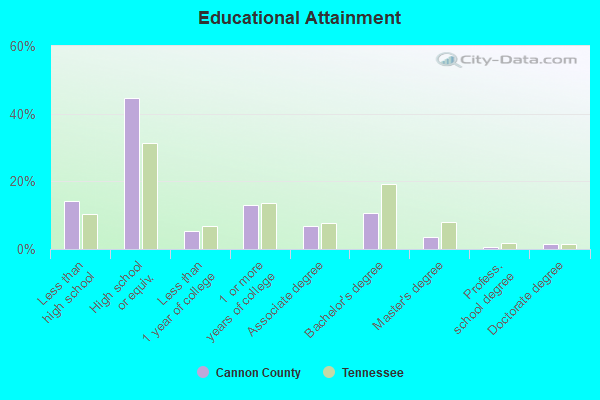
People 25 years of age or older with a high school degree or higher: 85.6%
People 25 years of age or older with a bachelor's degree or higher: 17.5%
Number of foreign born residents: 231 (15.2% naturalized citizens)
| Cannon County: | 1.6% |
| Whole state: | 5.6% |
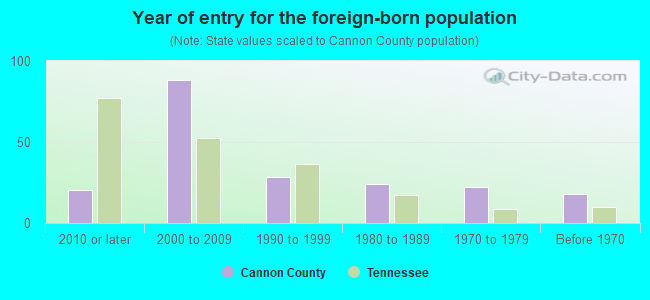
- Year of entry for the foreign-born population
- 392010 or later
- 982000 to 2009
- 611990 to 1999
- 241980 to 1989
- 221970 to 1979
- 18Before 1970
Mean travel time to work (commute): ! minutes
Percentage of county residents living and working in this county: 100.1%


Housing units in structures:
- One, detached: 5,141
- One, attached: 39
- Two: 28
- 3 or 4: 63
- 5 to 9: 121
- 20 to 49: 24
- 50 or more: 10
- Mobile homes: 1,052
Housing units in Cannon County with a mortgage: 2,016 (36 second mortgage, 0 home equity loan, 34 both second mortgage and home equity loan)
Houses without a mortgage: 22
| Here: | 8.3% with mortgage |
| State: | 97.8% with mortgage |
Religion statistics for Cannon County
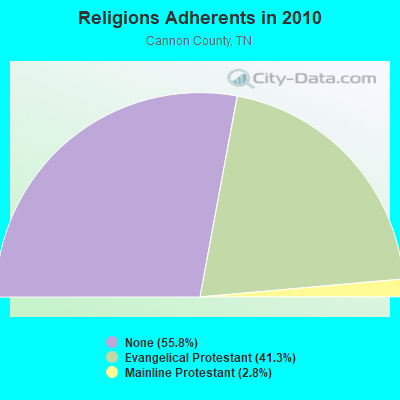
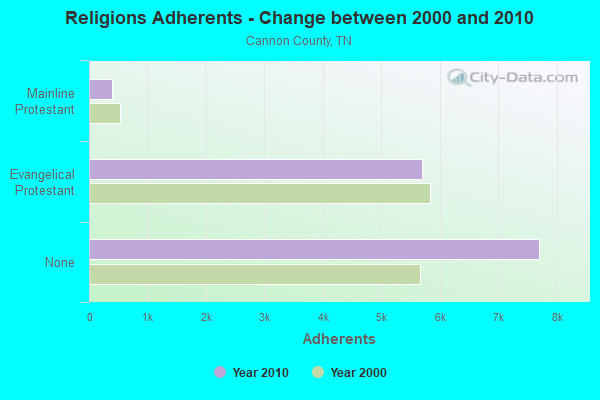
| Religion | Adherents | Congregations |
|---|---|---|
| Evangelical Protestant | 5,705 | 42 |
| Mainline Protestant | 389 | 5 |
| Catholic | - | - |
| Other | - | 1 |
| None | 7,707 | - |
Source: Clifford Grammich, Kirk Hadaway, Richard Houseal, Dale E.Jones, Alexei Krindatch, Richie Stanley and Richard H.Taylor. 2012. 2010 U.S.Religion Census: Religious Congregations & Membership Study. Association of Statisticians of American Religious Bodies. Jones, Dale E., et al. 2002. Congregations and Membership in the United States 2000. Nashville, TN: Glenmary Research Center.
Food Environment Statistics:
| Cannon County: | 2.23 / 10,000 pop. |
| State: | 1.99 / 10,000 pop. |
| This county: | 0.74 / 10,000 pop. |
| Tennessee: | 0.65 / 10,000 pop. |
| Cannon County: | 5.21 / 10,000 pop. |
| Tennessee: | 5.16 / 10,000 pop. |
| This county: | 3.72 / 10,000 pop. |
| State: | 6.56 / 10,000 pop. |
| Cannon County: | 10.9% |
| Tennessee: | 11.4% |
| Cannon County: | 28.1% |
| State: | 30.2% |
| Here: | 13.0% |
| State: | 13.5% |
Agriculture in Cannon County:
Average size of farms: 125 acresAverage value of agricultural products sold per farm: $14,348
Average value of crops sold per acre for harvested cropland: $191.17
The value of nursery, greenhouse, floriculture, and sod as a percentage of the total market value of agricultural products sold: 10.79%
The value of livestock, poultry, and their products as a percentage of the total market value of agricultural products sold: 57.99%
Average total farm production expenses per farm: $18,328
Harvested cropland as a percentage of land in farms: 25.20%
Irrigated harvested cropland as a percentage of land in farms: 0.24%
Average market value of all machinery and equipment per farm: $34,176
The percentage of farms operated by a family or individual: 96.10%
Average age of principal farm operators: 54 years
Average number of cattle and calves per 100 acres of all land in farms: 18.93
Milk cows as a percentage of all cattle and calves: 3.44%
Corn for grain: 5260 harvested acres
All wheat for grain: 886 harvested acres
Soybeans for beans: 9410 harvested acres
Vegetables: 70 harvested acres
Land in orchards: 8 acres
Earthquake activity:
Cannon County-area historical earthquake activity is significantly above Tennessee state average. It is 159% greater than the overall U.S. average.On 4/29/2003 at 08:59:39, a magnitude 4.9 (4.4 MB, 4.6 MW, 4.9 LG, Class: Light, Intensity: IV - V) earthquake occurred 94.4 miles away from Cannon County center
On 4/18/2008 at 09:36:59, a magnitude 5.4 (5.1 MB, 4.8 MS, 5.4 MW, 5.2 MW, Class: Moderate, Intensity: VI - VII) earthquake occurred 208.4 miles away from the county center
On 7/27/1980 at 18:52:21, a magnitude 5.2 (5.1 MB, 4.7 MS, 5.0 UK, 5.2 UK) earthquake occurred 202.8 miles away from the county center
On 4/18/2008 at 09:36:59, a magnitude 5.2 (5.2 MW, Depth: 8.9 mi) earthquake occurred 208.4 miles away from the county center
On 4/29/2003 at 08:59:39, a magnitude 4.6 (4.6 MW, Depth: 12.3 mi) earthquake occurred 94.4 miles away from Cannon County center
On 6/18/2002 at 17:37:15, a magnitude 5.0 (4.3 MB, 4.6 MW, 5.0 LG) earthquake occurred 177.9 miles away from the county center
Magnitude types: regional Lg-wave magnitude (LG), body-wave magnitude (MB), surface-wave magnitude (MS), moment magnitude (MW)
Most recent natural disasters:
- Tennessee Covid-19 Pandemic, Incident Period: January 20, 2020, FEMA Id: 4514, Natural disaster type: Other
- Tennessee Severe Storms, Flooding, Straight-Line Winds, and Tornadoes, Incident Period: April 30, 2010 to May 18, 2010, Major Disaster (Presidential) Declared DR-1909: May 04, 2010, FEMA Id: 1909, Natural disaster type: Storm, Tornado, Flood, Wind
- Tennessee Severe Storms and Tornadoes, Incident Period: April 02, 2006 to April 08, 2006, Major Disaster (Presidential) Declared DR-1634: April 05, 2006, FEMA Id: 1634, Natural disaster type: Storm, Tornado
- Tennessee Hurricane Katrina Evacuation, Incident Period: August 29, 2005 to October 01, 2005, Emergency Declared EM-3217: September 05, 2005, FEMA Id: 3217, Natural disaster type: Hurricane
- Tennessee Severe Storms, Tornadoes and Flooding, Incident Period: May 04, 2003 to May 30, 2003, Major Disaster (Presidential) Declared DR-1464: May 08, 2003, FEMA Id: 1464, Natural disaster type: Storm, Tornado, Flood
- Tennessee Severe Storms and Flooding, Incident Period: February 14, 2003 to February 26, 2003, Major Disaster (Presidential) Declared DR-1456: March 20, 2003, FEMA Id: 1456, Natural disaster type: Storm, Flood
- Tennessee Storms and Flooding, Incident Period: January 23, 2002 to March 20, 2002, Major Disaster (Presidential) Declared DR-1408: April 05, 2002, FEMA Id: 1408, Natural disaster type: Storm, Flood
- Tennessee Winter Storm, Incident Period: December 23, 1998 to December 29, 1998, Major Disaster (Presidential) Declared DR-1260: January 15, 1999, FEMA Id: 1260, Natural disaster type: Winter Storm
- Tennessee Severe Storms and Flooding, Incident Period: January 06, 1998 to February 12, 1998, Major Disaster (Presidential) Declared DR-1197: January 13, 1998, FEMA Id: 1197, Natural disaster type: Storm, Flood
- Tennessee Ice Storm, Severe Winter Storm, Flash Flooding, Incident Period: February 09, 1994 to February 11, 1994, Major Disaster (Presidential) Declared DR-1010: February 28, 1994, FEMA Id: 1010, Natural disaster type: Ice Storm, Winter Storm, Flash Flood
- 4 other natural disasters have been reported since 1953.
The number of natural disasters in Cannon County (14) is near the US average (15).
Major Disasters (Presidential) Declared: 11
Emergencies Declared: 2
Causes of natural disasters: Floods: 7, Storms: 7, Tornadoes: 4, Winter Storms: 3, Flash Flood: 1, Heavy Rain: 1, Hurricane: 1, Ice Storm: 1, Snowfall: 1, Wind: 1, Other: 1 (Note: some incidents may be assigned to more than one category).
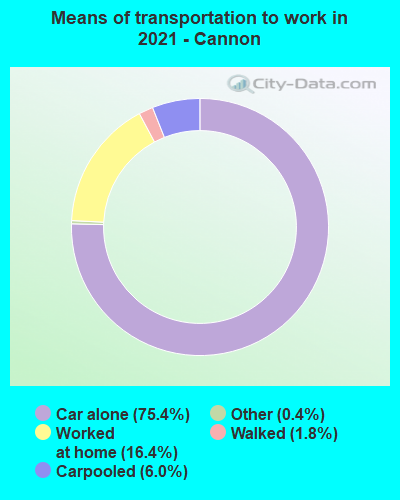
Means of transportation to work:
- Drove a car alone: 2,032 (74.2%)
- Carpooled: 176 (6.4%)
- Bus: 13 (0.5%)
- Taxicab, motorcycle, or other means: 6 (0.2%)
- Walked: 30 (1.1%)
- Worked at home: 518 (18.9%)
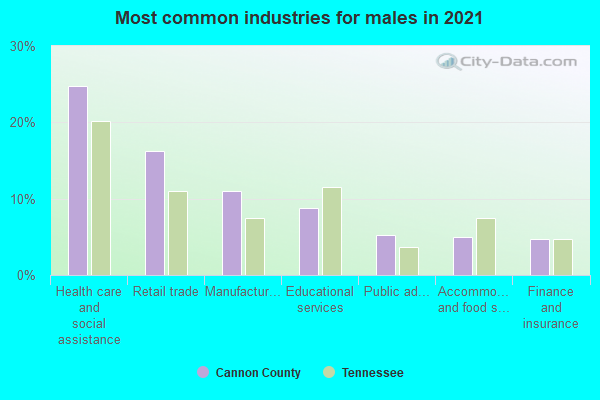
- Health care and social assistance (23%)
- Retail trade (15%)
- Educational services (11%)
- Manufacturing (8%)
- Public administration (6%)
- Accommodation and food services (6%)
- Finance and insurance (5%)
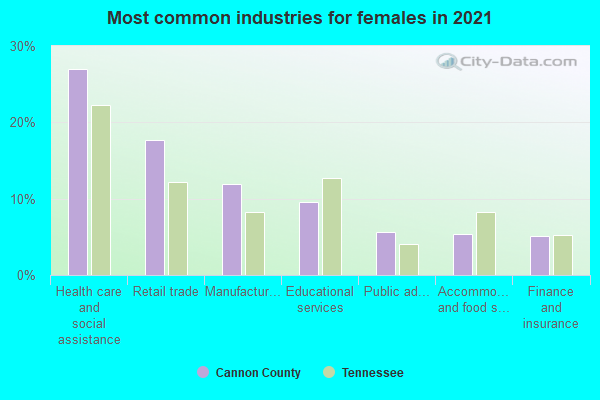
- Health care and social assistance (26%)
- Retail trade (17%)
- Educational services (12%)
- Manufacturing (8%)
- Public administration (7%)
- Accommodation and food services (7%)
- Finance and insurance (6%)
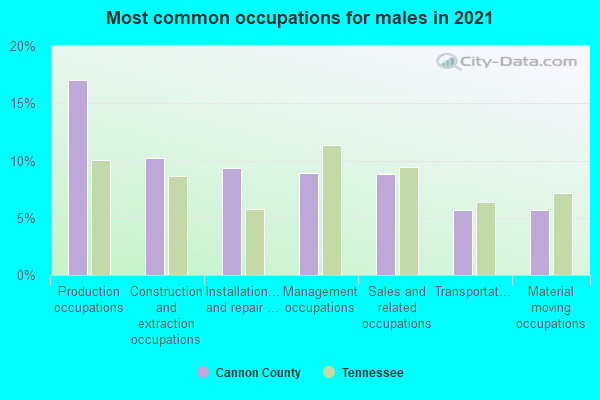
- Production occupations (18%)
- Installation, maintenance, and repair occupations (11%)
- Construction and extraction occupations (9%)
- Sales and related occupations (7%)
- Material moving occupations (7%)
- Transportation occupations (6%)
- Management occupations (6%)
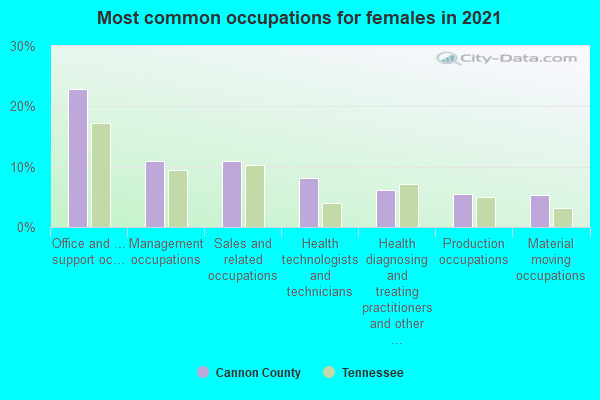
- Office and administrative support occupations (19%)
- Management occupations (10%)
- Sales and related occupations (10%)
- Educational instruction, and library occupations (9%)
- Health diagnosing and treating practitioners and other technical occupations (7%)
- Health technologists and technicians (7%)
- Food preparation and serving related occupations (7%)
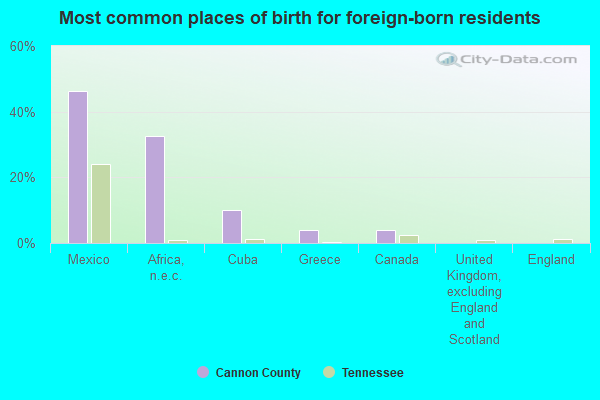
- Mexico (51%)
- Africa, n.e.c. (10%)
- Kuwait (7%)
- England (5%)
- Greece (4%)
- Canada (3%)
- Cuba (1%)
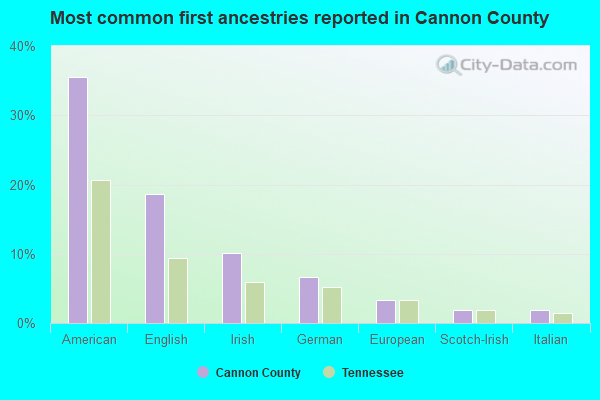
- American (40%)
- English (18%)
- Irish (9%)
- German (5%)
- European (4%)
- Scotch-Irish (2%)
- Italian (1%)
People in group quarters in Cannon County, Tennessee in 2010:
- 91 people in nursing facilities/skilled-nursing facilities
- 56 people in local jails and other municipal confinement facilities
- 16 people in group homes intended for adults
People in group quarters in Cannon County, Tennessee in 2000:
- 101 people in nursing homes
- 53 people in local jails and other confinement facilities (including police lockups)
- 11 people in other noninstitutional group quarters
9.34% of this county's 2021 resident taxpayers lived in other counties in 2020 ($50,183 average adjusted gross income)
| Here: | 9.34% |
| Tennessee average: | 8.49% |
10 or fewer of this county's residents moved from foreign countries.
7.61% relocated from other counties in Tennessee ($39,446 average AGI)
1.73% relocated from other states ($10,737 average AGI)
Cannon County: 1.73% Tennessee average: 4.34%
Top counties from which taxpayers relocated into this county between 2020 and 2021:
| from Rutherford County, TN | |
| from Davidson County, TN | |
| from Warren County, TN | |
| from Coffee County, TN | |
| from DeKalb County, TN |
7.43% of this county's 2020 resident taxpayers moved to other counties in 2021 ($38,305 average adjusted gross income)
| Here: | 7.43% |
| Tennessee average: | 7.40% |
10 or fewer of this county's residents moved to foreign countries.
6.74% relocated to other counties in Tennessee ($34,325 average AGI)
0.69% relocated to other states ($3,980 average AGI)
Cannon County: 0.69% Tennessee average: 3.20%
Top counties to which taxpayers relocated from this county between 2020 and 2021:
| to Rutherford County, TN | |
| to Warren County, TN | |
| to Coffee County, TN | |
| to DeKalb County, TN |
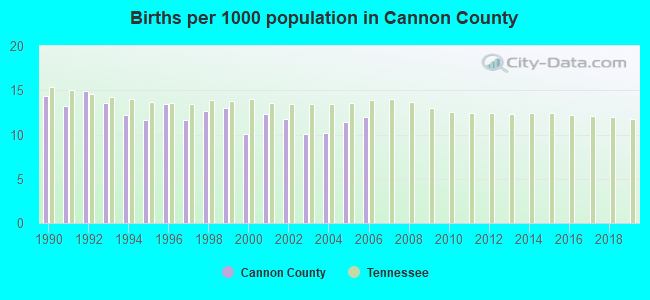
Births per 1000 population from 1990 to 1999: 13.1
Births per 1000 population from 2000 to 2006: 11.1
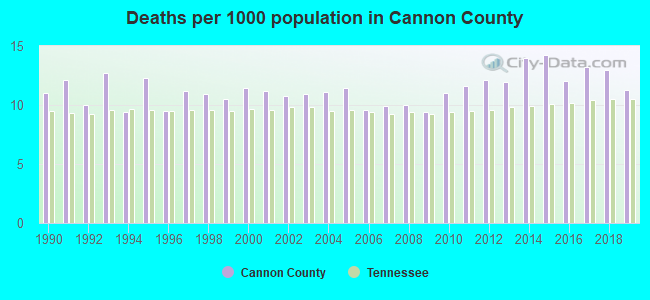
Deaths per 1000 population from 1990 to 1999: 11.0
Deaths per 1000 population from 2000 to 2009: 10.6
Deaths per 1000 population from 2010 to 2020: 12.6
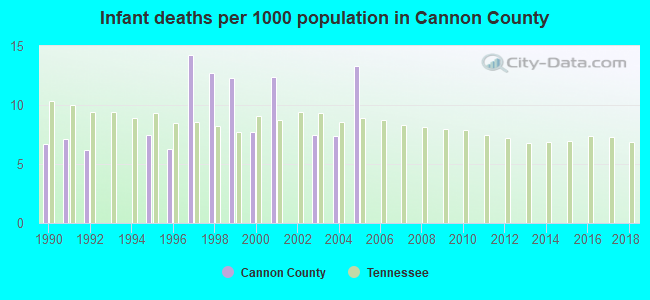
Infant deaths per 1000 live births from 1990 to 1999: 7.3
Infant deaths per 1000 live births from 2000 to 2006: 6.9
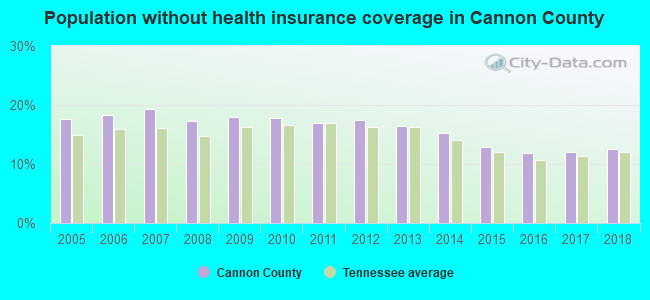
Persons under 19 years old without health insurance coverage in 2018: 5.6%
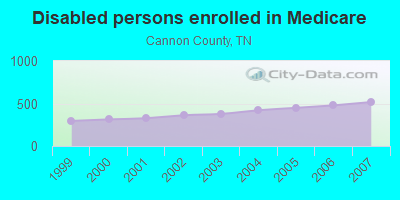
Persons enrolled in hospital insurance and/or supplemental medical insurance (Medicare) in July 1, 2007: 2,431 (1,914 aged, 517 disabled)
Children under 18 without health insurance coverage in 2007: 333 (10%)
Most common underlying causes of death in Cannon County, Tennessee in 1999 - 2019:
- Acute myocardial infarction, unspecified (307)
- Atherosclerotic heart disease (120)
- Bronchus or lung, unspecified - Malignant neoplasms (104)
- Chronic obstructive pulmonary disease, unspecified (34)
- Stroke, not specified as haemorrhage or infarction (34)
- Alzheimer disease, unspecified (12)
- Pneumonitis due to food and vomit (11)
- Unspecified dementia (10)
Population without health insurance coverage in 2000: 14%
Children under 18 without health insurance coverage in 2000: 9%
Short term general hospital admissions per 100,000 population in 2004: 10,406
Short term general hospital beds per 100,000 population in 2004: 412
Emergency room visits per 100,000 population in 2004: 43,946
General practice office based MDs per 100,000 population in 2005: 915
Medical specialist MDs per 100,000 population in 2005: 1,147
Total births per 100,000 population, July 2005 - July 2006 : 16
Total deaths per 100,000 population, July 2005 - July 2006: 52
Limited-service eating places per 100,000 population in 2005 : 8
Crimes per 100,000 population in 1996: 1
Household type by relationship:
Households: 14,747- Male householders: 3,029 (955 living alone), Female householders: 3,020 (949 living alone)
2,909 spouses (2,899 opposite-sex spouses), 311 unmarried partners, (311 opposite-sex unmarried partners), 3,879 children (3,695 natural, 121 adopted, 69 stepchildren), 568 grandchildren, 117 brothers or sisters, 138 parents, 19 foster children, 250 other relatives, 349 non-relatives
- In group quarters: 146
Size of family households: 1,935 2-persons, 896 3-persons, 606 4-persons, 323 5-persons, 87 6-persons, 15 7-or-more-persons.
Size of nonfamily households: 1,901 1-person, 229 2-persons, 7 3-persons, 37 5-persons.
1,934 married couples with children.
743 single-parent households (266 men, 477 women).
96.7% of residents of Cannon speak English at home.
1.7% of residents speak Spanish at home (58% speak English very well, 22% speak English well, 16% speak English not well, 5% don't speak English at all).
1.2% of residents speak other Indo-European language at home (31% speak English very well, 69% speak English well, 1% speak English not well).
0.1% of residents speak other language at home (100% speak English very well).
In fiscal year 2004:
Federal Government expenditure: $75,951,000 ($5,694 per capita)
Department of Defense expenditure: $3,639,000
Federal direct payments to individuals for retirement and disability: $33,576,000
Federal other direct payments to individuals: $22,380,000
Federal direct payments not to individuals: $406,000
Federal grants: $15,583,000
Federal procurement contracts: $2,259,000 ($1,812,000 Department of Defense)
Federal salaries and wages: $1,748,000 ($0,000 Department of Defense)
Federal Government direct loans: $117,000
Federal guaranteed/insured loans: $4,649,000
Federal Government insurance: $6,608,000
Population change from April 1, 2000 to July 1, 2005:
Births: 734| Here: | 55 per 1000 residents |
| State: | 69 per 1000 residents |
Deaths: 738
| Here: | 55 per 1000 residents |
| State: | 50 per 1000 residents |
Net international migration: +37
| Here: | +3 per 1000 residents |
| State: | +8 per 1000 residents |
Net internal migration: +496
| Here: | +37 per 1000 residents |
| State: | +18 per 1000 residents |
Total withdrawal of fresh water for public supply: 0.70 millions of gallons per day (all from surface)
| Here: | 6.4 |
| State: | 6.5 |
| Here: | 4.9 |
| State: | 4.4 |
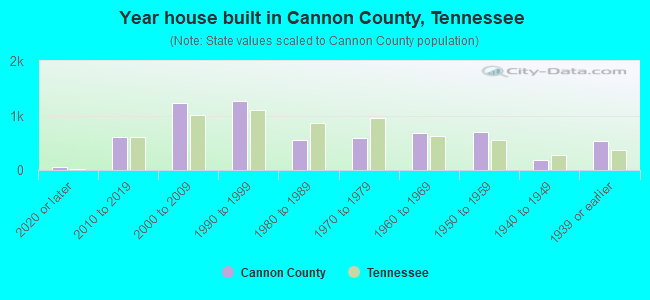
- Year house built in Cannon County, Tennessee
- 792020 or later
- 5622010 to 2019
- 1,2702000 to 2009
- 1,2371990 to 1999
- 6091980 to 1989
- 5291970 to 1979
- 6591960 to 1969
- 6631950 to 1959
- 2291940 to 1949
- 4971939 or earlier
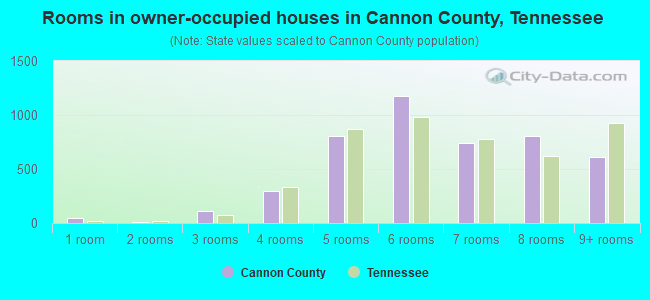
- Rooms in owner-occupied houses in Cannon County, Tennessee
- 311 room
- 72 rooms
- 1893 rooms
- 3104 rooms
- 7745 rooms
- 1,0656 rooms
- 7217 rooms
- 8658 rooms
- 6929+ rooms
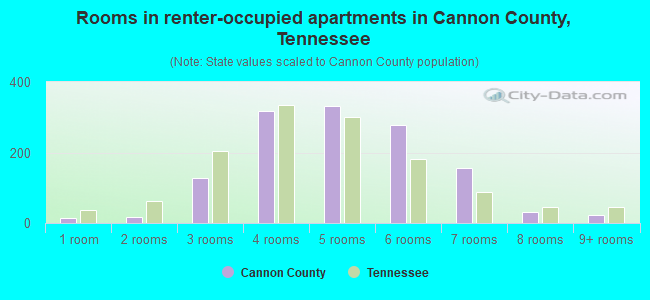
- Rooms in renter-occupied apartments in Cannon County, Tennessee
- 161 room
- 372 rooms
- 1693 rooms
- 3644 rooms
- 2705 rooms
- 2726 rooms
- 1767 rooms
- 878 rooms
- 189+ rooms
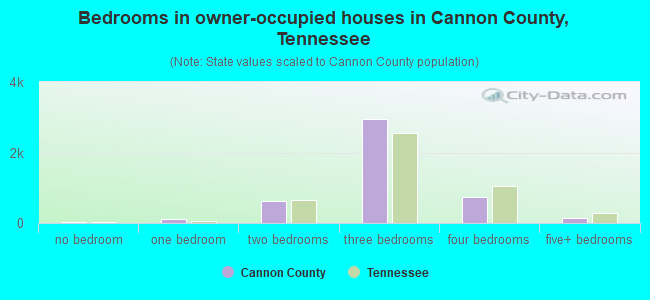
- Bedrooms in owner-occupied houses in Cannon County, Tennessee
- 37no bedroom
- 1311 bedroom
- 6952 bedrooms
- 2,9243 bedrooms
- 7034 bedrooms
- 1425+ bedrooms
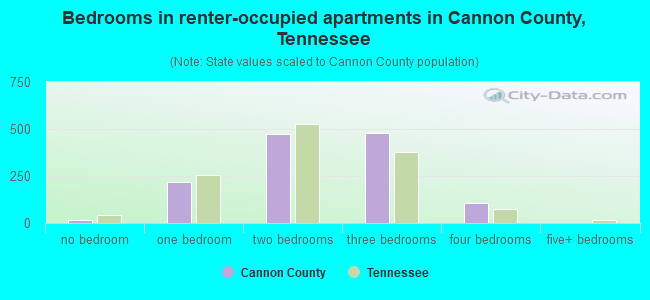
- Bedrooms in renter-occupied apartments in Cannon County, Tennessee
- 20no bedroom
- 2711 bedroom
- 5032 bedrooms
- 5183 bedrooms
- 924 bedrooms
- 05+ bedrooms
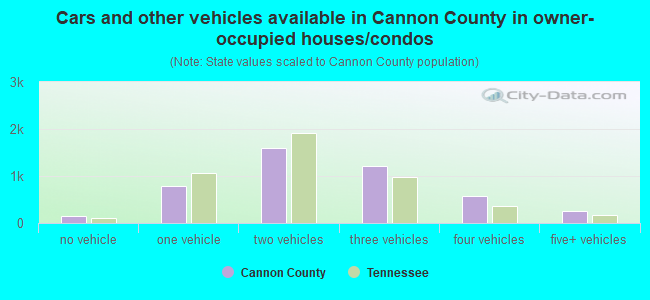
- Cars and other vehicles available in Cannon County in owner-occupied houses/condos
- 153no vehicle
- 8371 vehicle
- 1,5862 vehicles
- 1,1653 vehicles
- 5734 vehicles
- 3155+ vehicles
- Cars and other vehicles available in Cannon County in renter-occupied apartments
- 134no vehicle
- 5241 vehicle
- 3352 vehicles
- 2733 vehicles
- 1274 vehicles
- 415+ vehicles
89.5% of Cannon County residents lived in the same house 1 years ago.
Out of people who lived in different houses, 24% lived in this county.
Out of people who lived in different counties, 88% lived in Tennessee.
| Cannon County: | 89.5% |
| State average: | 87.0% |
Place of birth for U.S.-born residents:
- This state: 10,064
- Other state: 4,321
- Northeast: 619
- Midwest: 1,196
- South: 2,068
- West: 434
- 67.3%Electricity
- 21.4%Utility gas
- 7.3%Bottled, tank, or LP gas
- 3.6%Wood
- 0.2%Solar energy
- 0.2%Fuel oil, kerosene, etc.
- 76.3%Electricity
- 17.4%Utility gas
- 3.9%Wood
- 1.9%Bottled, tank, or LP gas
- 0.5%No fuel used
Private vs. public school enrollment:
| Here: | 17.5% |
| Tennessee: | 15.0% |
| Here: | 15.0% |
| Tennessee: | 16.2% |
| Here: | 4.0% |
| Tennessee: | 23.5% |
Cannon County government finances - Expenditure in 2020:
- Charges - Elementary and Secondary Education - Other: $1,397,000
Elementary and Secondary Education - Other: $1,382,000
Elementary and Secondary Education School Lunch: $266,000
Elementary and Secondary Education School Lunch: $209,000
Solid Waste Management: $11,000
Parks and Recreation: $1,000
- Construction - Elementary and Secondary Education: $1,547,000
Elementary and Secondary Education: $430,000
- Current Operations - Elementary and Secondary Education: $19,002,000
Elementary and Secondary Education: $17,316,000
Police Protection: $2,258,000
Police Protection: $1,955,000
Regular Highways: $1,039,000
Local Fire Protection: $998,000
General - Other: $941,000
General - Other: $896,000
Central Staff Services: $685,000
Health - Other: $622,000
Solid Waste Management: $562,000
Judicial and Legal Services: $551,000
Solid Waste Management: $324,000
Financial Administration: $317,000
General Public Buildings: $219,000
Libraries: $184,000
Libraries: $154,000
Local Fire Protection: $111,000
Financial Administration: $77,000
Parks and Recreation: $42,000
Judicial and Legal Services: $25,000
Central Staff Services: $3,000
- General - Interest on Debt: $201,000
- Intergovernmental to Local - Other - Elementary and Secondary Education: $13,000
- Local Intergovernmental - Highways: $1,155,000
Other: $264,000
Education: $34,000
Education: $31,000
Health and Hospitals: $25,000
- Long Term Debt - Beginning Outstanding - Unspecified Public Purpose: $5,644,000
Outstanding Unspecified Public Purpose: $5,454,000
Beginning Outstanding - Unspecified Public Purpose: $5,021,000
Outstanding Unspecified Public Purpose: $4,391,000
Retired Unspecified Public Purpose: $630,000
Beginning Outstanding - Public Debt for Private Purpose: $528,000
Outstanding Nonguaranteed - Industrial Revenue: $484,000
Retired Unspecified Public Purpose: $190,000
Retired Nonguaranteed - Public Debt for Private Purpose: $44,000
- Miscellaneous - General Revenue - Other: $2,205,000
Interest Earnings: $139,000
General Revenue - Other: $95,000
Donations From Private Sources: $32,000
Donations From Private Sources: $23,000
Sale of Property: $6,000
Sale of Property: $2,000
- Other Capital Outlay - Elementary and Secondary Education: $410,000
Elementary and Secondary Education: $350,000
- Other Funds - Cash and Securities: $8,591,000
Cash and Securities: $3,190,000
- Short Term Debt Outstanding - Beginning: $1,020,000
- Sinking Funds - Cash and Securities: $484,000
- State Intergovernmental - Education: $14,971,000
Education: $14,137,000
Highways: $3,448,000
Highways: $2,053,000
Housing and Community Development: $400,000
Other: $103,000
Other: $97,000
Health and Hospitals: $25,000
- Tax - Property: $4,865,000
Property: $3,724,000
Motor Vehicle License: $714,000
General Sales and Gross Receipts: $483,000
Public Utilities Sales: $276,000
General Sales and Gross Receipts: $255,000
Other Selective Sales: $170,000
Alcoholic Beverage Sales: $110,000
Alcoholic Beverage Sales: $35,000
- Total Salaries and Wages: $15,136,000
: $10,170,000
Cannon County government finances - Revenue in 2020:
- Charges - Elementary and Secondary Education - Other: $1,397,000
Elementary and Secondary Education - Other: $1,382,000
Elementary and Secondary Education School Lunch: $266,000
Elementary and Secondary Education School Lunch: $209,000
Solid Waste Management: $11,000
Parks and Recreation: $1,000
- Construction - Elementary and Secondary Education: $1,547,000
Elementary and Secondary Education: $430,000
- Current Operations - Elementary and Secondary Education: $19,002,000
Elementary and Secondary Education: $17,316,000
Police Protection: $2,258,000
Police Protection: $1,955,000
Regular Highways: $1,039,000
Local Fire Protection: $998,000
General - Other: $941,000
General - Other: $896,000
Central Staff Services: $685,000
Health - Other: $622,000
Solid Waste Management: $562,000
Judicial and Legal Services: $551,000
Solid Waste Management: $324,000
Financial Administration: $317,000
General Public Buildings: $219,000
Libraries: $184,000
Libraries: $154,000
Local Fire Protection: $111,000
Financial Administration: $77,000
Parks and Recreation: $42,000
Judicial and Legal Services: $25,000
Central Staff Services: $3,000
- General - Interest on Debt: $201,000
- Intergovernmental to Local - Other - Elementary and Secondary Education: $13,000
- Local Intergovernmental - Highways: $1,155,000
Other: $264,000
Education: $34,000
Education: $31,000
Health and Hospitals: $25,000
- Long Term Debt - Beginning Outstanding - Unspecified Public Purpose: $5,644,000
Outstanding Unspecified Public Purpose: $5,454,000
Beginning Outstanding - Unspecified Public Purpose: $5,021,000
Outstanding Unspecified Public Purpose: $4,391,000
Retired Unspecified Public Purpose: $630,000
Beginning Outstanding - Public Debt for Private Purpose: $528,000
Outstanding Nonguaranteed - Industrial Revenue: $484,000
Retired Unspecified Public Purpose: $190,000
Retired Nonguaranteed - Public Debt for Private Purpose: $44,000
- Miscellaneous - General Revenue - Other: $2,205,000
Interest Earnings: $139,000
General Revenue - Other: $95,000
Donations From Private Sources: $32,000
Donations From Private Sources: $23,000
Sale of Property: $6,000
Sale of Property: $2,000
- Other Capital Outlay - Elementary and Secondary Education: $410,000
Elementary and Secondary Education: $350,000
- Other Funds - Cash and Securities: $8,591,000
Cash and Securities: $3,190,000
- Short Term Debt Outstanding - Beginning: $1,020,000
- Sinking Funds - Cash and Securities: $484,000
- State Intergovernmental - Education: $14,971,000
Education: $14,137,000
Highways: $3,448,000
Highways: $2,053,000
Housing and Community Development: $400,000
Other: $103,000
Other: $97,000
Health and Hospitals: $25,000
- Tax - Property: $4,865,000
Property: $3,724,000
Motor Vehicle License: $714,000
General Sales and Gross Receipts: $483,000
Public Utilities Sales: $276,000
General Sales and Gross Receipts: $255,000
Other Selective Sales: $170,000
Alcoholic Beverage Sales: $110,000
Alcoholic Beverage Sales: $35,000
- Total Salaries and Wages: $15,136,000
: $10,170,000
Cannon County government finances - Debt in 2020:
- Charges - Elementary and Secondary Education - Other: $1,397,000
Elementary and Secondary Education - Other: $1,382,000
Elementary and Secondary Education School Lunch: $266,000
Elementary and Secondary Education School Lunch: $209,000
Solid Waste Management: $11,000
Parks and Recreation: $1,000
- Construction - Elementary and Secondary Education: $1,547,000
Elementary and Secondary Education: $430,000
- Current Operations - Elementary and Secondary Education: $19,002,000
Elementary and Secondary Education: $17,316,000
Police Protection: $2,258,000
Police Protection: $1,955,000
Regular Highways: $1,039,000
Local Fire Protection: $998,000
General - Other: $941,000
General - Other: $896,000
Central Staff Services: $685,000
Health - Other: $622,000
Solid Waste Management: $562,000
Judicial and Legal Services: $551,000
Solid Waste Management: $324,000
Financial Administration: $317,000
General Public Buildings: $219,000
Libraries: $184,000
Libraries: $154,000
Local Fire Protection: $111,000
Financial Administration: $77,000
Parks and Recreation: $42,000
Judicial and Legal Services: $25,000
Central Staff Services: $3,000
- General - Interest on Debt: $201,000
- Intergovernmental to Local - Other - Elementary and Secondary Education: $13,000
- Local Intergovernmental - Highways: $1,155,000
Other: $264,000
Education: $34,000
Education: $31,000
Health and Hospitals: $25,000
- Long Term Debt - Beginning Outstanding - Unspecified Public Purpose: $5,644,000
Outstanding Unspecified Public Purpose: $5,454,000
Beginning Outstanding - Unspecified Public Purpose: $5,021,000
Outstanding Unspecified Public Purpose: $4,391,000
Retired Unspecified Public Purpose: $630,000
Beginning Outstanding - Public Debt for Private Purpose: $528,000
Outstanding Nonguaranteed - Industrial Revenue: $484,000
Retired Unspecified Public Purpose: $190,000
Retired Nonguaranteed - Public Debt for Private Purpose: $44,000
- Miscellaneous - General Revenue - Other: $2,205,000
Interest Earnings: $139,000
General Revenue - Other: $95,000
Donations From Private Sources: $32,000
Donations From Private Sources: $23,000
Sale of Property: $6,000
Sale of Property: $2,000
- Other Capital Outlay - Elementary and Secondary Education: $410,000
Elementary and Secondary Education: $350,000
- Other Funds - Cash and Securities: $8,591,000
Cash and Securities: $3,190,000
- Short Term Debt Outstanding - Beginning: $1,020,000
- Sinking Funds - Cash and Securities: $484,000
- State Intergovernmental - Education: $14,971,000
Education: $14,137,000
Highways: $3,448,000
Highways: $2,053,000
Housing and Community Development: $400,000
Other: $103,000
Other: $97,000
Health and Hospitals: $25,000
- Tax - Property: $4,865,000
Property: $3,724,000
Motor Vehicle License: $714,000
General Sales and Gross Receipts: $483,000
Public Utilities Sales: $276,000
General Sales and Gross Receipts: $255,000
Other Selective Sales: $170,000
Alcoholic Beverage Sales: $110,000
Alcoholic Beverage Sales: $35,000
- Total Salaries and Wages: $15,136,000
: $10,170,000
Cannon County government finances - Cash and Securities in 2020:
- Charges - Elementary and Secondary Education - Other: $1,397,000
Elementary and Secondary Education - Other: $1,382,000
Elementary and Secondary Education School Lunch: $266,000
Elementary and Secondary Education School Lunch: $209,000
Solid Waste Management: $11,000
Parks and Recreation: $1,000
- Construction - Elementary and Secondary Education: $1,547,000
Elementary and Secondary Education: $430,000
- Current Operations - Elementary and Secondary Education: $19,002,000
Elementary and Secondary Education: $17,316,000
Police Protection: $2,258,000
Police Protection: $1,955,000
Regular Highways: $1,039,000
Local Fire Protection: $998,000
General - Other: $941,000
General - Other: $896,000
Central Staff Services: $685,000
Health - Other: $622,000
Solid Waste Management: $562,000
Judicial and Legal Services: $551,000
Solid Waste Management: $324,000
Financial Administration: $317,000
General Public Buildings: $219,000
Libraries: $184,000
Libraries: $154,000
Local Fire Protection: $111,000
Financial Administration: $77,000
Parks and Recreation: $42,000
Judicial and Legal Services: $25,000
Central Staff Services: $3,000
- General - Interest on Debt: $201,000
- Intergovernmental to Local - Other - Elementary and Secondary Education: $13,000
- Local Intergovernmental - Highways: $1,155,000
Other: $264,000
Education: $34,000
Education: $31,000
Health and Hospitals: $25,000
- Long Term Debt - Beginning Outstanding - Unspecified Public Purpose: $5,644,000
Outstanding Unspecified Public Purpose: $5,454,000
Beginning Outstanding - Unspecified Public Purpose: $5,021,000
Outstanding Unspecified Public Purpose: $4,391,000
Retired Unspecified Public Purpose: $630,000
Beginning Outstanding - Public Debt for Private Purpose: $528,000
Outstanding Nonguaranteed - Industrial Revenue: $484,000
Retired Unspecified Public Purpose: $190,000
Retired Nonguaranteed - Public Debt for Private Purpose: $44,000
- Miscellaneous - General Revenue - Other: $2,205,000
Interest Earnings: $139,000
General Revenue - Other: $95,000
Donations From Private Sources: $32,000
Donations From Private Sources: $23,000
Sale of Property: $6,000
Sale of Property: $2,000
- Other Capital Outlay - Elementary and Secondary Education: $410,000
Elementary and Secondary Education: $350,000
- Other Funds - Cash and Securities: $8,591,000
Cash and Securities: $3,190,000
- Short Term Debt Outstanding - Beginning: $1,020,000
- Sinking Funds - Cash and Securities: $484,000
- State Intergovernmental - Education: $14,971,000
Education: $14,137,000
Highways: $3,448,000
Highways: $2,053,000
Housing and Community Development: $400,000
Other: $103,000
Other: $97,000
Health and Hospitals: $25,000
- Tax - Property: $4,865,000
Property: $3,724,000
Motor Vehicle License: $714,000
General Sales and Gross Receipts: $483,000
Public Utilities Sales: $276,000
General Sales and Gross Receipts: $255,000
Other Selective Sales: $170,000
Alcoholic Beverage Sales: $110,000
Alcoholic Beverage Sales: $35,000
- Total Salaries and Wages: $15,136,000
: $10,170,000
Supplemental Security Income (SSI) in 2006:
- Total number of recipients: 373
- Number of aged recipients: 56
- Number of blind and disabled recipients: 317
- Number of recipients under 18: 32
- Number of recipients between 18 and 64: 250
- Number of recipients older than 64: 91
- Number of recipients also receiving OASDI: 164
- Amount of payments (thousands of dollars): 145
| Most common first names in Cannon County, TN among deceased individuals | ||
| Name | Count | Lived (average) |
|---|---|---|
| James | 85 | 70.4 years |
| William | 62 | 71.1 years |
| Willie | 59 | 77.7 years |
| Mary | 59 | 78.7 years |
| John | 56 | 73.3 years |
| Robert | 54 | 74.3 years |
| Joe | 35 | 71.5 years |
| George | 33 | 73.4 years |
| Charles | 30 | 63.2 years |
| Jessie | 25 | 78.9 years |
| Most common last names in Cannon County, TN among deceased individuals | ||
| Last name | Count | Lived (average) |
|---|---|---|
| Davenport | 53 | 80.6 years |
| Barrett | 52 | 70.7 years |
| Melton | 46 | 74.7 years |
| Smith | 44 | 76.6 years |
| Thomas | 36 | 74.3 years |
| Reed | 35 | 74.7 years |
| Davis | 34 | 72.3 years |
| Young | 33 | 75.1 years |
| Campbell | 33 | 77.4 years |
| Todd | 32 | 78.2 years |
| Businesses in Cannon County, TN | ||||
| Name | Count | Name | Count | |
|---|---|---|---|---|
| Ace Hardware | 1 | La-Z-Boy | 1 | |
| AutoZone | 1 | McDonald's | 1 | |
| Curves | 1 | Rite Aid | 1 | |
| FedEx | 1 | SONIC Drive-In | 1 | |
| Goodwill | 3 | U-Haul | 1 | |
| H&R Block | 1 | |||