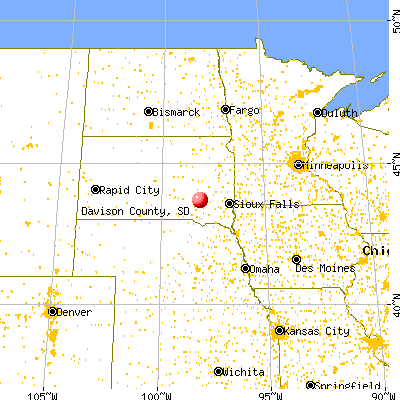
Davison County, South Dakota (SD)
County owner-occupied free and clear houses and condos in 2010: 2,004
County owner-occupied houses and condos in 2000: 4,684
Renter-occupied apartments: 3,166 (it was 2,901 in 2000)
| % of renters here: | 38% |
| State: | 32% |
Land area: 435 sq. mi.
Water area: 1.3 sq. mi.
Population density: 47 people per square mile (average).
Industries providing employment: Educational, health and social services (26.4%), Retail trade (13.6%), Manufacturing (11.4%).
Type of workers:
- Private wage or salary: 77%
- Government: 13%
- Self-employed, not incorporated: 9%
- Unpaid family work: 0%
- OSM Map
- General Map
- Google Map
- MSN Map


- 18,14488.9%White Non-Hispanic Alone
- 8294.1%Hispanic or Latino
- 5322.6%Two or more races
- 4822.4%American Indian and Alaska Native alone
- 1810.9%Asian alone
- 1420.7%Some other race alone
- 930.5%Black Non-Hispanic Alone

| Median resident age: | 40.8 years |
| South Dakota median age: | 38.5 years |
| Males: 10,129 | |
| Females: 10,273 |

 | Rant/Rave (1039 replies) |
| What are cops like in SD? (10 replies) |
| Your Town: Pros and Cons (7 replies) |
| Crime Question/ Confused??? (20 replies) |
| Davison County: | 2.0 people |
| South Dakota: | 2 people |
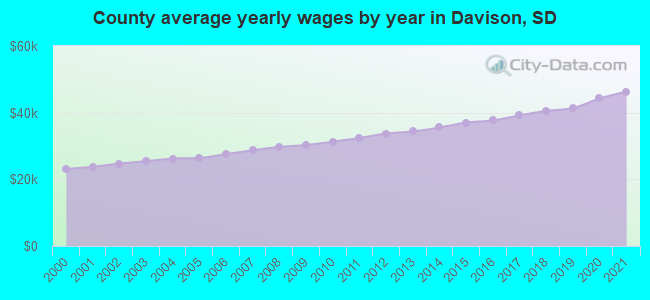
Estimated median household income in 2022: $55,822 ($33,476 in 1999)
| This county: | $55,822 |
| South Dakota: | $69,728 |
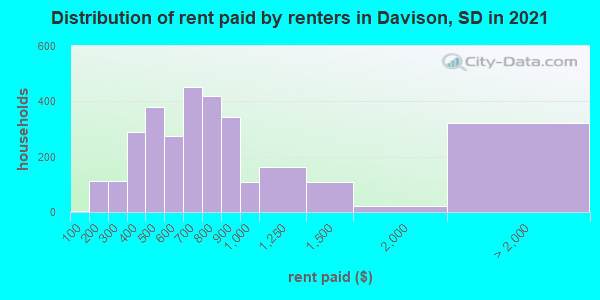
Median contract rent in 2022 for apartments: $686 (lower quartile is $453, upper quartile is $908)
| This county: | $686 |
| State: | $747 |
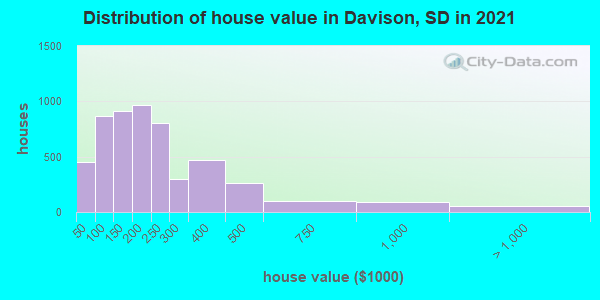
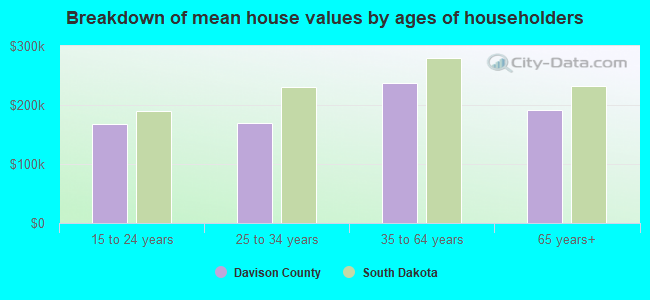
Estimated median house or condo value in 2022: $198,790 (it was $69,600 in 2000)
| Davison: | $198,790 |
| South Dakota: | $245,000 |
Mean price in 2022:
Median monthly housing costs for homes and condos with a mortgage: $1,254Detached houses: $248,023
Here: $248,023 State: $303,134 Townhouses or other attached units: $262,495
Here: $262,495 State: $292,182 In 2-unit structures: $54,697
Here: $54,697 State: $202,885 Mobile homes: $25,485
Here: $25,485 State: $82,732
Median monthly housing costs for units without a mortgage: $551
Institutionalized population: 372
Crime in 2021 (reported by the sheriff's office or county police, not the county total):
- Murders: 0
- Rapes: 1
- Robberies: 0
- Assaults: 0
- Burglaries: 1
- Thefts: 2
- Auto thefts: 1
Crime in 2020 (reported by the sheriff's office or county police, not the county total):
- Murders: 0
- Rapes: 3
- Robberies: 0
- Assaults: 3
- Burglaries: 9
- Thefts: 2
- Auto thefts: 3
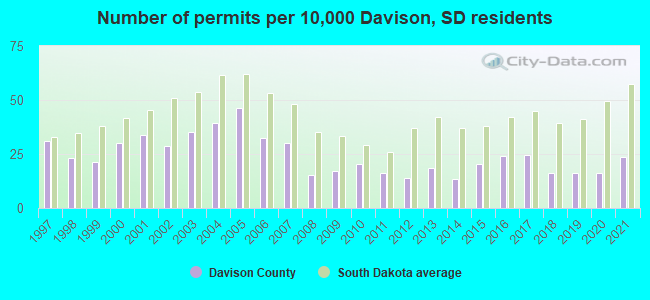
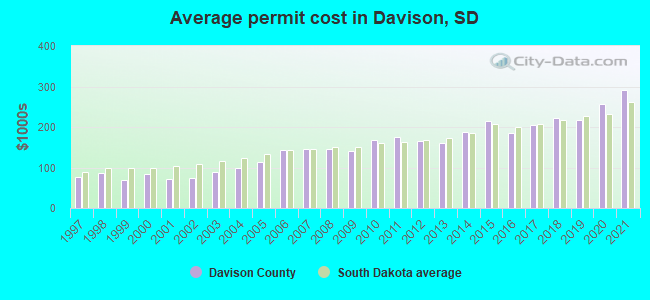
Single-family new house construction building permits:
- 2022: 46 buildings, average cost: $252,700
- 2021: 44 buildings, average cost: $292,300
- 2020: 30 buildings, average cost: $255,500
- 2019: 30 buildings, average cost: $218,200
- 2018: 30 buildings, average cost: $222,200
- 2017: 46 buildings, average cost: $204,900
- 2016: 45 buildings, average cost: $185,900
- 2015: 38 buildings, average cost: $215,300
- 2014: 25 buildings, average cost: $187,300
- 2013: 35 buildings, average cost: $159,900
- 2012: 26 buildings, average cost: $166,400
- 2011: 30 buildings, average cost: $174,800
- 2010: 38 buildings, average cost: $169,100
- 2009: 32 buildings, average cost: $139,700
- 2008: 29 buildings, average cost: $145,700
- 2007: 56 buildings, average cost: $144,500
- 2006: 61 buildings, average cost: $142,100
- 2005: 87 buildings, average cost: $112,500
- 2004: 74 buildings, average cost: $99,500
- 2003: 66 buildings, average cost: $89,700
- 2002: 54 buildings, average cost: $75,300
- 2001: 63 buildings, average cost: $72,300
- 2000: 56 buildings, average cost: $84,600
- 1999: 40 buildings, average cost: $70,100
- 1998: 43 buildings, average cost: $87,000
- 1997: 58 buildings, average cost: $76,700
Median real estate property taxes paid for housing units with mortgages in 2022: $2,328 (1.1%)
Median real estate property taxes paid for housing units with no mortgage in 2022: $2,214 (1.2%)

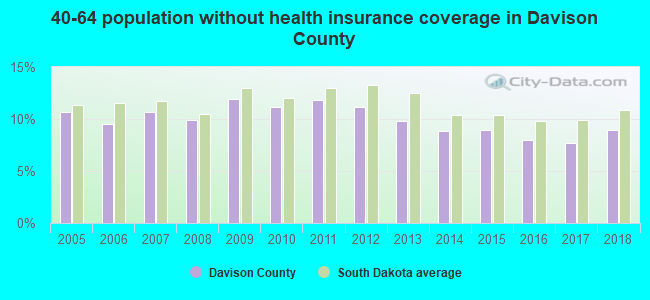
| Davison County: | 15.5% |
| South Dakota: | 12.5% |
Median age of residents in 2022: 40.8 years old
(Males: 39.4 years old, Females: 42.2 years old)
(Median age for: White residents: 43.0 years old, Black residents: 38.2 years old, American Indian residents: 24.3 years old, Asian residents: 22.4 years old, Hispanic or Latino residents: 26.0 years old, Other race residents: 33.5 years old)
Fair market rent in 2006 for a 1-bedroom apartment in Davison County is $394 a month.
Fair market rent for a 2-bedroom apartment is $517 a month.
Fair market rent for a 3-bedroom apartment is $663 a month.
Cities in this county include: Mitchell, Mount Vernon, Ethan, Loomis.
Notable locations in this county outside city limits:
Notable locations in Davison County: Rosedale Colony (A), Riverside Camp (B), Rosedale Fire Department (C). Display/hide their locations on the map
Cemeteries: Emery Cemetery (1), Graceland Cemetery (2), New Hope Cemetery (3), Green Hill Cemetery (4), Elfert Cemetery (5), Saint Peter Cemetery (6), Saint Martins Cemetery (7). Display/hide their locations on the map
Lakes and reservoirs: Spring Lake (A), Lake Eli (B), Lutz Lake (C), Long Lake (D), Welker Lake (E), Ethan Lake (F), Hanson Lake (G), Lake Fulton (H). Display/hide their locations on the map
Creeks: Bloom Creek (A), Pierre Creek (B), Johnson Creek (C), Firesteel Creek (D), Enemy Creek (E). Display/hide their locations on the map
Parks in Davison County include: Long Lake State Public Shooting Area (1), Spencer State Public Shooting Area (2). Display/hide their locations on the map
Neighboring counties: Charles Mix County  , Custer County
  , Jerauld County
  , Nobles County, Minnesota
  , Olmsted County, Minnesota .
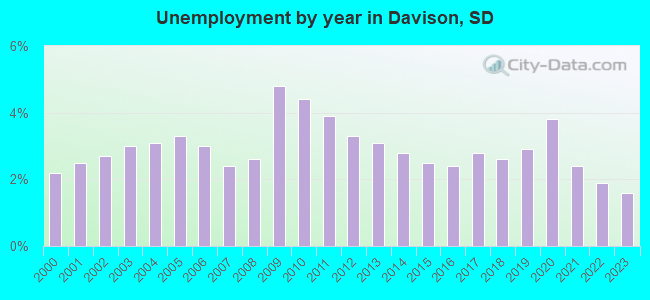
| Here: | 1.7% |
| South Dakota: | 2.0% |
Current college students: 1,283
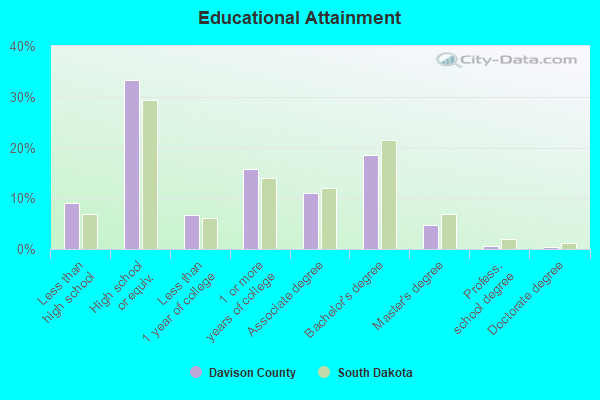
People 25 years of age or older with a high school degree or higher: 90.2%
People 25 years of age or older with a bachelor's degree or higher: 23.3%
Number of foreign born residents: 338 (43.1% naturalized citizens)
| Davison County: | 1.7% |
| Whole state: | 3.5% |

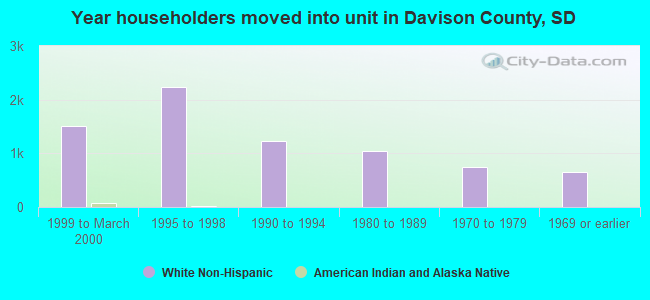
- Year of entry for the foreign-born population
- 2222010 or later
- 642000 to 2009
- 441990 to 1999
- 231980 to 1989
- 171970 to 1979
- 51Before 1970
Mean travel time to work (commute): minutes
Percentage of county residents living and working in this county: 99.8%
Housing units in structures:
- One, detached: 6,039
- One, attached: 221
- Two: 111
- 3 or 4: 631
- 5 to 9: 748
- 10 to 19: 551
- 20 to 49: 480
- 50 or more: 456
- Mobile homes: 525
Housing units in Davison County with a mortgage: 3,018 (208 second mortgage, 0 home equity loan, 169 both second mortgage and home equity loan)
Houses without a mortgage: 181
| Here: | 1.6% with mortgage |
| State: | 98.3% with mortgage |
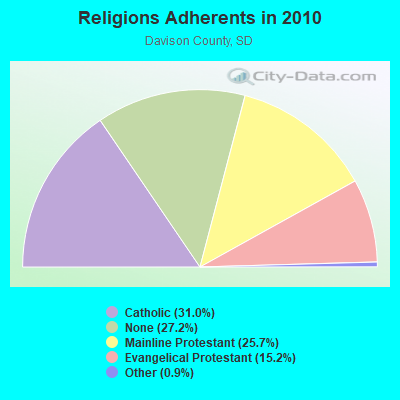
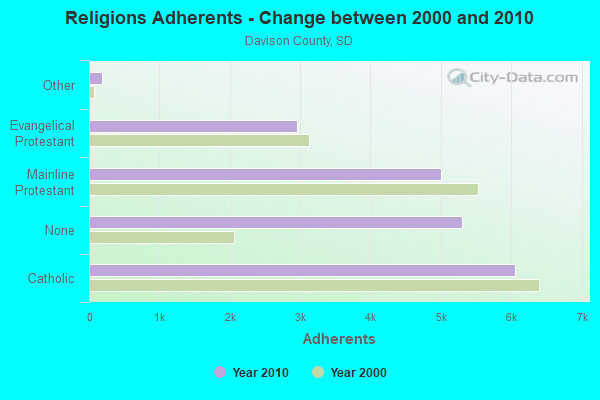
Religion statistics for Davison County
| Religion | Adherents | Congregations |
|---|---|---|
| Catholic | 6,054 | 4 |
| Mainline Protestant | 5,004 | 11 |
| Evangelical Protestant | 2,961 | 20 |
| Other | 179 | 2 |
| None | 5,306 | - |
Source: Clifford Grammich, Kirk Hadaway, Richard Houseal, Dale E.Jones, Alexei Krindatch, Richie Stanley and Richard H.Taylor. 2012. 2010 U.S.Religion Census: Religious Congregations & Membership Study. Association of Statisticians of American Religious Bodies. Jones, Dale E., et al. 2002. Congregations and Membership in the United States 2000. Nashville, TN: Glenmary Research Center.
Food Environment Statistics:
| Davison County: | 1.58 / 10,000 pop. |
| State: | 2.84 / 10,000 pop. |
| Here: | 0.53 / 10,000 pop. |
| South Dakota: | 0.29 / 10,000 pop. |
| This county: | 0.53 / 10,000 pop. |
| South Dakota: | 0.65 / 10,000 pop. |
| Davison County: | 6.85 / 10,000 pop. |
| South Dakota: | 6.68 / 10,000 pop. |
| This county: | 8.43 / 10,000 pop. |
| State: | 9.21 / 10,000 pop. |
| Davison County: | 7.2% |
| South Dakota: | 7.7% |
| Davison County: | 27.7% |
| State: | 27.7% |
| Here: | 15.9% |
| State: | 14.9% |
Agriculture in Davison County:
Average size of farms: 579 acresAverage value of agricultural products sold per farm: $88,860
Average value of crops sold per acre for harvested cropland: $104.41
The value of livestock, poultry, and their products as a percentage of the total market value of agricultural products sold: 56.28%
Average total farm production expenses per farm: $73,787
Harvested cropland as a percentage of land in farms: 64.23%
Irrigated harvested cropland as a percentage of land in farms: 0.94%
Average market value of all machinery and equipment per farm: $94,460
The percentage of farms operated by a family or individual: 90.85%
Average age of principal farm operators: 50 years
Average number of cattle and calves per 100 acres of all land in farms: 14.58
Milk cows as a percentage of all cattle and calves: 1.77%
Corn for grain: 54529 harvested acres
All wheat for grain: 10628 harvested acres
Soybeans for beans: 58950 harvested acres
Tornado activity:
Davison County historical area-adjusted tornado activity is significantly below South Dakota state average. It is 1966237.9 times below overall U.S. average.Tornadoes in this county have caused 6 fatalities and 151 injuries recorded between 1950 and 2004.
On 5/30/1998, a category 4 (max. wind speeds 207-260 mph) tornado killed 6 people and injured 150 people and caused $18 million in damages.
Earthquake activity:
Davison County-area historical earthquake activity is significantly above South Dakota state average. It is 202% greater than the overall U.S. average.On 3/4/1983 at 06:32:18, a magnitude 4.6 (4.4 MB, 4.6 LG, 4.4 ML, Class: Light, Intensity: IV - V) earthquake occurred 75.6 miles away from Davison County center
On 8/18/1959 at 06:37:13, a magnitude 7.7 (7.7 UK, Class: Major, Intensity: VIII - XII) earthquake occurred 626.8 miles away from the county center, causing $26,000,000 total damage
On 11/3/2002 at 20:41:56, a magnitude 4.3 (4.3 MB, Depth: 3.1 mi) earthquake occurred 76.0 miles away from the county center
On 10/25/1990 at 06:25:25, a magnitude 3.9 (3.6 MB, 3.9 LG, Depth: 3.1 mi, Class: Light, Intensity: II - III) earthquake occurred 21.0 miles away from the county center
On 7/9/1975 at 14:54:15, a magnitude 4.6 (4.6 MB) earthquake occurred 169.5 miles away from Davison County center
On 10/18/1984 at 15:30:23, a magnitude 5.5 (5.4 MB, 5.1 MS, 5.5 ML, Class: Moderate, Intensity: VI - VII) earthquake occurred 389.0 miles away from the county center
Magnitude types: regional Lg-wave magnitude (LG), body-wave magnitude (MB), local magnitude (ML), surface-wave magnitude (MS)
Most recent natural disasters:
- South Dakota Covid-19 Pandemic, Incident Period: January 20, 2020, FEMA Id: 4527, Natural disaster type: Other
- South Dakota Severe Storms, Tornadoes, And Flooding, Incident Period: September 9, 2019 - September 26, 2019, Major Disaster (Presidential) Declared DR-4469-SD: November 18, 2019, FEMA Id: 4469, Natural disaster type: Storm, Tornado, Flood
- South Dakota Severe Winter Storm, Snowstorm, And Flooding, Incident Period: March 13, 2019 - April 26, 2019, FEMA Id: 4440, Natural disaster type: Snowstorm, Winter Storm, Flood
- South Dakota Severe Storms, Tornadoes, and Flooding, Incident Period: May 04, 2007 to June 08, 2007, Major Disaster (Presidential) Declared DR-1702: May 22, 2007, FEMA Id: 1702, Natural disaster type: Storm, Tornado, Flood
- South Dakota Severe Winter Storm, Incident Period: November 27, 2005 to November 29, 2005, Major Disaster (Presidential) Declared DR-1620: December 20, 2005, FEMA Id: 1620, Natural disaster type: Winter Storm
- South Dakota Hurricane Katrina Evacuation, Incident Period: September 06, 2005 to October 01, 2005, Emergency Declared EM-3234: September 10, 2005, FEMA Id: 3234, Natural disaster type: Hurricane
- South Dakota Severe Storms/Flooding, Incident Period: February 03, 1997 to May 24, 1997, Major Disaster (Presidential) Declared DR-1173: April 07, 1997, FEMA Id: 1173, Natural disaster type: Storm, Flood
- South Dakota Severe Winter Storms/Blizzards, Incident Period: January 03, 1997 to January 31, 1997, Major Disaster (Presidential) Declared DR-1156: January 10, 1997, FEMA Id: 1156, Natural disaster type: Winter Storm, Blizzard
- South Dakota Ice Storms, Incident Period: October 22, 1995 to October 24, 1995, Major Disaster (Presidential) Declared DR-1075: January 05, 1996, FEMA Id: 1075, Natural disaster type: Ice Storm
- South Dakota Severe Storms, Flooding, Incident Period: March 01, 1995 to June 20, 1995, Major Disaster (Presidential) Declared DR-1052: May 26, 1995, FEMA Id: 1052, Natural disaster type: Storm, Flood
- 3 other natural disasters have been reported since 1953.
The number of natural disasters in Davison County (13) is near the US average (15).
Major Disasters (Presidential) Declared: 9
Emergencies Declared: 2
Causes of natural disasters: Floods: 7, Storms: 6, Tornadoes: 3, Winter Storms: 3, Blizzard: 1, Drought: 1, Hurricane: 1, Ice Storm: 1, Snowstorm: 1, Other: 1 (Note: some incidents may be assigned to more than one category).
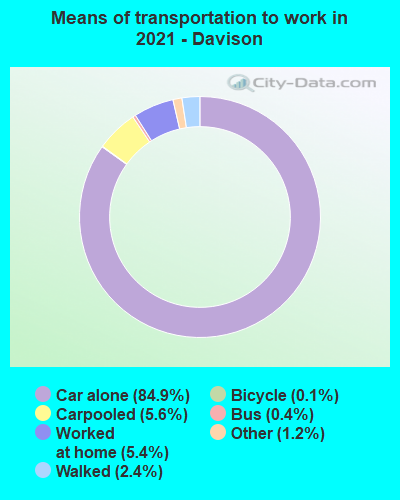
Means of transportation to work:
- Drove a car alone: 10,015 (82.8%)
- Carpooled: 734 (6.1%)
- Bus: 49 (0.4%)
- Taxicab, motorcycle, or other means: 157 (1.3%)
- Bicycle: 8 (0.1%)
- Walked: 188 (1.6%)
- Worked at home: 949 (7.8%)

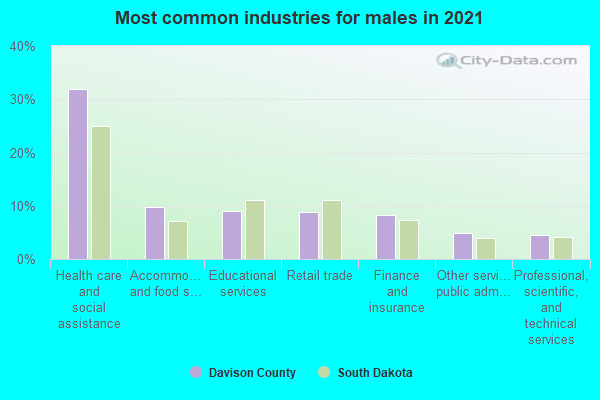
- Health care and social assistance (32%)
- Educational services (10%)
- Retail trade (10%)
- Accommodation and food services (9%)
- Finance and insurance (6%)
- Professional, scientific, and technical services (5%)
- Other services, except public administration (5%)
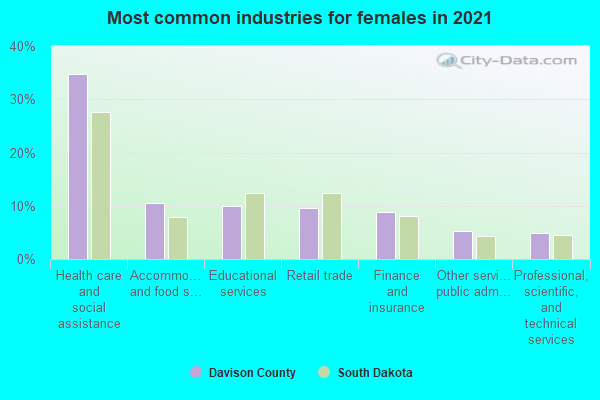
- Health care and social assistance (35%)
- Educational services (12%)
- Retail trade (11%)
- Accommodation and food services (10%)
- Finance and insurance (7%)
- Professional, scientific, and technical services (6%)
- Other services, except public administration (5%)
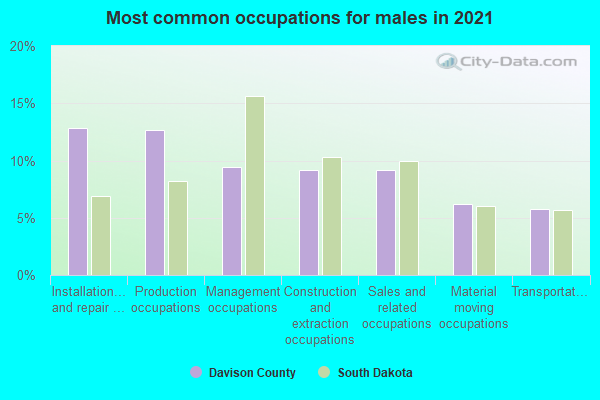
- Management occupations (11%)
- Production occupations (11%)
- Installation, maintenance, and repair occupations (9%)
- Sales and related occupations (9%)
- Construction and extraction occupations (8%)
- Transportation occupations (6%)
- Material moving occupations (6%)

- Office and administrative support occupations (22%)
- Food preparation and serving related occupations (10%)
- Personal care and service occupations (9%)
- Educational instruction, and library occupations (9%)
- Health diagnosing and treating practitioners and other technical occupations (7%)
- Healthcare support occupations (7%)
- Sales and related occupations (7%)
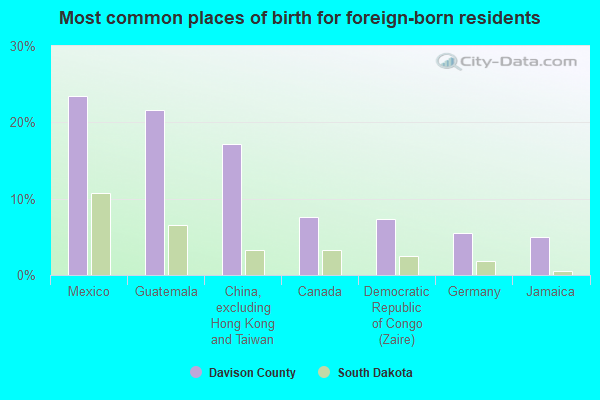
- Mexico (33%)
- Guatemala (15%)
- China, excluding Hong Kong and Taiwan (14%)
- Democratic Republic of Congo (Zaire) (8%)
- Jamaica (5%)
- Canada (5%)
- Germany (5%)
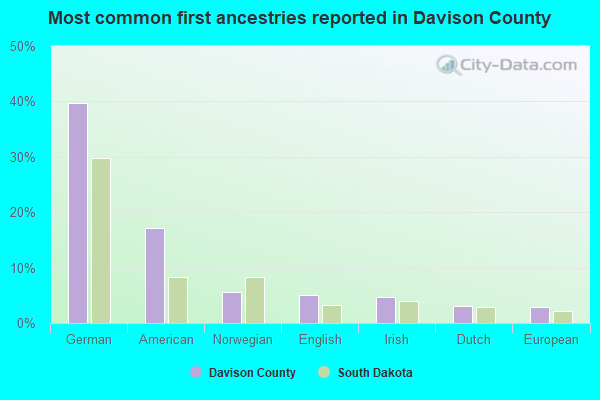
- German (40%)
- American (16%)
- Norwegian (5%)
- Irish (5%)
- English (4%)
- European (3%)
- Dutch (2%)

People in group quarters in Davison County, South Dakota in 2010:
- 326 people in college/university student housing
- 230 people in nursing facilities/skilled-nursing facilities
- 59 people in correctional residential facilities
- 44 people in local jails and other municipal confinement facilities
- 39 people in residential treatment centers for juveniles (non-correctional)
- 31 people in group homes intended for adults
- 24 people in other noninstitutional facilities
- 16 people in workers' group living quarters and job corps centers
People in group quarters in Davison County, South Dakota in 2000:
- 244 people in college dormitories (includes college quarters off campus)
- 181 people in nursing homes
- 75 people in hospitals/wards and hospices for chronically ill
- 75 people in other hospitals or wards for chronically ill
- 50 people in other noninstitutional group quarters
- 38 people in local jails and other confinement facilities (including police lockups)
- 38 people in homes for abused, dependent, and neglected children
- 30 people in homes for the mentally retarded
- 14 people in homes or halfway houses for drug/alcohol abuse
- 7 people in other nonhousehold living situations
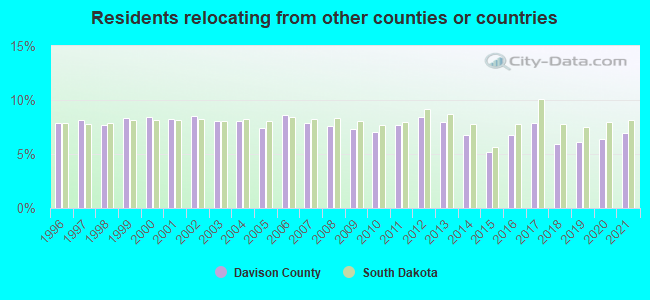
6.94% of this county's 2021 resident taxpayers lived in other counties in 2020 ($48,211 average adjusted gross income)
| Here: | 6.94% |
| South Dakota average: | 8.18% |
10 or fewer of this county's residents moved from foreign countries.
4.41% relocated from other counties in South Dakota ($29,083 average AGI)
2.53% relocated from other states ($19,128 average AGI)
Davison County: 2.53% South Dakota average: 4.11%
Top counties from which taxpayers relocated into this county between 2020 and 2021:
| from Minnehaha County, SD | |
| from Hanson County, SD | |
| from Hutchinson County, SD |
6.85% of this county's 2020 resident taxpayers moved to other counties in 2021 ($47,261 average adjusted gross income)
| Here: | 6.85% |
| South Dakota average: | 7.42% |
10 or fewer of this county's residents moved to foreign countries.
4.78% relocated to other counties in South Dakota ($31,493 average AGI)
2.07% relocated to other states ($15,768 average AGI)
Davison County: 2.07% South Dakota average: 3.31%

Top counties to which taxpayers relocated from this county between 2020 and 2021:
| to Minnehaha County, SD | |
| to Lincoln County, SD | |
| to Aurora County, SD | |
| to Hutchinson County, SD |
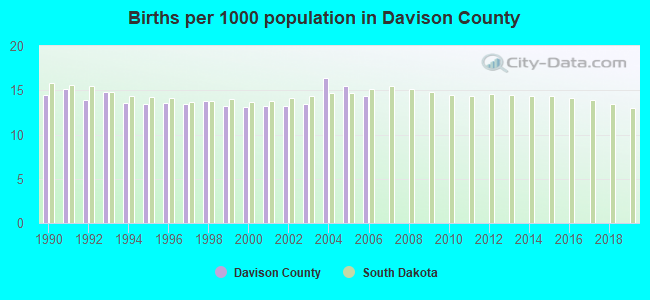
Births per 1000 population from 1990 to 1999: 13.9
Births per 1000 population from 2000 to 2006: 14.2
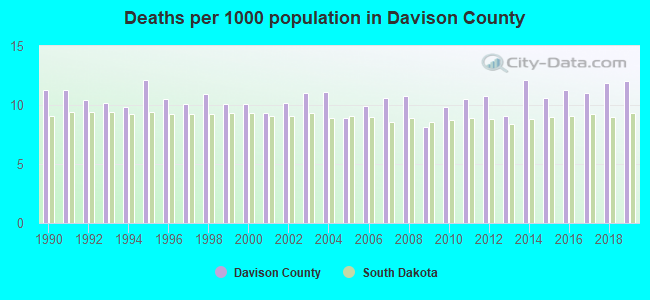
Deaths per 1000 population from 1990 to 1999: 10.7
Deaths per 1000 population from 2000 to 2009: 10.0
Deaths per 1000 population from 2010 to 2020: 11.1
Infant deaths per 1000 live births from 1990 to 1999: 8.4
Infant deaths per 1000 live births from 2000 to 2006: 4.6

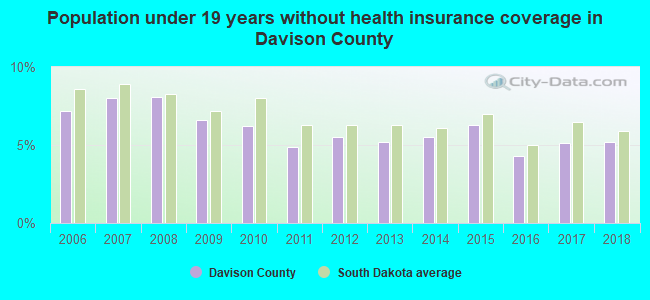
Persons under 19 years old without health insurance coverage in 2018: 5.2%
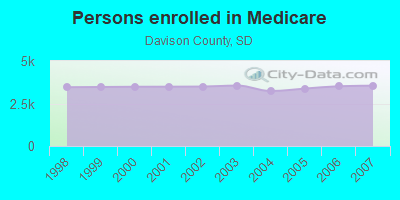
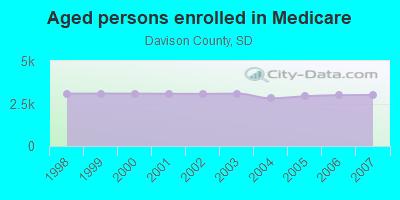
Persons enrolled in hospital insurance and/or supplemental medical insurance (Medicare) in July 1, 2007: 3,547 (3,000 aged, 547 disabled)
Children under 18 without health insurance coverage in 2007: 353 (7%)

Most common underlying causes of death in Davison County, South Dakota in 1999 - 2019:
- Atherosclerotic heart disease (268)
- Bronchus or lung, unspecified - Malignant neoplasms (239)
- Acute myocardial infarction, unspecified (224)
- Stroke, not specified as haemorrhage or infarction (144)
- Cardiovascular disease, unspecified (89)
- Alzheimer disease, unspecified (79)
- Chronic obstructive pulmonary disease, unspecified (74)
- Pneumonia, unspecified (32)
- Atherosclerotic cardiovascular disease, so described (26)
- Unspecified dementia (13)
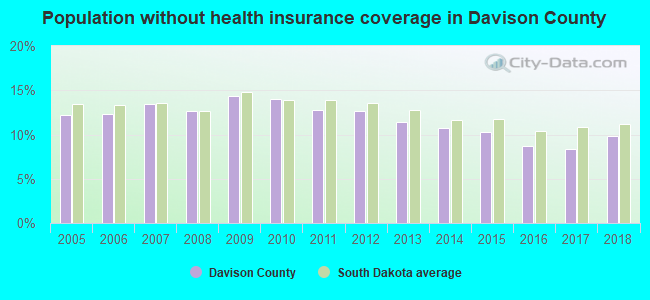
Population without health insurance coverage in 2000: 8%
Children under 18 without health insurance coverage in 2000: 6%
Short term general hospital admissions per 100,000 population in 2004: 19,407
Short term general hospital beds per 100,000 population in 2004: 1,121
Emergency room visits per 100,000 population in 2004: 46,462
General practice office based MDs per 100,000 population in 2005: 1,763
Medical specialist MDs per 100,000 population in 2005: 1,310
Total births per 100,000 population, July 2005 - July 2006 : 56
Total deaths per 100,000 population, July 2005 - July 2006: 117
Limited-service eating places per 100,000 population in 2005 : 27
Household type by relationship:
Households: 20,402- Male householders: 4,549 (1,911 living alone), Female householders: 4,308 (1,683 living alone)
3,941 spouses (3,912 opposite-sex spouses), 653 unmarried partners, (546 opposite-sex unmarried partners), 5,068 children (4,617 natural, 205 adopted, 236 stepchildren), 165 grandchildren, 104 brothers or sisters, 123 parents, 8 foster children, 276 other relatives, 402 non-relatives
- In group quarters: 877
Size of family households: 2,453 2-persons, 857 3-persons, 825 4-persons, 590 5-persons, 101 6-persons, 37 7-or-more-persons.
Size of nonfamily households: 3,588 1-person, 351 2-persons, 20 3-persons, 16 4-persons, 29 6-persons.
3,078 married couples with children.
1,135 single-parent households (353 men, 782 women).
95.8% of residents of Davison speak English at home.
2.6% of residents speak Spanish at home (58% speak English very well, 35% speak English well, 6% speak English not well).
0.6% of residents speak other Indo-European language at home (77% speak English very well, 23% speak English well).
0.1% of residents speak Asian or Pacific Island language at home (46% speak English very well, 54% speak English well).
0.5% of residents speak other language at home (71% speak English very well, 29% speak English well).
In fiscal year 2004:
Federal Government expenditure: $112,172,000 ($5,901 per capita)
Department of Defense expenditure: $7,444,000
Federal direct payments to individuals for retirement and disability: $44,529,000
Federal other direct payments to individuals: $27,497,000
Federal direct payments not to individuals: $5,905,000
Federal grants: $21,218,000
Federal procurement contracts: $3,119,000 ($239,000 Department of Defense)
Federal salaries and wages: $9,904,000 ($5,724,000 Department of Defense)
Federal Government direct loans: $520,000
Federal guaranteed/insured loans: $7,965,000
Federal Government insurance: $26,067,000
Population change from April 1, 2000 to July 1, 2005:
Births: 1,306| Here: | 70 per 1000 residents |
| State: | 72 per 1000 residents |
Deaths: 996
| Here: | 53 per 1000 residents |
| State: | 48 per 1000 residents |
Net international migration: +68
| Here: | +4 per 1000 residents |
| State: | +5 per 1000 residents |
Net internal migration: -311
| Here: | |
| State: |

Total withdrawal of fresh water for public supply: 3.05 millions of gallons per day (1% from ground, 99% from surface)
| Here: | 6.9 |
| State: | 7.0 |
| Here: | 4.1 |
| State: | 4.1 |
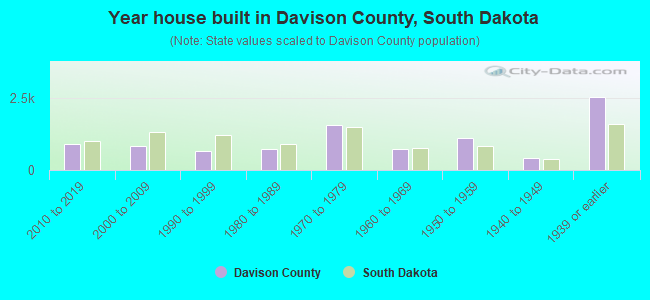
- Year house built in Davison County, South Dakota
- 562020 or later
- 7782010 to 2019
- 1,0492000 to 2009
- 6641990 to 1999
- 8861980 to 1989
- 1,6661970 to 1979
- 8071960 to 1969
- 8621950 to 1959
- 3461940 to 1949
- 2,3641939 or earlier
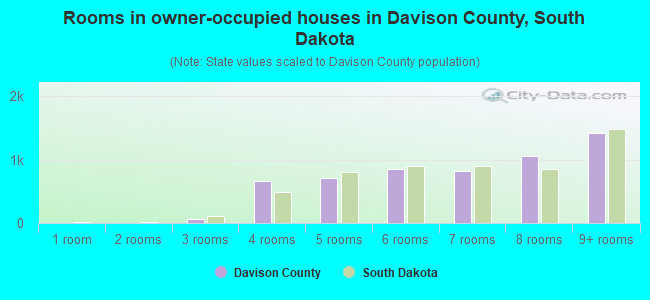
- Rooms in owner-occupied houses in Davison County, South Dakota
- 01 room
- 12 rooms
- 963 rooms
- 8064 rooms
- 6685 rooms
- 9656 rooms
- 7657 rooms
- 9948 rooms
- 1,3799+ rooms
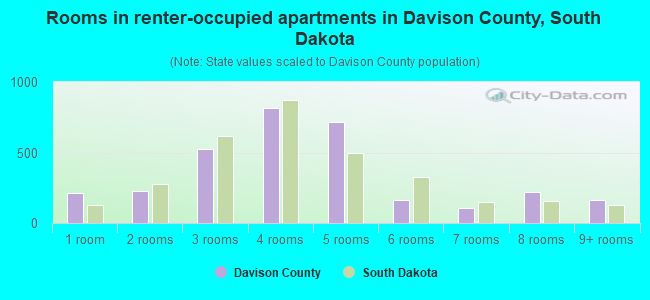
- Rooms in renter-occupied apartments in Davison County, South Dakota
- 1931 room
- 3932 rooms
- 4803 rooms
- 8944 rooms
- 5885 rooms
- 1596 rooms
- 1077 rooms
- 1578 rooms
- 1899+ rooms
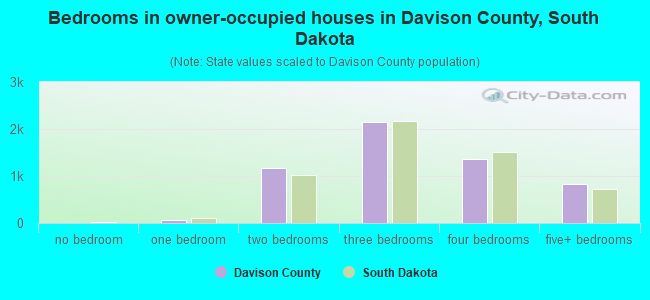
- Bedrooms in owner-occupied houses in Davison County, South Dakota
- 0no bedroom
- 901 bedroom
- 1,2682 bedrooms
- 2,0233 bedrooms
- 1,3684 bedrooms
- 8995+ bedrooms
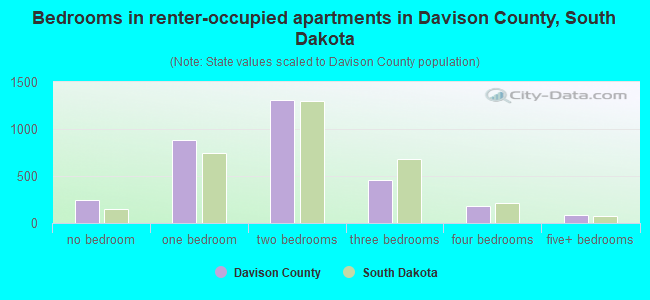
- Bedrooms in renter-occupied apartments in Davison County, South Dakota
- 227no bedroom
- 1,0861 bedroom
- 1,2062 bedrooms
- 4203 bedrooms
- 1854 bedrooms
- 695+ bedrooms
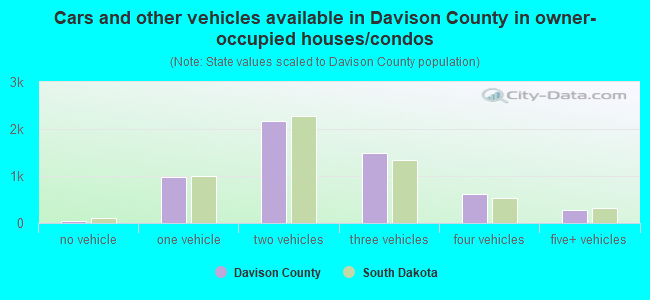
- Cars and other vehicles available in Davison County in owner-occupied houses/condos
- 39no vehicle
- 1,0271 vehicle
- 2,3412 vehicles
- 1,4013 vehicles
- 6124 vehicles
- 2425+ vehicles
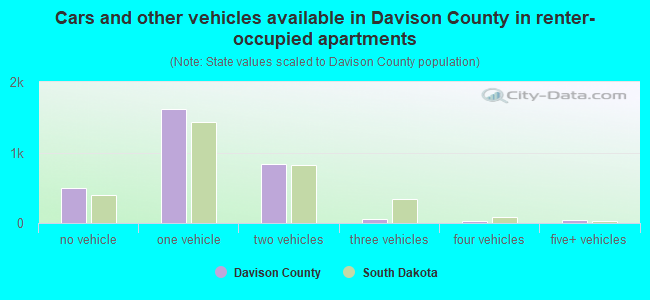
- Cars and other vehicles available in Davison County in renter-occupied apartments
- 636no vehicle
- 1,7871 vehicle
- 6092 vehicles
- 653 vehicles
- 154 vehicles
- 985+ vehicles
86.1% of Davison County residents lived in the same house 1 years ago.
Out of people who lived in different houses, 31% lived in this county.
Out of people who lived in different counties, 78% lived in South Dakota.
| Davison County: | 86.1% |
| State average: | 86.6% |
Place of birth for U.S.-born residents:
- This state: 14,932
- Other state: 4,960
- Northeast: 209
- Midwest: 2,847
- South: 824
- West: 1,093
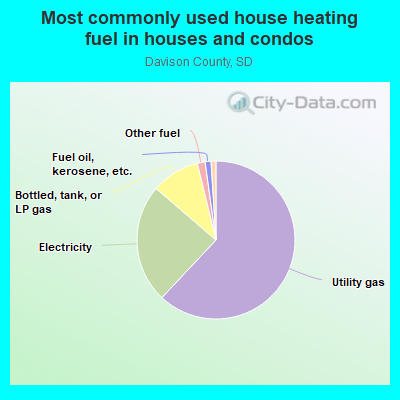
- 59.4%Utility gas
- 27.1%Electricity
- 10.6%Bottled, tank, or LP gas
- 1.4%Other fuel
- 0.8%Fuel oil, kerosene, etc.
- 0.4%Wood
- 0.2%No fuel used
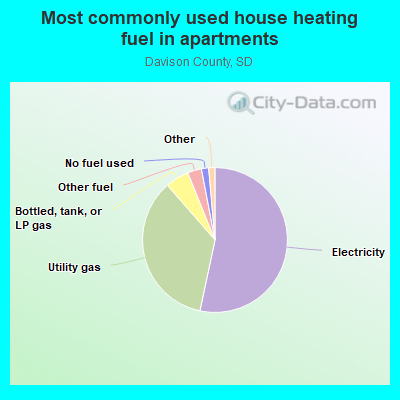
- 51.7%Electricity
- 34.5%Utility gas
- 5.5%Bottled, tank, or LP gas
- 3.8%No fuel used
- 3.5%Other fuel
- 0.7%Wood
- 0.4%Fuel oil, kerosene, etc.
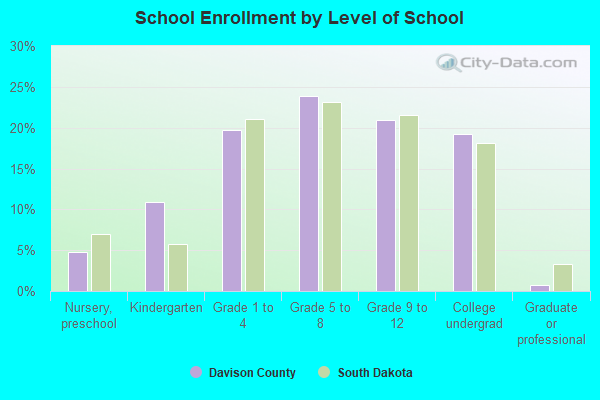
Private vs. public school enrollment:
| Here: | 5.9% |
| South Dakota: | 11.9% |
| Here: | 2.3% |
| South Dakota: | 7.2% |
| Here: | 35.8% |
| South Dakota: | 10.2% |


Davison County government finances - Expenditure in 2018:
- Charges - Other: $1,070,000
Other: $915,000
Regular Highways: $125,000
Regular Highways: $101,000
Natural Resources - Other: $19,000
Natural Resources - Other: $14,000
- Current Operations - Regular Highways: $4,152,000
Regular Highways: $3,275,000
Correctional Institutions: $2,476,000
Correctional Institutions: $2,280,000
Judicial and Legal Services: $1,344,000
Central Staff Services: $1,188,000
Central Staff Services: $1,029,000
Financial Administration: $958,000
Financial Administration: $948,000
Judicial and Legal Services: $875,000
Police Protection: $804,000
Police Protection: $792,000
General Public Buildings: $399,000
General Public Buildings: $301,000
Health - Other: $262,000
Health - Other: $225,000
Public Welfare - Other: $225,000
Natural Resources - Other: $169,000
Public Welfare - Other: $168,000
General - Other: $116,000
Natural Resources - Other: $112,000
General - Other: $104,000
Miscellaneous Commercial Activities - Other: $42,000
Parks and Recreation: $10,000
- Federal Intergovernmental - Other: $139,000
Other: $73,000
- General - Interest on Debt: $73,000
Interest on Debt: $66,000
- Intergovernmental to Local - Other - Regular Highways: $29,000
Other - Regular Highways: $28,000
- Local Intergovernmental - Highways: $51,000
Highways: $50,000
General Local Government Support: $6,000
- Long Term Debt - Beginning Outstanding - Unspecified Public Purpose: $1,815,000
Outstanding Unspecified Public Purpose: $1,728,000
Beginning Outstanding - Unspecified Public Purpose: $1,641,000
Outstanding Unspecified Public Purpose: $1,554,000
Retired Unspecified Public Purpose: $87,000
Retired Unspecified Public Purpose: $87,000
- Miscellaneous - Interest Earnings: $105,000
Rents: $78,000
Rents: $71,000
Interest Earnings: $71,000
Sale of Property: $49,000
Fines and Forfeits: $30,000
Fines and Forfeits: $23,000
General Revenue - Other: $9,000
General Revenue - Other: $6,000
- Other Capital Outlay - Regular Highways: $122,000
- Other Funds - Cash and Securities: $6,229,000
Cash and Securities: $5,638,000
- State Intergovernmental - Highways: $2,153,000
Highways: $1,906,000
General Local Government Support: $432,000
General Local Government Support: $407,000
Other: $25,000
Other: $6,000
- Tax - Property: $6,818,000
Property: $6,232,000
Motor Vehicle License: $574,000
Motor Vehicle License: $569,000
Other License: $37,000
Other License: $29,000
- Total Salaries and Wages: $4,041,000
: $3,779,000
Davison County government finances - Revenue in 2018:
- Charges - Other: $1,070,000
Other: $915,000
Regular Highways: $125,000
Regular Highways: $101,000
Natural Resources - Other: $19,000
Natural Resources - Other: $14,000
- Current Operations - Regular Highways: $4,152,000
Regular Highways: $3,275,000
Correctional Institutions: $2,476,000
Correctional Institutions: $2,280,000
Judicial and Legal Services: $1,344,000
Central Staff Services: $1,188,000
Central Staff Services: $1,029,000
Financial Administration: $958,000
Financial Administration: $948,000
Judicial and Legal Services: $875,000
Police Protection: $804,000
Police Protection: $792,000
General Public Buildings: $399,000
General Public Buildings: $301,000
Health - Other: $262,000
Health - Other: $225,000
Public Welfare - Other: $225,000
Natural Resources - Other: $169,000
Public Welfare - Other: $168,000
General - Other: $116,000
Natural Resources - Other: $112,000
General - Other: $104,000
Miscellaneous Commercial Activities - Other: $42,000
Parks and Recreation: $10,000
- Federal Intergovernmental - Other: $139,000
Other: $73,000
- General - Interest on Debt: $73,000
Interest on Debt: $66,000
- Intergovernmental to Local - Other - Regular Highways: $29,000
Other - Regular Highways: $28,000
- Local Intergovernmental - Highways: $51,000
Highways: $50,000
General Local Government Support: $6,000
- Long Term Debt - Beginning Outstanding - Unspecified Public Purpose: $1,815,000
Outstanding Unspecified Public Purpose: $1,728,000
Beginning Outstanding - Unspecified Public Purpose: $1,641,000
Outstanding Unspecified Public Purpose: $1,554,000
Retired Unspecified Public Purpose: $87,000
Retired Unspecified Public Purpose: $87,000
- Miscellaneous - Interest Earnings: $105,000
Rents: $78,000
Rents: $71,000
Interest Earnings: $71,000
Sale of Property: $49,000
Fines and Forfeits: $30,000
Fines and Forfeits: $23,000
General Revenue - Other: $9,000
General Revenue - Other: $6,000
- Other Capital Outlay - Regular Highways: $122,000
- Other Funds - Cash and Securities: $6,229,000
Cash and Securities: $5,638,000
- State Intergovernmental - Highways: $2,153,000
Highways: $1,906,000
General Local Government Support: $432,000
General Local Government Support: $407,000
Other: $25,000
Other: $6,000
- Tax - Property: $6,818,000
Property: $6,232,000
Motor Vehicle License: $574,000
Motor Vehicle License: $569,000
Other License: $37,000
Other License: $29,000
- Total Salaries and Wages: $4,041,000
: $3,779,000
Davison County government finances - Debt in 2018:
- Charges - Other: $1,070,000
Other: $915,000
Regular Highways: $125,000
Regular Highways: $101,000
Natural Resources - Other: $19,000
Natural Resources - Other: $14,000
- Current Operations - Regular Highways: $4,152,000
Regular Highways: $3,275,000
Correctional Institutions: $2,476,000
Correctional Institutions: $2,280,000
Judicial and Legal Services: $1,344,000
Central Staff Services: $1,188,000
Central Staff Services: $1,029,000
Financial Administration: $958,000
Financial Administration: $948,000
Judicial and Legal Services: $875,000
Police Protection: $804,000
Police Protection: $792,000
General Public Buildings: $399,000
General Public Buildings: $301,000
Health - Other: $262,000
Health - Other: $225,000
Public Welfare - Other: $225,000
Natural Resources - Other: $169,000
Public Welfare - Other: $168,000
General - Other: $116,000
Natural Resources - Other: $112,000
General - Other: $104,000
Miscellaneous Commercial Activities - Other: $42,000
Parks and Recreation: $10,000
- Federal Intergovernmental - Other: $139,000
Other: $73,000
- General - Interest on Debt: $73,000
Interest on Debt: $66,000
- Intergovernmental to Local - Other - Regular Highways: $29,000
Other - Regular Highways: $28,000
- Local Intergovernmental - Highways: $51,000
Highways: $50,000
General Local Government Support: $6,000
- Long Term Debt - Beginning Outstanding - Unspecified Public Purpose: $1,815,000
Outstanding Unspecified Public Purpose: $1,728,000
Beginning Outstanding - Unspecified Public Purpose: $1,641,000
Outstanding Unspecified Public Purpose: $1,554,000
Retired Unspecified Public Purpose: $87,000
Retired Unspecified Public Purpose: $87,000
- Miscellaneous - Interest Earnings: $105,000
Rents: $78,000
Rents: $71,000
Interest Earnings: $71,000
Sale of Property: $49,000
Fines and Forfeits: $30,000
Fines and Forfeits: $23,000
General Revenue - Other: $9,000
General Revenue - Other: $6,000
- Other Capital Outlay - Regular Highways: $122,000
- Other Funds - Cash and Securities: $6,229,000
Cash and Securities: $5,638,000
- State Intergovernmental - Highways: $2,153,000
Highways: $1,906,000
General Local Government Support: $432,000
General Local Government Support: $407,000
Other: $25,000
Other: $6,000
- Tax - Property: $6,818,000
Property: $6,232,000
Motor Vehicle License: $574,000
Motor Vehicle License: $569,000
Other License: $37,000
Other License: $29,000
- Total Salaries and Wages: $4,041,000
: $3,779,000
Davison County government finances - Cash and Securities in 2018:
- Charges - Other: $1,070,000
Other: $915,000
Regular Highways: $125,000
Regular Highways: $101,000
Natural Resources - Other: $19,000
Natural Resources - Other: $14,000
- Current Operations - Regular Highways: $4,152,000
Regular Highways: $3,275,000
Correctional Institutions: $2,476,000
Correctional Institutions: $2,280,000
Judicial and Legal Services: $1,344,000
Central Staff Services: $1,188,000
Central Staff Services: $1,029,000
Financial Administration: $958,000
Financial Administration: $948,000
Judicial and Legal Services: $875,000
Police Protection: $804,000
Police Protection: $792,000
General Public Buildings: $399,000
General Public Buildings: $301,000
Health - Other: $262,000
Health - Other: $225,000
Public Welfare - Other: $225,000
Natural Resources - Other: $169,000
Public Welfare - Other: $168,000
General - Other: $116,000
Natural Resources - Other: $112,000
General - Other: $104,000
Miscellaneous Commercial Activities - Other: $42,000
Parks and Recreation: $10,000
- Federal Intergovernmental - Other: $139,000
Other: $73,000
- General - Interest on Debt: $73,000
Interest on Debt: $66,000
- Intergovernmental to Local - Other - Regular Highways: $29,000
Other - Regular Highways: $28,000
- Local Intergovernmental - Highways: $51,000
Highways: $50,000
General Local Government Support: $6,000
- Long Term Debt - Beginning Outstanding - Unspecified Public Purpose: $1,815,000
Outstanding Unspecified Public Purpose: $1,728,000
Beginning Outstanding - Unspecified Public Purpose: $1,641,000
Outstanding Unspecified Public Purpose: $1,554,000
Retired Unspecified Public Purpose: $87,000
Retired Unspecified Public Purpose: $87,000
- Miscellaneous - Interest Earnings: $105,000
Rents: $78,000
Rents: $71,000
Interest Earnings: $71,000
Sale of Property: $49,000
Fines and Forfeits: $30,000
Fines and Forfeits: $23,000
General Revenue - Other: $9,000
General Revenue - Other: $6,000
- Other Capital Outlay - Regular Highways: $122,000
- Other Funds - Cash and Securities: $6,229,000
Cash and Securities: $5,638,000
- State Intergovernmental - Highways: $2,153,000
Highways: $1,906,000
General Local Government Support: $432,000
General Local Government Support: $407,000
Other: $25,000
Other: $6,000
- Tax - Property: $6,818,000
Property: $6,232,000
Motor Vehicle License: $574,000
Motor Vehicle License: $569,000
Other License: $37,000
Other License: $29,000
- Total Salaries and Wages: $4,041,000
: $3,779,000
Supplemental Security Income (SSI) in 2006:
- Total number of recipients: 358
- Number of aged recipients: 57
- Number of blind and disabled recipients: 301
- Number of recipients under 18: 37
- Number of recipients between 18 and 64: 227
- Number of recipients older than 64: 94
- Number of recipients also receiving OASDI: 210
- Amount of payments (thousands of dollars): 139
| Most common first names in Davison County, SD among deceased individuals | ||
| Name | Count | Lived (average) |
|---|---|---|
| John | 149 | 78.8 years |
| Mary | 146 | 82.2 years |
| William | 125 | 78.6 years |
| George | 85 | 78.5 years |
| Anna | 83 | 85.1 years |
| Robert | 83 | 71.9 years |
| Helen | 71 | 83.1 years |
| Margaret | 68 | 83.3 years |
| James | 65 | 73.7 years |
| Charles | 63 | 77.5 years |
| Most common last names in Davison County, SD among deceased individuals | ||
| Last name | Count | Lived (average) |
|---|---|---|
| Johnson | 95 | 78.3 years |
| Smith | 59 | 78.8 years |
| Miller | 50 | 78.7 years |
| Anderson | 42 | 81.2 years |
| Jones | 36 | 82.2 years |
| Peterson | 33 | 77.5 years |
| Hohn | 30 | 75.5 years |
| Nelson | 27 | 83.3 years |
| Carlson | 26 | 81.2 years |
| Thompson | 25 | 75.9 years |
| Businesses in Davison County, SD | ||||
| Name | Count | Name | Count | |
|---|---|---|---|---|
| Advance Auto Parts | 1 | Maurices | 1 | |
| AmericInn | 1 | McDonald's | 2 | |
| Arby's | 1 | Menards | 1 | |
| Ashley Furniture | 1 | Motel 6 | 1 | |
| Best Western | 1 | New Balance | 2 | |
| Burger King | 1 | Nike | 2 | |
| Chevrolet | 1 | Pizza Hut | 1 | |
| Comfort Inn | 1 | Quality | 1 | |
| Curves | 1 | Quiznos | 1 | |
| Dairy Queen | 2 | RadioShack | 1 | |
| Days Inn | 1 | Ramada | 1 | |
| Domino's Pizza | 1 | Ruby Tuesday | 1 | |
| Econo Lodge | 1 | SAS Shoes | 1 | |
| FedEx | 2 | Sears | 1 | |
| Ford | 1 | Slumberland | 1 | |
| GameStop | 1 | Subway | 2 | |
| H&R Block | 1 | Super 8 | 1 | |
| Hardee's | 1 | Taco Bell | 1 | |
| Hilton | 1 | True Value | 1 | |
| Holiday Inn | 1 | U-Haul | 2 | |
| JCPenney | 1 | UPS | 4 | |
| Kmart | 1 | Vans | 1 | |
| La-Z-Boy | 2 | Walgreens | 1 | |
| Lane Furniture | 1 | Walmart | 1 | |
| MasterBrand Cabinets | 5 | |||
Davison County on our top lists:
- #96 on the list of "Top 101 counties with the lowest ground withdrawal of fresh water for public supply"