Dickson County, Tennessee (TN)
County owner-occupied free and clear houses and condos in 2010: 4,804
County owner-occupied houses and condos in 2000: 12,528
Renter-occupied apartments: 5,123 (it was 3,945 in 2000)
| % of renters here: | 24% |
| State: | 32% |
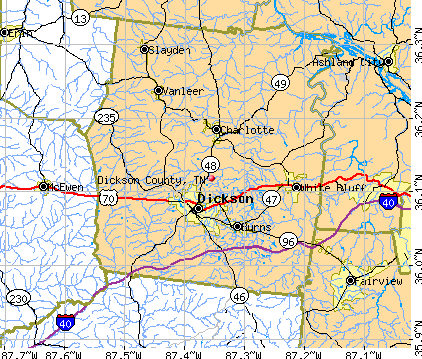
Land area: 490 sq. mi.
Water area: 1.4 sq. mi.
Population density: 113 people per square mile (average).
Industries providing employment: Educational, health and social services (21.8%), Manufacturing (15.8%), Retail trade (14.3%), Construction (10.4%).
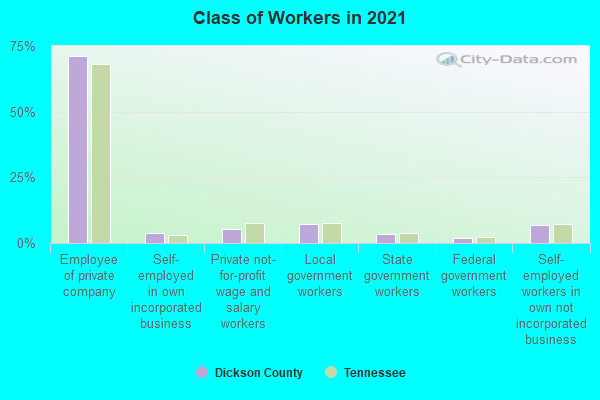
Type of workers:
- Private wage or salary: 80%
- Government: 12%
- Self-employed, not incorporated: 7%
- Unpaid family work: 0%
- OSM Map
- General Map
- Google Map
- MSN Map

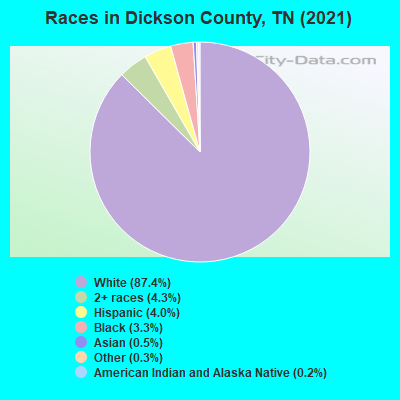
- 48,53587.1%White Non-Hispanic Alone
- 2,4684.4%Hispanic or Latino
- 2,4404.4%Two or more races
- 1,9353.5%Black Non-Hispanic Alone
- 2510.5%Some other race alone
- 760.1%American Indian and Alaska Native alone
- 490.09%Asian alone
| Median resident age: | 39.5 years |
| Tennessee median age: | 39.2 years |
| Males: 27,386 | |
| Females: 28,182 |

 | COVID-19 in Tennessee (237 replies) |
| The Unicorn of Nashville 'Burbs (17 replies) |
| Rental Properties for horses (2 replies) |
| Interstate 840 (37 replies) |
| Tennessee Population Estimates 2016 (28 replies) |
| Kingston Springs, Pegram, Ashland City or Pleasant View? Where to move? (4 replies) |
| Dickson County: | 2.0 people |
| Tennessee: | 2 people |
Estimated median household income in 2022: $69,795 ($39,056 in 1999)
| This county: | $69,795 |
| Tennessee: | $65,254 |
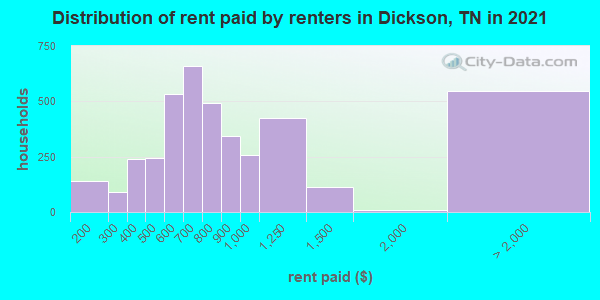
Median contract rent in 2022 for apartments: $794 (lower quartile is $582, upper quartile is $1,031)
| This county: | $794 |
| State: | $884 |
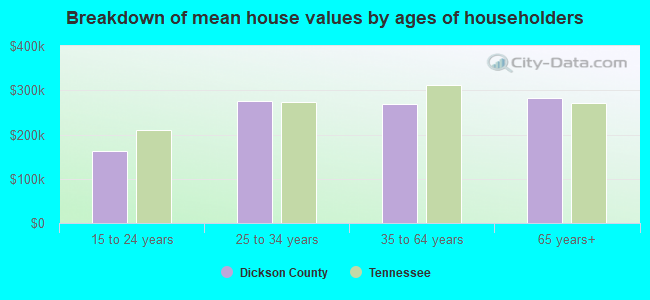
Estimated median house or condo value in 2022: $299,157 (it was $93,900 in 2000)
| Dickson: | $299,157 |
| Tennessee: | $284,800 |
Median monthly housing costs for homes and condos with a mortgage: $1,407
Median monthly housing costs for units without a mortgage: $431
Institutionalized population: 492
Crime in 2021 (reported by the sheriff's office or county police, not the county total):
- Murders: 2
- Rapes: 18
- Robberies: 3
- Assaults: 100
- Burglaries: 70
- Thefts: 127
- Auto thefts: 49
Crime in 2020 (reported by the sheriff's office or county police, not the county total):
- Murders: 0
- Rapes: 15
- Robberies: 3
- Assaults: 97
- Burglaries: 83
- Thefts: 180
- Auto thefts: 50
Health of residents in Dickson County based on CDC Behavioral Risk Factor Surveillance System Survey Questionnaires from 2013 to 2021:
General health status score of residents in this county from 1 (poor) to 5 (excellent) is 3.5. This is about average.69.9% of residents exercised in the past month. This is less than average.
42.1% of residents smoked 100+ cigarettes in their lives. This is about average.
48.0% of adult residents drank alcohol in the past 30 days. This is less than average.
65.5% of residents visited a dentist within the past year. This is less than average.
Average weight of males is 202 pounds. This is more than average.
Average weight of females is 168 pounds. This is more than average.
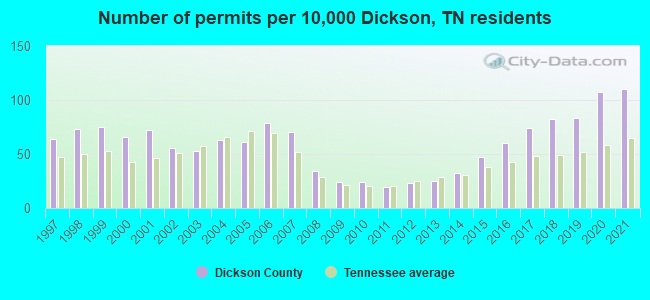
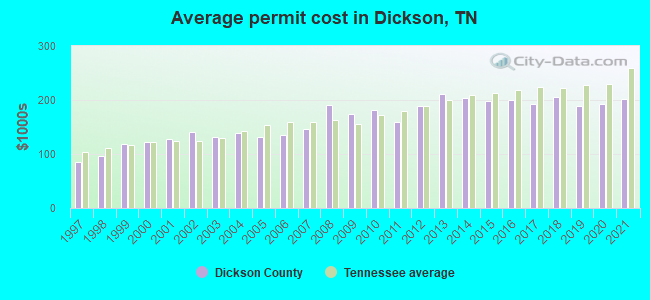
Single-family new house construction building permits:
- 2022: 505 buildings, average cost: $205,800
- 2021: 473 buildings, average cost: $202,000
- 2020: 463 buildings, average cost: $192,700
- 2019: 359 buildings, average cost: $188,200
- 2018: 356 buildings, average cost: $205,100
- 2017: 320 buildings, average cost: $192,800
- 2016: 260 buildings, average cost: $199,900
- 2015: 204 buildings, average cost: $199,000
- 2014: 138 buildings, average cost: $203,500
- 2013: 109 buildings, average cost: $211,300
- 2012: 98 buildings, average cost: $188,400
- 2011: 80 buildings, average cost: $159,100
- 2010: 103 buildings, average cost: $181,600
- 2009: 103 buildings, average cost: $173,500
- 2008: 146 buildings, average cost: $190,900
- 2007: 301 buildings, average cost: $146,000
- 2006: 342 buildings, average cost: $135,800
- 2005: 262 buildings, average cost: $132,000
- 2004: 273 buildings, average cost: $138,200
- 2003: 230 buildings, average cost: $130,900
- 2002: 243 buildings, average cost: $139,800
- 2001: 309 buildings, average cost: $127,300
- 2000: 284 buildings, average cost: $123,200
- 1999: 323 buildings, average cost: $118,800
- 1998: 313 buildings, average cost: $97,200
- 1997: 278 buildings, average cost: $84,500
Median real estate property taxes paid for housing units with mortgages in 2022: $1,425 (0.4%)
Median real estate property taxes paid for housing units with no mortgage in 2022: $1,219 (0.5%)


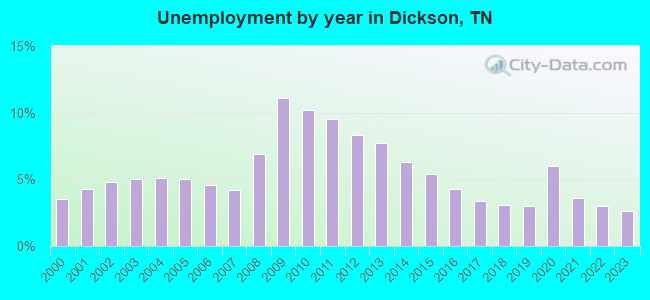
| Dickson County: | 10.3% |
| Tennessee: | 13.3% |
Median age of residents in 2022: 39.5 years old
(Males: 39.0 years old, Females: 39.8 years old)
(Median age for: White residents: 40.8 years old, Black residents: 43.8 years old, American Indian residents: 33.2 years old, Asian residents: 36.0 years old, Hispanic or Latino residents: 22.5 years old, Other race residents: 24.0 years old)
Area name: Nashville-Davidson--Murfreesboro, TN HUD Metro FMR Area
Fair market rent in 2006 for a 1-bedroom apartment in Dickson County is $579 a month.
Fair market rent for a 2-bedroom apartment is $666 a month.
Fair market rent for a 3-bedroom apartment is $864 a month.
Cities in this county include: Dickson, Tennessee City, White Bluff, Burns, Charlotte, Vanleer, Slayden.
Neighboring counties: Bledsoe County  , DeKalb County
  , Fulton County, Arkansas
  , Dare County, North Carolina , Durham County, North Carolina , Johnson County, Arkansas , Ochiltree County, Texas .
| Here: | 2.5% |
| Tennessee: | 3.0% |

Current college students: 1,006
People 25 years of age or older with a high school degree or higher: 88.4%
People 25 years of age or older with a bachelor's degree or higher: 19.3%
Number of foreign born residents: 878 (42.1% naturalized citizens)
| Dickson County: | 1.6% |
| Whole state: | 5.6% |
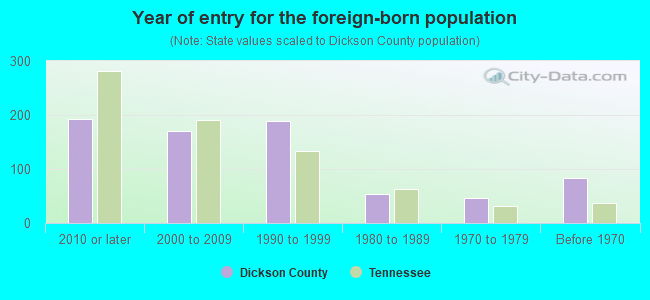
- Year of entry for the foreign-born population
- 3582010 or later
- 792000 to 2009
- 1541990 to 1999
- 531980 to 1989
- 471970 to 1979
- 84Before 1970
Mean travel time to work (commute): ! minutes
Percentage of county residents living and working in this county: 99.1%


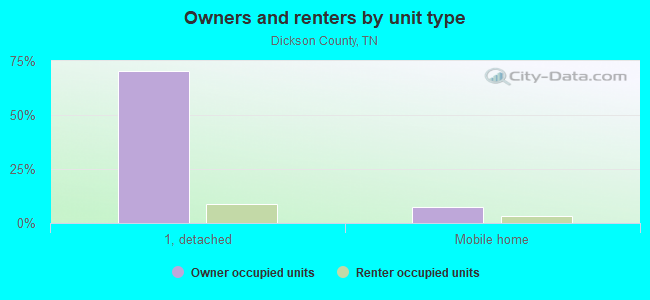
Housing units in structures:
- One, detached: 18,050
- One, attached: 471
- Two: 479
- 3 or 4: 292
- 5 to 9: 655
- 10 to 19: 295
- 20 to 49: 89
- 50 or more: 68
- Mobile homes: 2,849
- Boats, RVs, vans, etc.: 24
Housing units in Dickson County with a mortgage: 9,657 (856 second mortgage, 0 home equity loan, 788 both second mortgage and home equity loan)
Houses without a mortgage: 249
| Here: | 3.5% with mortgage |
| State: | 97.8% with mortgage |
Religion statistics for Dickson County
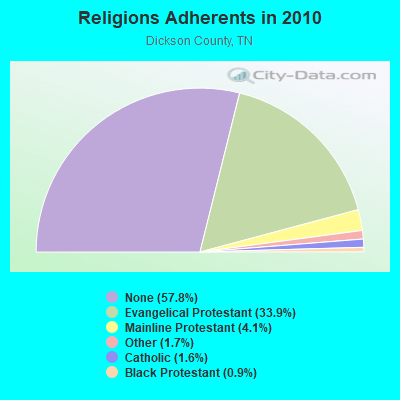
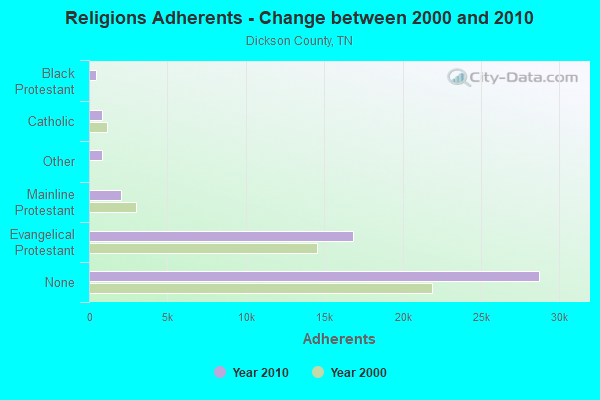
| Religion | Adherents | Congregations |
|---|---|---|
| Evangelical Protestant | 16,818 | 81 |
| Mainline Protestant | 2,051 | 21 |
| Other | 842 | 3 |
| Catholic | 800 | 1 |
| Black Protestant | 433 | 4 |
| None | 28,722 | - |
Source: Clifford Grammich, Kirk Hadaway, Richard Houseal, Dale E.Jones, Alexei Krindatch, Richie Stanley and Richard H.Taylor. 2012. 2010 U.S.Religion Census: Religious Congregations & Membership Study. Association of Statisticians of American Religious Bodies. Jones, Dale E., et al. 2002. Congregations and Membership in the United States 2000. Nashville, TN: Glenmary Research Center.
Food Environment Statistics:
| Dickson County: | 2.11 / 10,000 pop. |
| State: | 1.99 / 10,000 pop. |
| Here: | 0.21 / 10,000 pop. |
| Tennessee: | 0.17 / 10,000 pop. |
| This county: | 0.42 / 10,000 pop. |
| Tennessee: | 0.65 / 10,000 pop. |
| Dickson County: | 5.92 / 10,000 pop. |
| Tennessee: | 5.16 / 10,000 pop. |
| This county: | 8.03 / 10,000 pop. |
| State: | 6.56 / 10,000 pop. |
| Dickson County: | 11.0% |
| Tennessee: | 11.4% |
| Dickson County: | 30.0% |
| State: | 30.2% |
| Here: | 11.0% |
| State: | 13.5% |
Agriculture in Dickson County:
Average size of farms: 109 acresAverage value of agricultural products sold per farm: $8,346
Average value of crops sold per acre for harvested cropland: $135.46
The value of nursery, greenhouse, floriculture, and sod as a percentage of the total market value of agricultural products sold: 1.80%
The value of livestock, poultry, and their products as a percentage of the total market value of agricultural products sold: 63.12%
Average total farm production expenses per farm: $11,391
Harvested cropland as a percentage of land in farms: 20.85%
Irrigated harvested cropland as a percentage of land in farms: 0.12%
Average market value of all machinery and equipment per farm: $31,990
The percentage of farms operated by a family or individual: 96.62%
Average age of principal farm operators: 55 years
Average number of cattle and calves per 100 acres of all land in farms: 16.21
Milk cows as a percentage of all cattle and calves: 0.36%
Corn for grain: 732 harvested acres
All wheat for grain: 262 harvested acres
Soybeans for beans: 256 harvested acres
Vegetables: 36 harvested acres
Land in orchards: 71 acres
Earthquake activity:
Dickson County-area historical earthquake activity is significantly above Tennessee state average. It is 232% greater than the overall U.S. average.On 4/18/2008 at 09:36:59, a magnitude 5.4 (5.1 MB, 4.8 MS, 5.4 MW, 5.2 MW, Class: Moderate, Intensity: VI - VII) earthquake occurred 164.1 miles away from Dickson County center
On 4/18/2008 at 09:36:59, a magnitude 5.2 (5.2 MW, Depth: 8.9 mi) earthquake occurred 164.1 miles away from the county center
On 6/18/2002 at 17:37:15, a magnitude 5.0 (4.3 MB, 4.6 MW, 5.0 LG) earthquake occurred 131.4 miles away from the county center
On 5/4/1991 at 01:18:54, a magnitude 5.0 (4.4 MB, 4.6 LG, 5.0 LG, Depth: 3.1 mi) earthquake occurred 140.9 miles away from the county center
On 9/26/1990 at 13:18:51, a magnitude 5.0 (4.7 MB, 4.8 LG, 5.0 LG, Depth: 7.7 mi) earthquake occurred 141.0 miles away from Dickson County center
On 4/29/2003 at 08:59:39, a magnitude 4.9 (4.4 MB, 4.6 MW, 4.9 LG, Class: Light, Intensity: IV - V) earthquake occurred 148.7 miles away from the county center
Magnitude types: regional Lg-wave magnitude (LG), body-wave magnitude (MB), surface-wave magnitude (MS), moment magnitude (MW)
Most recent natural disasters:
- Tennessee Severe Storms, Straight-line Winds, And Flooding, Incident Period: May 3, 2020 - May 4, 2020, Major Disaster (Presidential) Declared DR-4550-TN: July 9, 2020, FEMA Id: 4550, Natural disaster type: Storm, Flood, Wind
- Tennessee Covid-19 Pandemic, Incident Period: January 20, 2020, FEMA Id: 4514, Natural disaster type: Other
- Tennessee Severe Storms, Flooding, Landslides, And Mudslides, Incident Period: February 19, 2019 - March 30, 2019, FEMA Id: 4427, Natural disaster type: Storm, Mudslide, Landslide, Flood
- Tennessee Severe Winter Storm, Incident Period: March 02, 2014 to March 04, 2014, Major Disaster (Presidential) Declared DR-4171: April 11, 2014, FEMA Id: 4171, Natural disaster type: Winter Storm
- Tennessee Severe Storms, Flooding, Tornadoes, and Straight-Line Winds, Incident Period: April 04, 2011, Major Disaster (Presidential) Declared DR-1978: May 09, 2011, FEMA Id: 1978, Natural disaster type: Storm, Tornado, Flood, Wind
- Tennessee Severe Storms, Flooding, Straight-Line Winds, and Tornadoes, Incident Period: April 30, 2010 to May 18, 2010, Major Disaster (Presidential) Declared DR-1909: May 04, 2010, FEMA Id: 1909, Natural disaster type: Storm, Tornado, Flood, Wind
- Tennessee Severe Storms and Tornadoes, Incident Period: April 02, 2006 to April 08, 2006, Major Disaster (Presidential) Declared DR-1634: April 05, 2006, FEMA Id: 1634, Natural disaster type: Storm, Tornado
- Tennessee Hurricane Katrina Evacuation, Incident Period: August 29, 2005 to October 01, 2005, Emergency Declared EM-3217: September 05, 2005, FEMA Id: 3217, Natural disaster type: Hurricane
- Tennessee Severe Storms, Tornadoes and Flooding, Incident Period: May 04, 2003 to May 30, 2003, Major Disaster (Presidential) Declared DR-1464: May 08, 2003, FEMA Id: 1464, Natural disaster type: Storm, Tornado, Flood
- Tennessee Storms and Flooding, Incident Period: January 23, 2002 to March 20, 2002, Major Disaster (Presidential) Declared DR-1408: April 05, 2002, FEMA Id: 1408, Natural disaster type: Storm, Flood
- 7 other natural disasters have been reported since 1953.
The number of natural disasters in Dickson County (17) is near the US average (15).
Major Disasters (Presidential) Declared: 14
Emergencies Declared: 1
Causes of natural disasters: Storms: 12, Floods: 10, Tornadoes: 8, Winds: 4, Winter Storms: 2, Flash Flood: 1, Hurricane: 1, Ice Storm: 1, Landslide: 1, Mudslide: 1, Other: 1 (Note: some incidents may be assigned to more than one category).
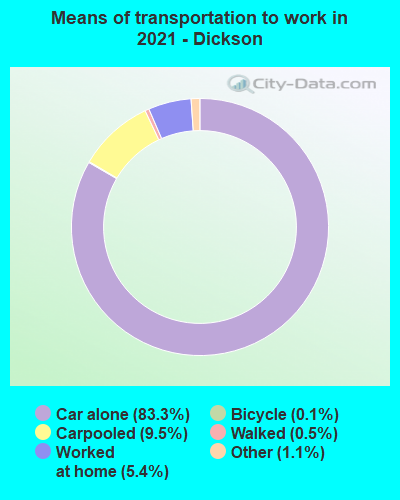
Means of transportation to work:
- Drove a car alone: 16,512 (75.8%)
- Carpooled: 2,058 (9.5%)
- Bus: 109 (0.5%)
- Light rail, streetcar or trolley: 3 (0.0%)
- Taxicab, motorcycle, or other means: 455 (2.1%)
- Bicycle: 53 (0.2%)
- Walked: 131 (0.6%)
- Worked at home: 2,316 (10.6%)
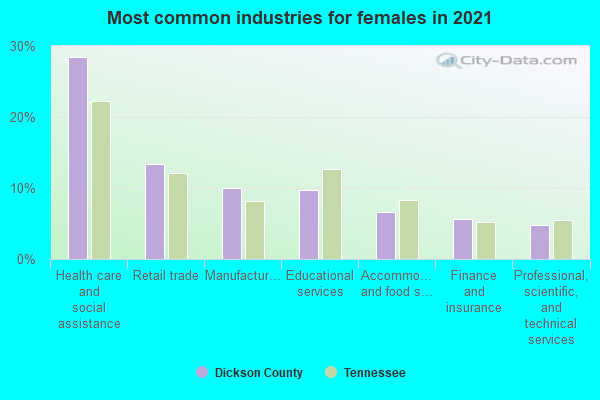
- Health care and social assistance (25%)
- Retail trade (13%)
- Manufacturing (9%)
- Educational services (9%)
- Finance and insurance (5%)
- Professional, scientific, and technical services (5%)
- Accommodation and food services (5%)
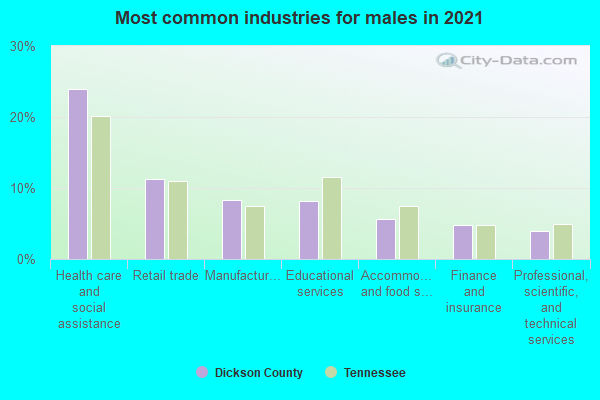
- Health care and social assistance (28%)
- Retail trade (15%)
- Manufacturing (11%)
- Educational services (10%)
- Finance and insurance (6%)
- Professional, scientific, and technical services (5%)
- Accommodation and food services (5%)
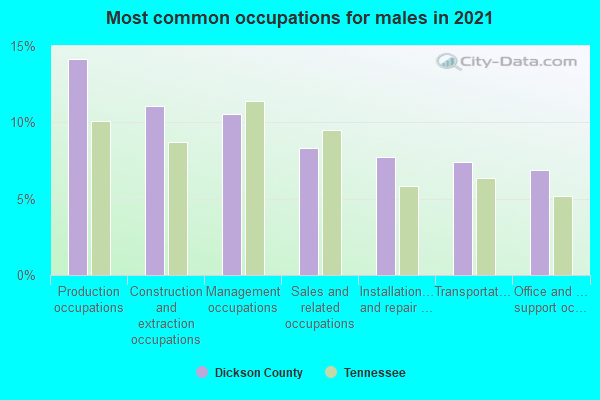
- Production occupations (14%)
- Management occupations (13%)
- Installation, maintenance, and repair occupations (10%)
- Construction and extraction occupations (10%)
- Sales and related occupations (9%)
- Transportation occupations (7%)
- Material moving occupations (6%)

- Office and administrative support occupations (19%)
- Sales and related occupations (13%)
- Management occupations (10%)
- Health diagnosing and treating practitioners and other technical occupations (8%)
- Educational instruction, and library occupations (7%)
- Business and financial operations occupations (7%)
- Production occupations (6%)
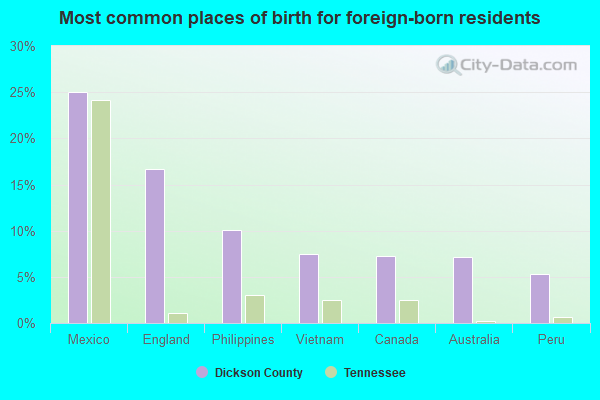
- Mexico (21%)
- England (18%)
- Guatemala (14%)
- Canada (13%)
- Peru (10%)
- Australia (8%)
- El Salvador (4%)
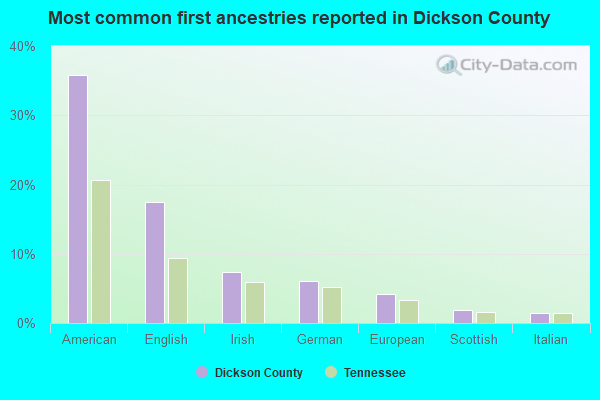
- American (28%)
- English (20%)
- Irish (8%)
- European (6%)
- German (6%)
- Scottish (2%)
- Scotch-Irish (2%)
People in group quarters in Dickson County, Tennessee in 2010:
- 265 people in nursing facilities/skilled-nursing facilities
- 227 people in local jails and other municipal confinement facilities
- 116 people in residential treatment centers for adults
- 9 people in group homes intended for adults
People in group quarters in Dickson County, Tennessee in 2000:
- 260 people in nursing homes
- 164 people in local jails and other confinement facilities (including police lockups)
- 57 people in mental (psychiatric) hospitals or wards
- 20 people in homes for the mentally retarded
- 18 people in other noninstitutional group quarters
- 17 people in homes or halfway houses for drug/alcohol abuse
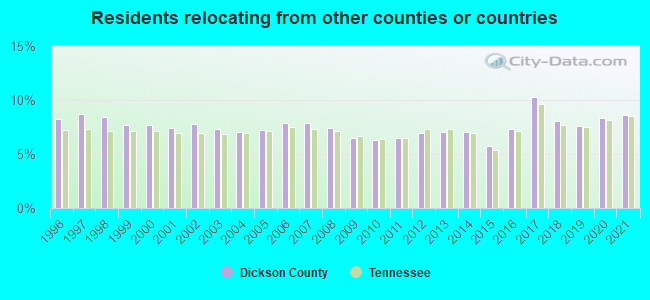
8.62% of this county's 2021 resident taxpayers lived in other counties in 2020 ($62,171 average adjusted gross income)
| Here: | 8.62% |
| Tennessee average: | 8.49% |
10 or fewer of this county's residents moved from foreign countries.
6.08% relocated from other counties in Tennessee ($37,446 average AGI)
2.54% relocated from other states ($24,724 average AGI)
Dickson County: 2.54% Tennessee average: 4.34%
Top counties from which taxpayers relocated into this county between 2020 and 2021:
| from Davidson County, TN | |
| from Hickman County, TN | |
| from Williamson County, TN | |
| from Cheatham County, TN | |
| from Montgomery County, TN | |
| from Humphreys County, TN | |
| from Rutherford County, TN |
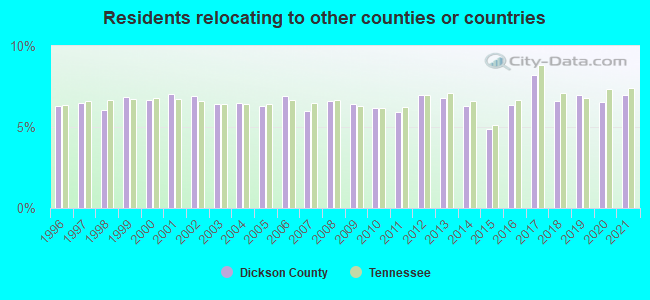
6.99% of this county's 2020 resident taxpayers moved to other counties in 2021 ($50,791 average adjusted gross income)
| Here: | 6.99% |
| Tennessee average: | 7.40% |
10 or fewer of this county's residents moved to foreign countries.
5.17% relocated to other counties in Tennessee ($33,909 average AGI)
1.82% relocated to other states ($16,882 average AGI)
Dickson County: 1.82% Tennessee average: 3.20%
Top counties to which taxpayers relocated from this county between 2020 and 2021:
| to Davidson County, TN | |
| to Hickman County, TN | |
| to Montgomery County, TN | |
| to Humphreys County, TN | |
| to Cheatham County, TN | |
| to Williamson County, TN | |
| to Rutherford County, TN |
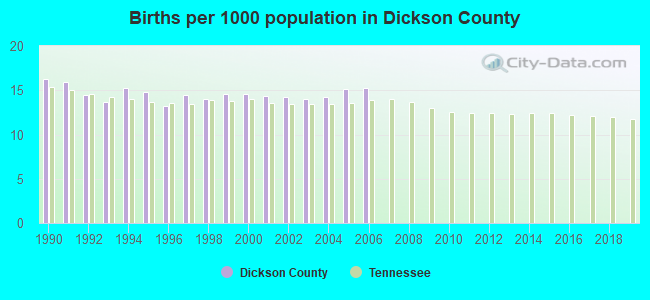
Births per 1000 population from 1990 to 1999: 14.7
Births per 1000 population from 2000 to 2006: 14.5
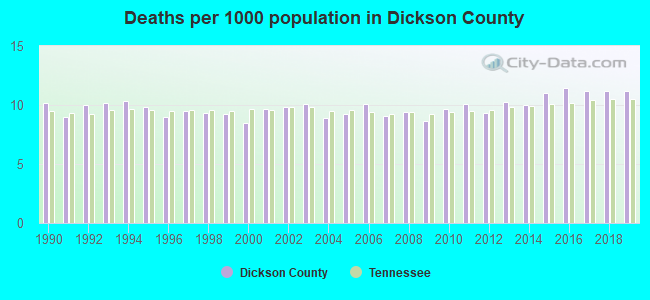
Deaths per 1000 population from 1990 to 1999: 9.7
Deaths per 1000 population from 2000 to 2009: 9.3
Deaths per 1000 population from 2010 to 2020: 10.7
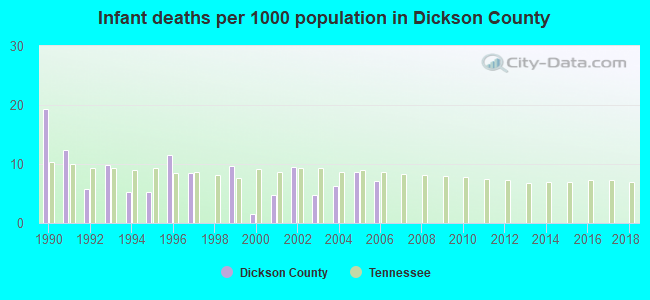
Infant deaths per 1000 live births from 1990 to 1999: 8.7
Infant deaths per 1000 live births from 2000 to 2006: 6.1
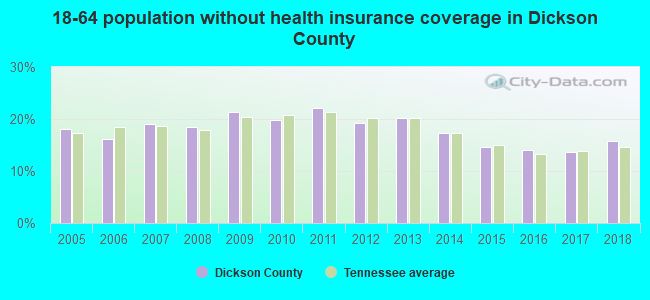
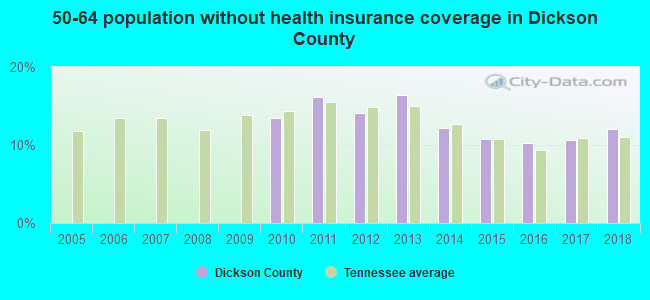
Persons under 19 years old without health insurance coverage in 2018: 4.8%

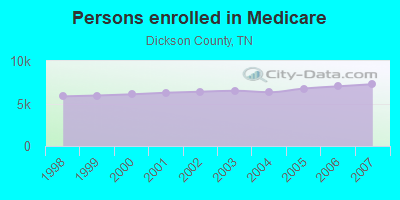
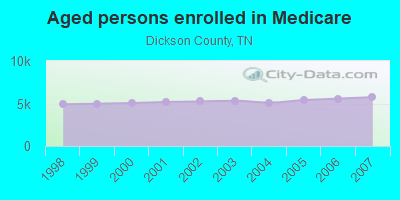
Persons enrolled in hospital insurance and/or supplemental medical insurance (Medicare) in July 1, 2007: 7,273 (5,749 aged, 1,524 disabled)
Children under 18 without health insurance coverage in 2007: 1,023 (8%)

Most common underlying causes of death in Dickson County, Tennessee in 1999 - 2019:
- Bronchus or lung, unspecified - Malignant neoplasms (763)
- Atherosclerotic cardiovascular disease, so described (695)
- Atherosclerotic heart disease (628)
- Acute myocardial infarction, unspecified (612)
- Chronic obstructive pulmonary disease, unspecified (447)
- Pneumonia, unspecified (364)
- Stroke, not specified as haemorrhage or infarction (332)
- Unspecified dementia (251)
- Alzheimer disease, unspecified (157)
- Colon, unspecified - Malignant neoplasms (88)
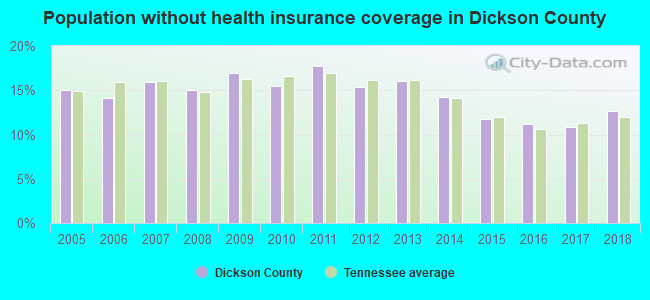
Population without health insurance coverage in 2000: 12%
Children under 18 without health insurance coverage in 2000: 7%
Short term general hospital admissions per 100,000 population in 2004: 9,921
Short term general hospital beds per 100,000 population in 2004: 256
Emergency room visits per 100,000 population in 2004: 69,179
General practice office based MDs per 100,000 population in 2005: 1,427
Medical specialist MDs per 100,000 population in 2005: 928
Dentists per 100,000 population in 1998: 11
Total births per 100,000 population, July 2005 - July 2006 : 33
Total deaths per 100,000 population, July 2005 - July 2006: 70
Limited-service eating places per 100,000 population in 2005 : 7
Suicides per 1,000,000 population from 2000 to 2006: 133.9. This is more than state average.

- Firearm - 92.5
- Other - 41.5
Household type by relationship:
Households: 55,568- Male householders: 10,072 (2,024 living alone), Female householders: 11,256 (2,704 living alone)
11,391 spouses (11,357 opposite-sex spouses), 2,070 unmarried partners, (2,060 opposite-sex unmarried partners), 14,825 children (13,667 natural, 257 adopted, 885 stepchildren), 1,426 grandchildren, 595 brothers or sisters, 582 parents, 51 foster children, 1,299 other relatives, 1,394 non-relatives
- In group quarters: 702
Size of family households: 7,218 2-persons, 3,804 3-persons, 2,303 4-persons, 1,014 5-persons, 420 6-persons, 222 7-or-more-persons.
Size of nonfamily households: 4,735 1-person, 1,408 2-persons, 201 3-persons, 2 5-persons, 15 7-or-more-persons.
7,531 married couples with children.
2,905 single-parent households (759 men, 2,146 women).
97.4% of residents of Dickson speak English at home.
1.9% of residents speak Spanish at home (64% speak English very well, 13% speak English well, 9% speak English not well, 15% don't speak English at all).
0.3% of residents speak other Indo-European language at home (84% speak English very well, 10% speak English well, 6% speak English not well).
0.1% of residents speak Asian or Pacific Island language at home (78% speak English very well, 2% speak English well, 21% speak English not well).
In fiscal year 2004:
Federal Government expenditure: $209,327,000 ($4,617 per capita)
Department of Defense expenditure: $9,868,000
Federal direct payments to individuals for retirement and disability: $105,802,000
Federal other direct payments to individuals: $49,488,000
Federal direct payments not to individuals: $385,000
Federal grants: $43,201,000
Federal procurement contracts: $1,981,000 ($188,000 Department of Defense)
Federal salaries and wages: $8,470,000 ($2,759,000 Department of Defense)
Federal Government direct loans: $2,116,000
Federal guaranteed/insured loans: $32,630,000
Federal Government insurance: $6,664,000
Population change from April 1, 2000 to July 1, 2005:
Births: 3,262| Here: | 71 per 1000 residents |
| State: | 69 per 1000 residents |
Deaths: 2,283
| Here: | 50 per 1000 residents |
| State: | 50 per 1000 residents |
Net international migration: +48
| Here: | +1 per 1000 residents |
| State: | +8 per 1000 residents |
Net internal migration: +1,766
| Here: | +38 per 1000 residents |
| State: | +18 per 1000 residents |
Total withdrawal of fresh water for public supply: 4.28 millions of gallons per day (5% from ground, 95% from surface)
| Here: | 6.2 |
| State: | 6.5 |
| Here: | 4.7 |
| State: | 4.4 |
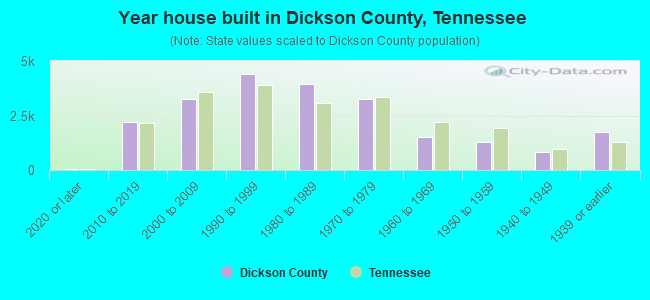
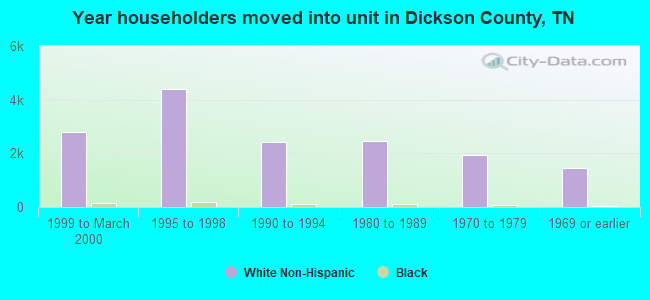
- Year house built in Dickson County, Tennessee
- 2042020 or later
- 2,2882010 to 2019
- 3,8642000 to 2009
- 4,2391990 to 1999
- 3,9001980 to 1989
- 3,2231970 to 1979
- 1,5811960 to 1969
- 1,0471950 to 1959
- 7811940 to 1949
- 1,6981939 or earlier
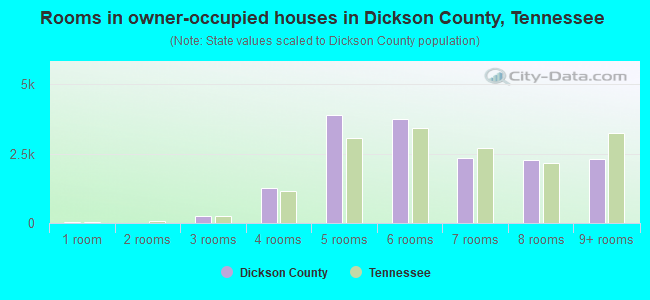
- Rooms in owner-occupied houses in Dickson County, Tennessee
- 111 room
- 92 rooms
- 2613 rooms
- 1,2154 rooms
- 4,1645 rooms
- 3,8516 rooms
- 2,6937 rooms
- 2,4358 rooms
- 2,3469+ rooms
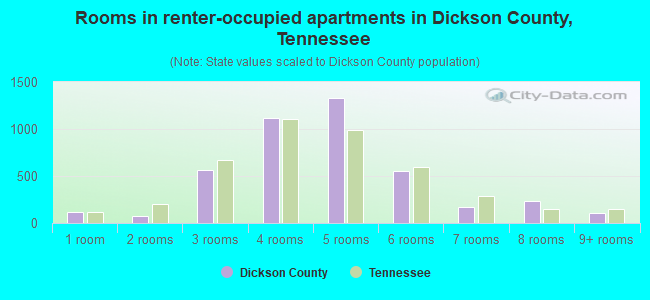
- Rooms in renter-occupied apartments in Dickson County, Tennessee
- 1071 room
- 432 rooms
- 4613 rooms
- 1,1124 rooms
- 1,3325 rooms
- 5016 rooms
- 2127 rooms
- 3548 rooms
- 1139+ rooms
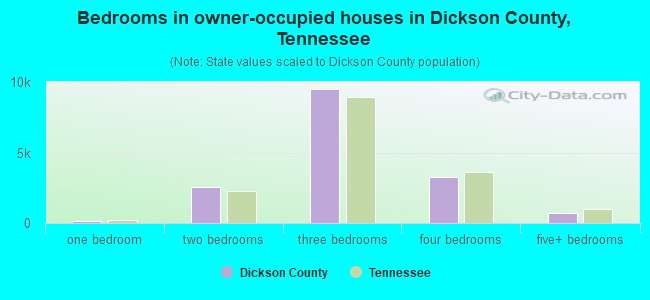
- Bedrooms in owner-occupied houses in Dickson County, Tennessee
- 13no bedroom
- 961 bedroom
- 2,4352 bedrooms
- 10,3963 bedrooms
- 3,3944 bedrooms
- 6945+ bedrooms
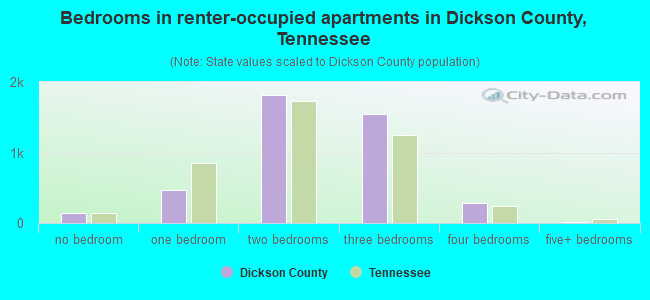
- Bedrooms in renter-occupied apartments in Dickson County, Tennessee
- 127no bedroom
- 3971 bedroom
- 1,9142 bedrooms
- 1,5253 bedrooms
- 2794 bedrooms
- 185+ bedrooms
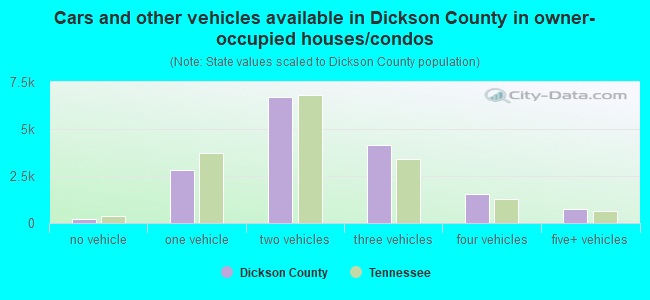
- Cars and other vehicles available in Dickson County in owner-occupied houses/condos
- 220no vehicle
- 2,9521 vehicle
- 7,0842 vehicles
- 4,4713 vehicles
- 1,4474 vehicles
- 8755+ vehicles
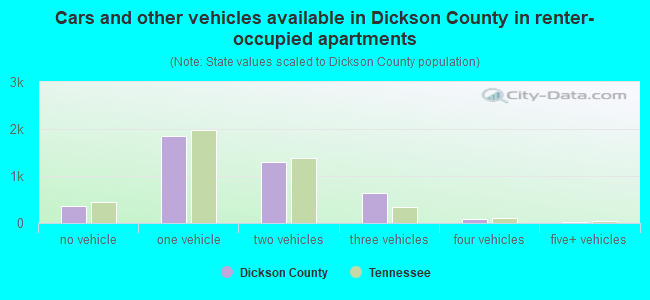
- Cars and other vehicles available in Dickson County in renter-occupied apartments
- 178no vehicle
- 1,9451 vehicle
- 1,3502 vehicles
- 6633 vehicles
- 1244 vehicles
- 575+ vehicles
90.6% of Dickson County residents lived in the same house 1 years ago.
Out of people who lived in different houses, 29% lived in this county.
Out of people who lived in different counties, 61% lived in Tennessee.
| Dickson County: | 90.6% |
| State average: | 87.0% |
Place of birth for U.S.-born residents:
- This state: 36,586
- Other state: 17,496
- Northeast: 2,274
- Midwest: 5,654
- South: 7,084
- West: 2,508
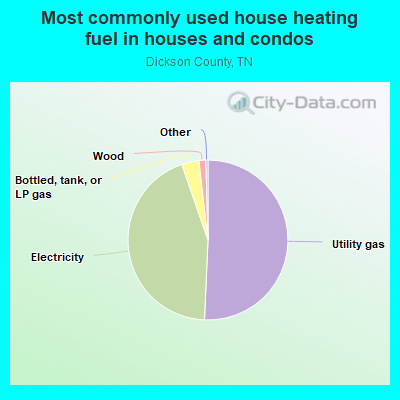
- 50.5%Utility gas
- 43.6%Electricity
- 3.5%Bottled, tank, or LP gas
- 2.0%Wood
- 0.2%Fuel oil, kerosene, etc.
- 0.2%Other fuel
- 0.1%No fuel used
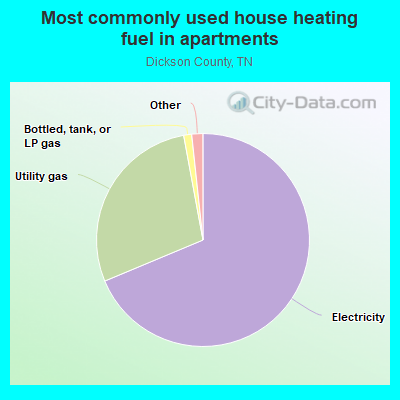
- 69.2%Electricity
- 28.6%Utility gas
- 0.9%No fuel used
- 0.8%Wood
- 0.6%Bottled, tank, or LP gas
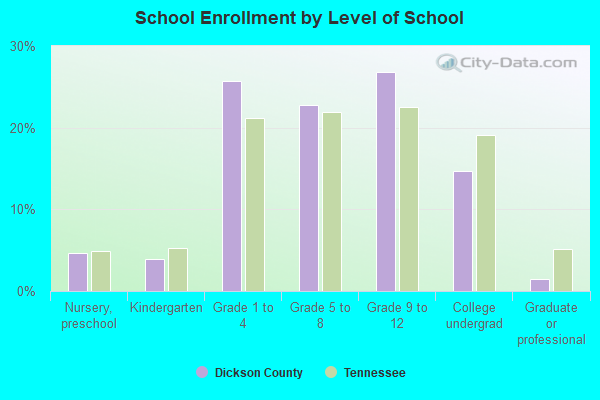
Private vs. public school enrollment:
| Here: | 15.0% |
| Tennessee: | 15.0% |
| Here: | 16.0% |
| Tennessee: | 16.2% |
| Here: | 18.1% |
| Tennessee: | 23.5% |


Dickson County government finances - Expenditure in 2018:
- Assistance and Subsidies - Public Welfare, Cash Assistance Programs - Other: $5,000
- Bond Funds - Cash and Securities: $146,000
- Charges - Other: $2,993,000
Other: $2,762,000
Solid Waste Management: $2,384,000
Elementary and Secondary Education School Lunch: $1,448,000
Elementary and Secondary Education - Other: $1,332,000
Elementary and Secondary Education School Lunch: $1,228,000
Elementary and Secondary Education - Other: $884,000
Miscellaneous Commercial Activities: $109,000
Solid Waste Management: $5,000
- Construction - Elementary and Secondary Education: $1,393,000
General - Other: $1,144,000
Police Protection: $371,000
Parks and Recreation: $329,000
General - Other: $199,000
Judicial and Legal Services: $74,000
Health - Other: $38,000
General Public Buildings: $10,000
Correctional Institutions: $1,000
- Current Operations - Elementary and Secondary Education: $75,127,000
Elementary and Secondary Education: $71,187,000
Judicial and Legal Services: $7,949,000
General - Other: $7,382,000
Correctional Institutions: $6,135,000
Police Protection: $5,864,000
Correctional Institutions: $5,796,000
Police Protection: $5,405,000
General - Other: $4,443,000
Regular Highways: $4,071,000
Solid Waste Management: $3,248,000
Solid Waste Management: $3,220,000
Health - Other: $3,220,000
Judicial and Legal Services: $3,088,000
Regular Highways: $2,777,000
Financial Administration: $2,545,000
Central Staff Services: $1,940,000
Central Staff Services: $974,000
Local Fire Protection: $811,000
General Public Buildings: $705,000
Financial Administration: $686,000
Libraries: $549,000
Libraries: $520,000
General Public Buildings: $376,000
Protective Inspection and Regulation - Other: $308,000
Natural Resources - Other: $259,000
Corrections - Other: $234,000
Natural Resources - Other: $200,000
Air Transportation: $25,000
Public Welfare Institutions: $20,000
Public Welfare, Vendor Payments for Other Purposes: $2,000
- Federal Intergovernmental - Education: $122,000
Education: $115,000
Highways: $66,000
Public Welfare: $50,000
Health and Hospitals: $41,000
Other: $13,000
Housing and Community Development: $2,000
- General - Interest on Debt: $3,510,000
Interest on Debt: $2,262,000
- Intergovernmental to Local - Other - General - Other: $1,066,000
Other - Elementary and Secondary Education: $76,000
Other - Local Fire Protection: $1,000
- Intergovernmental to State - Health - Other: $115,000
- Local Intergovernmental - General Local Government Support: $754,000
Education: $608,000
Education: $414,000
General Local Government Support: $394,000
Highways: $130,000
Other: $51,000
Other: $13,000
- Long Term Debt - Beginning Outstanding - Unspecified Public Purpose: $69,868,000
Outstanding Unspecified Public Purpose: $63,080,000
Beginning Outstanding - Unspecified Public Purpose: $56,547,000
Outstanding Unspecified Public Purpose: $49,054,000
Retired Unspecified Public Purpose: $20,168,000
Issue, Unspecified Public Purpose: $12,675,000
Retired Unspecified Public Purpose: $6,788,000
- Miscellaneous - Donations From Private Sources: $3,342,000
General Revenue - Other: $1,982,000
Interest Earnings: $891,000
General Revenue - Other: $831,000
Sale of Property: $332,000
Fines and Forfeits: $287,000
Fines and Forfeits: $256,000
Interest Earnings: $237,000
Donations From Private Sources: $57,000
Sale of Property: $30,000
Rents: $30,000
- Other Capital Outlay - Elementary and Secondary Education: $4,011,000
Elementary and Secondary Education: $2,353,000
General - Other: $1,208,000
Solid Waste Management: $371,000
Regular Highways: $240,000
Judicial and Legal Services: $31,000
Financial Administration: $22,000
Libraries: $21,000
Correctional Institutions: $7,000
Regular Highways: $7,000
Police Protection: $6,000
General Public Building: $6,000
Central Staff Services: $3,000
Corrections - Other: $1,000
Natural Resources - Other: $1,000
- Other Funds - Cash and Securities: $23,600,000
Cash and Securities: $15,618,000
- Short Term Debt Outstanding - Beginning: $5,194,000
End of Fiscal Year: $1,355,000
- Sinking Funds - Cash and Securities: $3,294,000
- State Intergovernmental - Education: $50,640,000
Education: $50,107,000
Highways: $2,951,000
Other: $2,446,000
Highways: $2,190,000
Other: $1,113,000
Health and Hospitals: $724,000
General Local Government Support: $691,000
Health and Hospitals: $307,000
Housing and Community Development: $265,000
Public Welfare: $90,000
Public Welfare: $76,000
- Tax - Property: $28,010,000
Property: $26,094,000
General Sales and Gross Receipts: $15,843,000
Motor Vehicle License: $3,330,000
Motor Vehicle License: $2,614,000
Other Selective Sales: $1,075,000
Occupation and Business License - Other: $737,000
Occupation and Business License - Other: $522,000
General Sales and Gross Receipts: $446,000
Other License: $354,000
Alcoholic Beverage Sales: $258,000
Alcoholic Beverage Sales: $239,000
Other License: $76,000
Public Utilities Sales: $65,000
Alcoholic Beverage License: $1,000
- Total Salaries and Wages: $50,089,000
: $45,653,000
Dickson County government finances - Revenue in 2018:
- Assistance and Subsidies - Public Welfare, Cash Assistance Programs - Other: $5,000
- Bond Funds - Cash and Securities: $146,000
- Charges - Other: $2,993,000
Other: $2,762,000
Solid Waste Management: $2,384,000
Elementary and Secondary Education School Lunch: $1,448,000
Elementary and Secondary Education - Other: $1,332,000
Elementary and Secondary Education School Lunch: $1,228,000
Elementary and Secondary Education - Other: $884,000
Miscellaneous Commercial Activities: $109,000
Solid Waste Management: $5,000
- Construction - Elementary and Secondary Education: $1,393,000
General - Other: $1,144,000
Police Protection: $371,000
Parks and Recreation: $329,000
General - Other: $199,000
Judicial and Legal Services: $74,000
Health - Other: $38,000
General Public Buildings: $10,000
Correctional Institutions: $1,000
- Current Operations - Elementary and Secondary Education: $75,127,000
Elementary and Secondary Education: $71,187,000
Judicial and Legal Services: $7,949,000
General - Other: $7,382,000
Correctional Institutions: $6,135,000
Police Protection: $5,864,000
Correctional Institutions: $5,796,000
Police Protection: $5,405,000
General - Other: $4,443,000
Regular Highways: $4,071,000
Solid Waste Management: $3,248,000
Solid Waste Management: $3,220,000
Health - Other: $3,220,000
Judicial and Legal Services: $3,088,000
Regular Highways: $2,777,000
Financial Administration: $2,545,000
Central Staff Services: $1,940,000
Central Staff Services: $974,000
Local Fire Protection: $811,000
General Public Buildings: $705,000
Financial Administration: $686,000
Libraries: $549,000
Libraries: $520,000
General Public Buildings: $376,000
Protective Inspection and Regulation - Other: $308,000
Natural Resources - Other: $259,000
Corrections - Other: $234,000
Natural Resources - Other: $200,000
Air Transportation: $25,000
Public Welfare Institutions: $20,000
Public Welfare, Vendor Payments for Other Purposes: $2,000
- Federal Intergovernmental - Education: $122,000
Education: $115,000
Highways: $66,000
Public Welfare: $50,000
Health and Hospitals: $41,000
Other: $13,000
Housing and Community Development: $2,000
- General - Interest on Debt: $3,510,000
Interest on Debt: $2,262,000
- Intergovernmental to Local - Other - General - Other: $1,066,000
Other - Elementary and Secondary Education: $76,000
Other - Local Fire Protection: $1,000
- Intergovernmental to State - Health - Other: $115,000
- Local Intergovernmental - General Local Government Support: $754,000
Education: $608,000
Education: $414,000
General Local Government Support: $394,000
Highways: $130,000
Other: $51,000
Other: $13,000
- Long Term Debt - Beginning Outstanding - Unspecified Public Purpose: $69,868,000
Outstanding Unspecified Public Purpose: $63,080,000
Beginning Outstanding - Unspecified Public Purpose: $56,547,000
Outstanding Unspecified Public Purpose: $49,054,000
Retired Unspecified Public Purpose: $20,168,000
Issue, Unspecified Public Purpose: $12,675,000
Retired Unspecified Public Purpose: $6,788,000
- Miscellaneous - Donations From Private Sources: $3,342,000
General Revenue - Other: $1,982,000
Interest Earnings: $891,000
General Revenue - Other: $831,000
Sale of Property: $332,000
Fines and Forfeits: $287,000
Fines and Forfeits: $256,000
Interest Earnings: $237,000
Donations From Private Sources: $57,000
Sale of Property: $30,000
Rents: $30,000
- Other Capital Outlay - Elementary and Secondary Education: $4,011,000
Elementary and Secondary Education: $2,353,000
General - Other: $1,208,000
Solid Waste Management: $371,000
Regular Highways: $240,000
Judicial and Legal Services: $31,000
Financial Administration: $22,000
Libraries: $21,000
Correctional Institutions: $7,000
Regular Highways: $7,000
Police Protection: $6,000
General Public Building: $6,000
Central Staff Services: $3,000
Corrections - Other: $1,000
Natural Resources - Other: $1,000
- Other Funds - Cash and Securities: $23,600,000
Cash and Securities: $15,618,000
- Short Term Debt Outstanding - Beginning: $5,194,000
End of Fiscal Year: $1,355,000
- Sinking Funds - Cash and Securities: $3,294,000
- State Intergovernmental - Education: $50,640,000
Education: $50,107,000
Highways: $2,951,000
Other: $2,446,000
Highways: $2,190,000
Other: $1,113,000
Health and Hospitals: $724,000
General Local Government Support: $691,000
Health and Hospitals: $307,000
Housing and Community Development: $265,000
Public Welfare: $90,000
Public Welfare: $76,000
- Tax - Property: $28,010,000
Property: $26,094,000
General Sales and Gross Receipts: $15,843,000
Motor Vehicle License: $3,330,000
Motor Vehicle License: $2,614,000
Other Selective Sales: $1,075,000
Occupation and Business License - Other: $737,000
Occupation and Business License - Other: $522,000
General Sales and Gross Receipts: $446,000
Other License: $354,000
Alcoholic Beverage Sales: $258,000
Alcoholic Beverage Sales: $239,000
Other License: $76,000
Public Utilities Sales: $65,000
Alcoholic Beverage License: $1,000
- Total Salaries and Wages: $50,089,000
: $45,653,000
Dickson County government finances - Debt in 2018:
- Assistance and Subsidies - Public Welfare, Cash Assistance Programs - Other: $5,000
- Bond Funds - Cash and Securities: $146,000
- Charges - Other: $2,993,000
Other: $2,762,000
Solid Waste Management: $2,384,000
Elementary and Secondary Education School Lunch: $1,448,000
Elementary and Secondary Education - Other: $1,332,000
Elementary and Secondary Education School Lunch: $1,228,000
Elementary and Secondary Education - Other: $884,000
Miscellaneous Commercial Activities: $109,000
Solid Waste Management: $5,000
- Construction - Elementary and Secondary Education: $1,393,000
General - Other: $1,144,000
Police Protection: $371,000
Parks and Recreation: $329,000
General - Other: $199,000
Judicial and Legal Services: $74,000
Health - Other: $38,000
General Public Buildings: $10,000
Correctional Institutions: $1,000
- Current Operations - Elementary and Secondary Education: $75,127,000
Elementary and Secondary Education: $71,187,000
Judicial and Legal Services: $7,949,000
General - Other: $7,382,000
Correctional Institutions: $6,135,000
Police Protection: $5,864,000
Correctional Institutions: $5,796,000
Police Protection: $5,405,000
General - Other: $4,443,000
Regular Highways: $4,071,000
Solid Waste Management: $3,248,000
Solid Waste Management: $3,220,000
Health - Other: $3,220,000
Judicial and Legal Services: $3,088,000
Regular Highways: $2,777,000
Financial Administration: $2,545,000
Central Staff Services: $1,940,000
Central Staff Services: $974,000
Local Fire Protection: $811,000
General Public Buildings: $705,000
Financial Administration: $686,000
Libraries: $549,000
Libraries: $520,000
General Public Buildings: $376,000
Protective Inspection and Regulation - Other: $308,000
Natural Resources - Other: $259,000
Corrections - Other: $234,000
Natural Resources - Other: $200,000
Air Transportation: $25,000
Public Welfare Institutions: $20,000
Public Welfare, Vendor Payments for Other Purposes: $2,000
- Federal Intergovernmental - Education: $122,000
Education: $115,000
Highways: $66,000
Public Welfare: $50,000
Health and Hospitals: $41,000
Other: $13,000
Housing and Community Development: $2,000
- General - Interest on Debt: $3,510,000
Interest on Debt: $2,262,000
- Intergovernmental to Local - Other - General - Other: $1,066,000
Other - Elementary and Secondary Education: $76,000
Other - Local Fire Protection: $1,000
- Intergovernmental to State - Health - Other: $115,000
- Local Intergovernmental - General Local Government Support: $754,000
Education: $608,000
Education: $414,000
General Local Government Support: $394,000
Highways: $130,000
Other: $51,000
Other: $13,000
- Long Term Debt - Beginning Outstanding - Unspecified Public Purpose: $69,868,000
Outstanding Unspecified Public Purpose: $63,080,000
Beginning Outstanding - Unspecified Public Purpose: $56,547,000
Outstanding Unspecified Public Purpose: $49,054,000
Retired Unspecified Public Purpose: $20,168,000
Issue, Unspecified Public Purpose: $12,675,000
Retired Unspecified Public Purpose: $6,788,000
- Miscellaneous - Donations From Private Sources: $3,342,000
General Revenue - Other: $1,982,000
Interest Earnings: $891,000
General Revenue - Other: $831,000
Sale of Property: $332,000
Fines and Forfeits: $287,000
Fines and Forfeits: $256,000
Interest Earnings: $237,000
Donations From Private Sources: $57,000
Sale of Property: $30,000
Rents: $30,000
- Other Capital Outlay - Elementary and Secondary Education: $4,011,000
Elementary and Secondary Education: $2,353,000
General - Other: $1,208,000
Solid Waste Management: $371,000
Regular Highways: $240,000
Judicial and Legal Services: $31,000
Financial Administration: $22,000
Libraries: $21,000
Correctional Institutions: $7,000
Regular Highways: $7,000
Police Protection: $6,000
General Public Building: $6,000
Central Staff Services: $3,000
Corrections - Other: $1,000
Natural Resources - Other: $1,000
- Other Funds - Cash and Securities: $23,600,000
Cash and Securities: $15,618,000
- Short Term Debt Outstanding - Beginning: $5,194,000
End of Fiscal Year: $1,355,000
- Sinking Funds - Cash and Securities: $3,294,000
- State Intergovernmental - Education: $50,640,000
Education: $50,107,000
Highways: $2,951,000
Other: $2,446,000
Highways: $2,190,000
Other: $1,113,000
Health and Hospitals: $724,000
General Local Government Support: $691,000
Health and Hospitals: $307,000
Housing and Community Development: $265,000
Public Welfare: $90,000
Public Welfare: $76,000
- Tax - Property: $28,010,000
Property: $26,094,000
General Sales and Gross Receipts: $15,843,000
Motor Vehicle License: $3,330,000
Motor Vehicle License: $2,614,000
Other Selective Sales: $1,075,000
Occupation and Business License - Other: $737,000
Occupation and Business License - Other: $522,000
General Sales and Gross Receipts: $446,000
Other License: $354,000
Alcoholic Beverage Sales: $258,000
Alcoholic Beverage Sales: $239,000
Other License: $76,000
Public Utilities Sales: $65,000
Alcoholic Beverage License: $1,000
- Total Salaries and Wages: $50,089,000
: $45,653,000
Dickson County government finances - Cash and Securities in 2018:
- Assistance and Subsidies - Public Welfare, Cash Assistance Programs - Other: $5,000
- Bond Funds - Cash and Securities: $146,000
- Charges - Other: $2,993,000
Other: $2,762,000
Solid Waste Management: $2,384,000
Elementary and Secondary Education School Lunch: $1,448,000
Elementary and Secondary Education - Other: $1,332,000
Elementary and Secondary Education School Lunch: $1,228,000
Elementary and Secondary Education - Other: $884,000
Miscellaneous Commercial Activities: $109,000
Solid Waste Management: $5,000
- Construction - Elementary and Secondary Education: $1,393,000
General - Other: $1,144,000
Police Protection: $371,000
Parks and Recreation: $329,000
General - Other: $199,000
Judicial and Legal Services: $74,000
Health - Other: $38,000
General Public Buildings: $10,000
Correctional Institutions: $1,000
- Current Operations - Elementary and Secondary Education: $75,127,000
Elementary and Secondary Education: $71,187,000
Judicial and Legal Services: $7,949,000
General - Other: $7,382,000
Correctional Institutions: $6,135,000
Police Protection: $5,864,000
Correctional Institutions: $5,796,000
Police Protection: $5,405,000
General - Other: $4,443,000
Regular Highways: $4,071,000
Solid Waste Management: $3,248,000
Solid Waste Management: $3,220,000
Health - Other: $3,220,000
Judicial and Legal Services: $3,088,000
Regular Highways: $2,777,000
Financial Administration: $2,545,000
Central Staff Services: $1,940,000
Central Staff Services: $974,000
Local Fire Protection: $811,000
General Public Buildings: $705,000
Financial Administration: $686,000
Libraries: $549,000
Libraries: $520,000
General Public Buildings: $376,000
Protective Inspection and Regulation - Other: $308,000
Natural Resources - Other: $259,000
Corrections - Other: $234,000
Natural Resources - Other: $200,000
Air Transportation: $25,000
Public Welfare Institutions: $20,000
Public Welfare, Vendor Payments for Other Purposes: $2,000
- Federal Intergovernmental - Education: $122,000
Education: $115,000
Highways: $66,000
Public Welfare: $50,000
Health and Hospitals: $41,000
Other: $13,000
Housing and Community Development: $2,000
- General - Interest on Debt: $3,510,000
Interest on Debt: $2,262,000
- Intergovernmental to Local - Other - General - Other: $1,066,000
Other - Elementary and Secondary Education: $76,000
Other - Local Fire Protection: $1,000
- Intergovernmental to State - Health - Other: $115,000
- Local Intergovernmental - General Local Government Support: $754,000
Education: $608,000
Education: $414,000
General Local Government Support: $394,000
Highways: $130,000
Other: $51,000
Other: $13,000
- Long Term Debt - Beginning Outstanding - Unspecified Public Purpose: $69,868,000
Outstanding Unspecified Public Purpose: $63,080,000
Beginning Outstanding - Unspecified Public Purpose: $56,547,000
Outstanding Unspecified Public Purpose: $49,054,000
Retired Unspecified Public Purpose: $20,168,000
Issue, Unspecified Public Purpose: $12,675,000
Retired Unspecified Public Purpose: $6,788,000
- Miscellaneous - Donations From Private Sources: $3,342,000
General Revenue - Other: $1,982,000
Interest Earnings: $891,000
General Revenue - Other: $831,000
Sale of Property: $332,000
Fines and Forfeits: $287,000
Fines and Forfeits: $256,000
Interest Earnings: $237,000
Donations From Private Sources: $57,000
Sale of Property: $30,000
Rents: $30,000
- Other Capital Outlay - Elementary and Secondary Education: $4,011,000
Elementary and Secondary Education: $2,353,000
General - Other: $1,208,000
Solid Waste Management: $371,000
Regular Highways: $240,000
Judicial and Legal Services: $31,000
Financial Administration: $22,000
Libraries: $21,000
Correctional Institutions: $7,000
Regular Highways: $7,000
Police Protection: $6,000
General Public Building: $6,000
Central Staff Services: $3,000
Corrections - Other: $1,000
Natural Resources - Other: $1,000
- Other Funds - Cash and Securities: $23,600,000
Cash and Securities: $15,618,000
- Short Term Debt Outstanding - Beginning: $5,194,000
End of Fiscal Year: $1,355,000
- Sinking Funds - Cash and Securities: $3,294,000
- State Intergovernmental - Education: $50,640,000
Education: $50,107,000
Highways: $2,951,000
Other: $2,446,000
Highways: $2,190,000
Other: $1,113,000
Health and Hospitals: $724,000
General Local Government Support: $691,000
Health and Hospitals: $307,000
Housing and Community Development: $265,000
Public Welfare: $90,000
Public Welfare: $76,000
- Tax - Property: $28,010,000
Property: $26,094,000
General Sales and Gross Receipts: $15,843,000
Motor Vehicle License: $3,330,000
Motor Vehicle License: $2,614,000
Other Selective Sales: $1,075,000
Occupation and Business License - Other: $737,000
Occupation and Business License - Other: $522,000
General Sales and Gross Receipts: $446,000
Other License: $354,000
Alcoholic Beverage Sales: $258,000
Alcoholic Beverage Sales: $239,000
Other License: $76,000
Public Utilities Sales: $65,000
Alcoholic Beverage License: $1,000
- Total Salaries and Wages: $50,089,000
: $45,653,000
Supplemental Security Income (SSI) in 2006:
- Total number of recipients: 988
- Number of aged recipients: 93
- Number of blind and disabled recipients: 895
- Number of recipients under 18: 140
- Number of recipients between 18 and 64: 645
- Number of recipients older than 64: 203
- Number of recipients also receiving OASDI: 386
- Amount of payments (thousands of dollars): 433
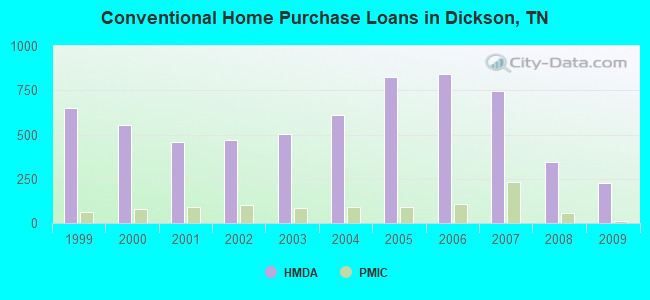
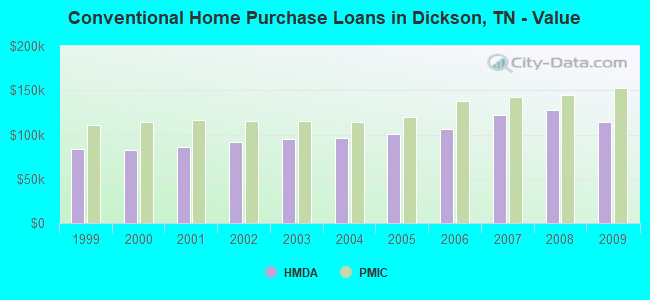
| Home Mortgage Disclosure Act Aggregated Statistics For Year 2009 (Based on 7 full tracts) | ||||||||||||||
| A) FHA, FSA/RHS & VA Home Purchase Loans | B) Conventional Home Purchase Loans | C) Refinancings | D) Home Improvement Loans | E) Loans on Dwellings For 5+ Families | F) Non-occupant Loans on < 5 Family Dwellings (A B C & D) | G) Loans On Manufactured Home Dwelling (A B C & D) | ||||||||
|---|---|---|---|---|---|---|---|---|---|---|---|---|---|---|
| Number | Average Value | Number | Average Value | Number | Average Value | Number | Average Value | Number | Average Value | Number | Average Value | Number | Average Value | |
| LOANS ORIGINATED | 252 | $129,504 | 227 | $113,722 | 880 | $136,651 | 115 | $44,670 | 1 | $1,070,000 | 116 | $80,733 | 90 | $67,211 |
| APPLICATIONS APPROVED, NOT ACCEPTED | 17 | $112,824 | 16 | $118,438 | 90 | $142,711 | 6 | $39,833 | 0 | $0 | 8 | $84,000 | 9 | $90,556 |
| APPLICATIONS DENIED | 37 | $121,324 | 50 | $121,720 | 323 | $143,495 | 47 | $55,340 | 0 | $0 | 16 | $109,875 | 47 | $85,340 |
| APPLICATIONS WITHDRAWN | 22 | $133,909 | 22 | $131,227 | 179 | $140,089 | 13 | $60,231 | 0 | $0 | 6 | $165,167 | 13 | $77,308 |
| FILES CLOSED FOR INCOMPLETENESS | 5 | $145,600 | 3 | $142,000 | 59 | $128,763 | 7 | $122,429 | 0 | $0 | 2 | $83,000 | 5 | $87,000 |
| Private Mortgage Insurance Companies Aggregated Statistics For Year 2009 (Based on 7 full tracts) | ||||||
| A) Conventional Home Purchase Loans | B) Refinancings | C) Non-occupant Loans on < 5 Family Dwellings (A & B) | ||||
|---|---|---|---|---|---|---|
| Number | Average Value | Number | Average Value | Number | Average Value | |
| LOANS ORIGINATED | 14 | $152,286 | 27 | $168,852 | 1 | $214,000 |
| APPLICATIONS APPROVED, NOT ACCEPTED | 9 | $181,111 | 11 | $160,182 | 2 | $276,000 |
| APPLICATIONS DENIED | 3 | $130,000 | 5 | $155,800 | 0 | $0 |
| APPLICATIONS WITHDRAWN | 2 | $100,000 | 3 | $127,667 | 0 | $0 |
| FILES CLOSED FOR INCOMPLETENESS | 1 | $206,000 | 3 | $194,667 | 0 | $0 |
| Most common first names in Dickson County, TN among deceased individuals | ||
| Name | Count | Lived (average) |
|---|---|---|
| James | 378 | 72.4 years |
| William | 344 | 73.5 years |
| Mary | 268 | 78.3 years |
| John | 250 | 73.4 years |
| Robert | 197 | 72.5 years |
| Charles | 118 | 71.2 years |
| George | 114 | 75.6 years |
| Thomas | 99 | 73.8 years |
| Dorothy | 78 | 71.5 years |
| Margaret | 77 | 75.9 years |
| Most common last names in Dickson County, TN among deceased individuals | ||
| Last name | Count | Lived (average) |
|---|---|---|
| Brown | 107 | 74.6 years |
| Williams | 94 | 75.3 years |
| Baker | 85 | 77.4 years |
| Smith | 74 | 75.6 years |
| Jones | 71 | 74.0 years |
| Tidwell | 69 | 73.3 years |
| Donegan | 66 | 77.1 years |
| Hayes | 66 | 77.4 years |
| Johnson | 64 | 76.1 years |
| Duke | 62 | 76.9 years |
| Businesses in Dickson County, TN | ||||
| Name | Count | Name | Count | |
|---|---|---|---|---|
| ALDI | 1 | La-Z-Boy | 1 | |
| AT&T | 1 | Lane Furniture | 1 | |
| Ace Hardware | 1 | Long John Silver's | 1 | |
| Advance Auto Parts | 1 | Lowe's | 1 | |
| Applebee's | 1 | McDonald's | 4 | |
| Arby's | 1 | Motel 6 | 1 | |
| AutoZone | 1 | Nike | 1 | |
| Best Western | 1 | Nissan | 1 | |
| Blockbuster | 1 | Office Depot | 1 | |
| Burger King | 1 | Papa John's Pizza | 1 | |
| CVS | 1 | Payless | 1 | |
| Chevrolet | 1 | Pizza Hut | 1 | |
| Comfort Inn | 1 | Quality | 1 | |
| Cracker Barrel | 1 | Quiznos | 1 | |
| Cricket Wireless | 1 | RadioShack | 1 | |
| Curves | 1 | Rite Aid | 1 | |
| Dairy Queen | 1 | Ruby Tuesday | 1 | |
| Days Inn | 1 | SONIC Drive-In | 2 | |
| Domino's Pizza | 1 | Sears | 1 | |
| Dunkin Donuts | 1 | Subway | 6 | |
| Econo Lodge | 1 | Super 8 | 1 | |
| FedEx | 4 | Taco Bell | 1 | |
| Ford | 1 | The Room Place | 1 | |
| GNC | 1 | True Value | 1 | |
| GameStop | 1 | U-Haul | 3 | |
| Goodwill | 1 | UPS | 8 | |
| H&R Block | 2 | Verizon Wireless | 1 | |
| Hilton | 1 | Waffle House | 2 | |
| Holiday Inn | 1 | Walgreens | 1 | |
| KFC | 1 | Walmart | 1 | |
| Kmart | 1 | Wendy's | 2 | |
| Kroger | 1 | |||