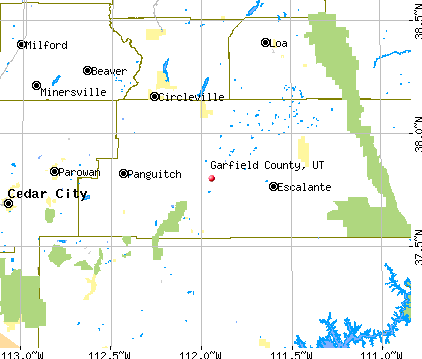
Garfield County, Utah (UT)
County owner-occupied free and clear houses and condos in 2010: 667
County owner-occupied houses and condos in 2000: 1,245
Renter-occupied apartments: 491 (it was 331 in 2000)
| % of renters here: | 21% |
| State: | 30% |
Land area: 5174 sq. mi.
Water area: 34.0 sq. mi.
Population density: 1 people per square mile (very low).
Industries providing employment: Arts, entertainment, recreation, accommodation and food services (38.1%), Educational, health and social services (21.3%).
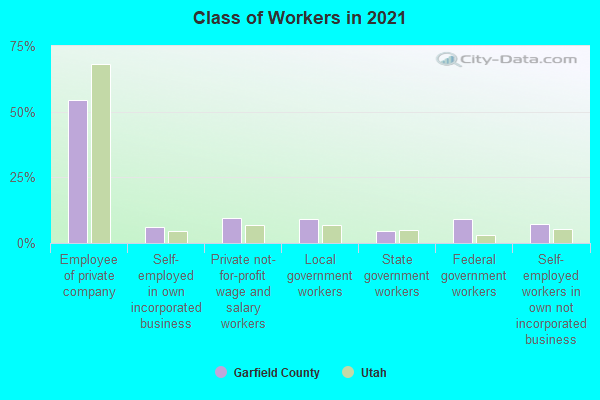
Type of workers:
- Private wage or salary: 75%
- Government: 19%
- Self-employed, not incorporated: 6%
- Unpaid family work: 0%
- OSM Map
- General Map
- Google Map
- MSN Map

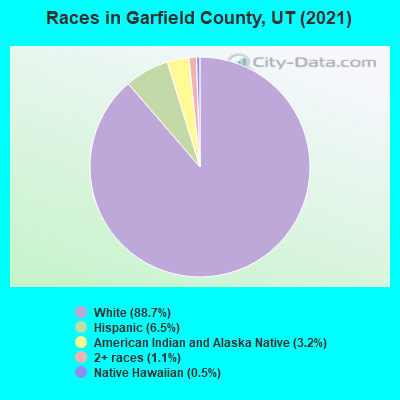
- 4,58587.9%White Non-Hispanic Alone
- 4057.8%Hispanic or Latino
- 1412.7%American Indian and Alaska Native alone
- 541.0%Two or more races
- 270.5%Native Hawaiian and Other
Pacific Islander alone - 20.04%Black Non-Hispanic Alone
| Median resident age: | 41.3 years |
| Utah median age: | 32.1 years |
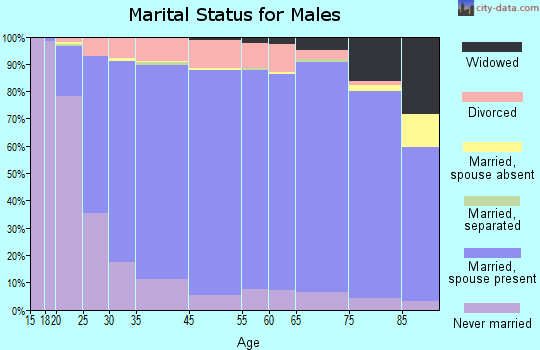
| Males: 2,715 | |
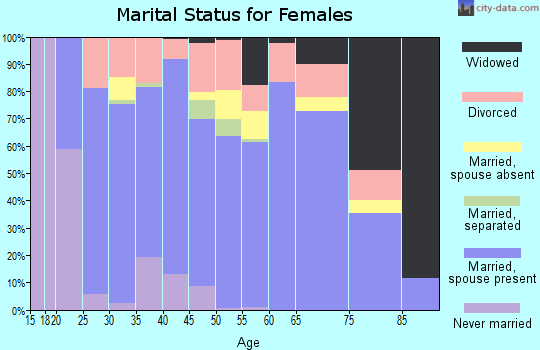
| Females: 2,557 |

| Garfield County: | 2.0 people |
| Utah: | 3 people |
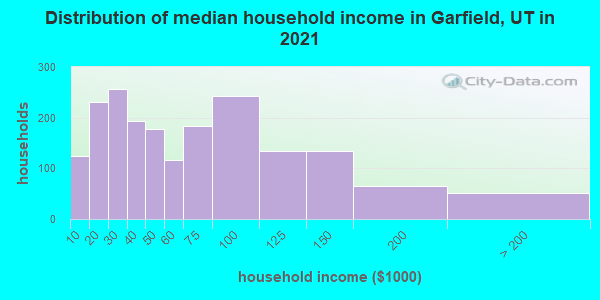
Estimated median household income in 2022: $57,999 ($35,180 in 1999)
| This county: | $57,999 |
| Utah: | $89,168 |
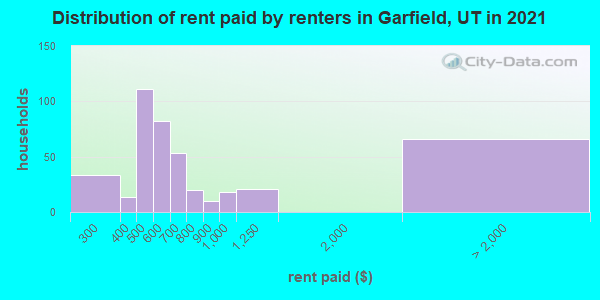
Median contract rent in 2022 for apartments: $686 (lower quartile is $552, upper quartile is $920)
| This county: | $686 |
| State: | $1252 |
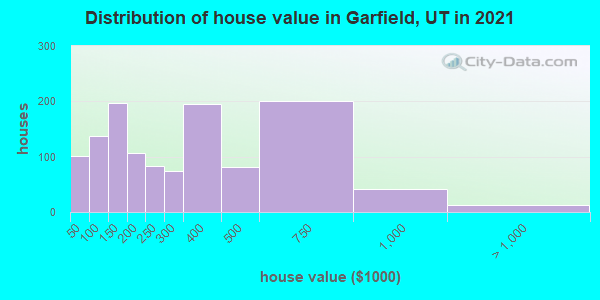
Estimated median house or condo value in 2022: $290,774 (it was $90,400 in 2000)
| Garfield: | $290,774 |
| Utah: | $499,500 |
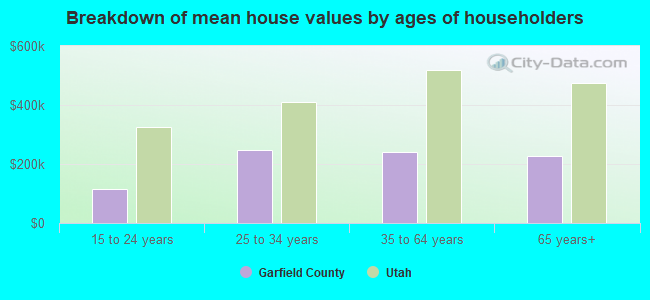
Mean price in 2022:
Median monthly housing costs for homes and condos with a mortgage: $1,470Detached houses: $356,652
Here: $356,652 State: $607,750 Townhouses or other attached units: $583,534
Here: $583,534 State: $444,505 Mobile homes: $109,299
Here: $109,299 State: $113,475 Occupied boats, RVs, vans, etc.: $43,785
Here: $43,785 State: $321,189
Median monthly housing costs for units without a mortgage: $336
Institutionalized population: 171
Crime in 2021 (reported by the sheriff's office or county police, not the county total):
- Murders: 0
- Rapes: 1
- Robberies: 0
- Assaults: 2
- Burglaries: 8
- Thefts: 28
- Auto thefts: 5
Crime in 1999 (reported by the sheriff's office or county police, not the county total):
- Murders: 0
- Rapes: 0
- Robberies: 0
- Assaults: 0
- Burglaries: 2
- Thefts: 5
- Auto thefts: 1
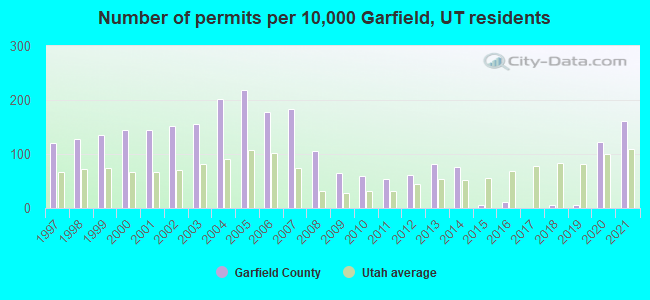
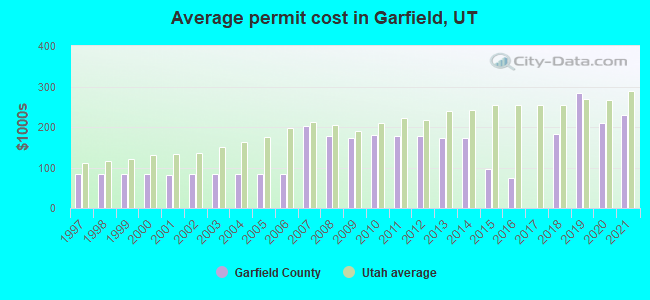
Single-family new house construction building permits:
- 2022: 66 buildings, average cost: $220,200
- 2021: 76 buildings, average cost: $228,600
- 2020: 58 buildings, average cost: $208,800
- 2019: 3 buildings, average cost: $282,800
- 2018: 3 buildings, average cost: $181,500
- 2017: 0 buildings
- 2016: 5 buildings, average cost: $72,700
- 2015: 3 buildings, average cost: $96,300
- 2014: 36 buildings, average cost: $174,100
- 2013: 39 buildings, average cost: $172,700
- 2012: 29 buildings, average cost: $178,900
- 2011: 25 buildings, average cost: $177,500
- 2010: 28 buildings, average cost: $180,300
- 2009: 31 buildings, average cost: $174,400
- 2008: 50 buildings, average cost: $177,400
- 2007: 87 buildings, average cost: $202,600
- 2006: 84 buildings, average cost: $84,500
- 2005: 103 buildings, average cost: $83,200
- 2004: 95 buildings, average cost: $84,600
- 2003: 74 buildings, average cost: $83,200
- 2002: 72 buildings, average cost: $84,400
- 2001: 68 buildings, average cost: $82,400
- 2000: 68 buildings, average cost: $82,800
- 1999: 64 buildings, average cost: $83,000
- 1998: 60 buildings, average cost: $83,200
- 1997: 57 buildings, average cost: $84,500
Median real estate property taxes paid for housing units with mortgages in 2022: $1,132 (0.3%)
Median real estate property taxes paid for housing units with no mortgage in 2022: $917 (0.4%)
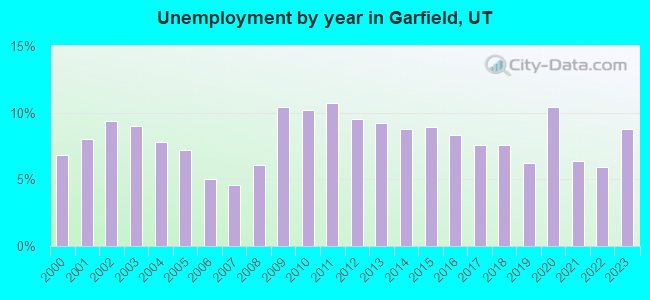
| Garfield County: | 15.3% |
| Utah: | 8.2% |
Median age of residents in 2022: 41.3 years old
(Males: 39.7 years old, Females: 41.8 years old)
(Median age for: White residents: 44.9 years old, Black residents: 28.2 years old, American Indian residents: 35.5 years old, Hispanic or Latino residents: 35.0 years old, Other race residents: 30.7 years old)
Fair market rent in 2006 for a 1-bedroom apartment in Garfield County is $483 a month.
Fair market rent for a 2-bedroom apartment is $591 a month.
Fair market rent for a 3-bedroom apartment is $837 a month.
Cities in this county include: Panguitch, Escalante, Tropic, Bryce Canyon City, Boulder, Henrieville, Cannonville, Hite, Hatch, Antimony.
Neighboring counties: Cape Girardeau County, Missouri  , Logan County, West Virginia , San Joaquin County, California
  , Wyoming County, West Virginia , Perry County, Illinois , Owen County, Kentucky .
| Here: | 9.3% |
| Utah: | 2.5% |
Current college students: 82
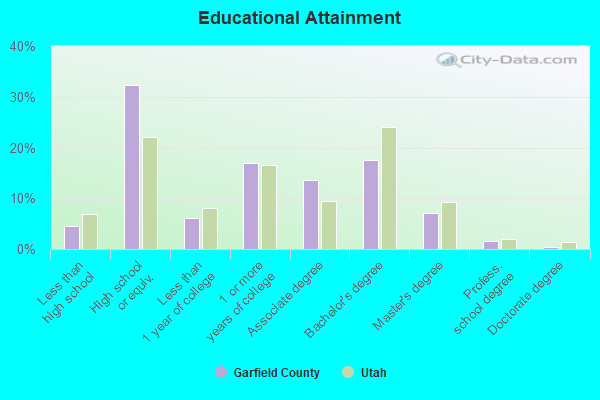
People 25 years of age or older with a high school degree or higher: 95.9%
People 25 years of age or older with a bachelor's degree or higher: 30.3%
Number of foreign born residents: 220 (51.1% naturalized citizens)
| Garfield County: | 4.2% |
| Whole state: | 8.6% |
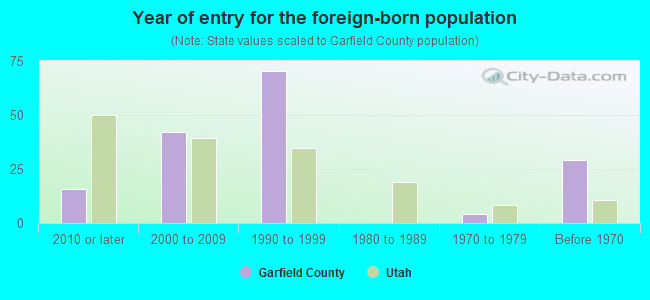
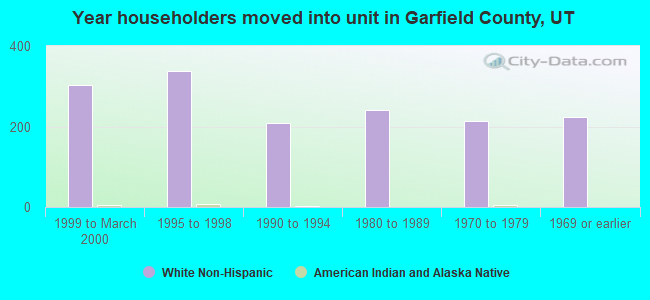
- Year of entry for the foreign-born population
- 102010 or later
- 1572000 to 2009
- 441990 to 1999
- 01980 to 1989
- 41970 to 1979
- 29Before 1970
Mean travel time to work (commute): minutes
Percentage of county residents living and working in this county: 97.5%
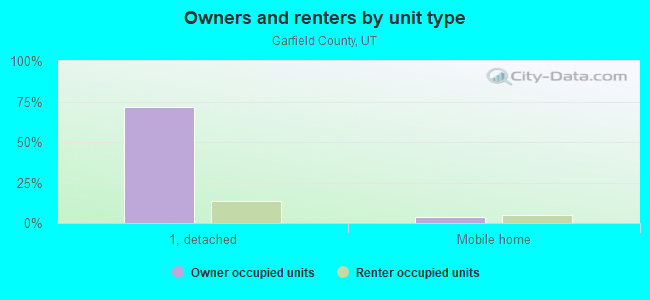
Housing units in structures:
- One, detached: 3,124
- One, attached: 35
- Two: 19
- 3 or 4: 92
- 5 to 9: 3
- 10 to 19: 25
- 20 to 49: 14
- 50 or more: 14
- Mobile homes: 403
Housing units in Garfield County with a mortgage: 682 (45 second mortgage, 0 home equity loan, 50 both second mortgage and home equity loan)
Houses without a mortgage: 19
| Here: | 97.3% with mortgage |
| State: | 97.7% with mortgage |
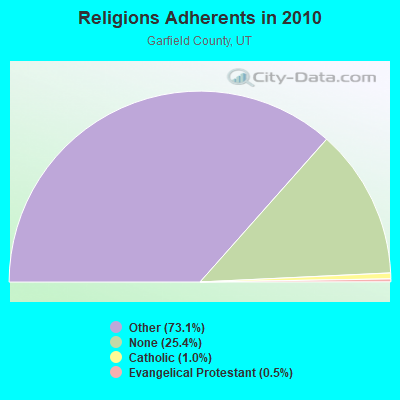
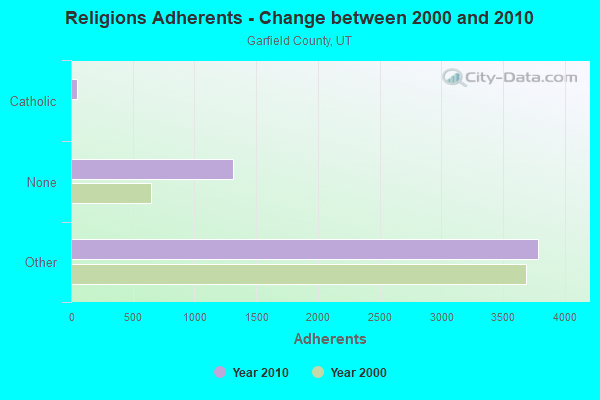
Religion statistics for Garfield County
| Religion | Adherents | Congregations |
|---|---|---|
| Other | 3,781 | 15 |
| Catholic | 50 | 1 |
| Evangelical Protestant | 25 | 1 |
| None | 1,316 | - |
Source: Clifford Grammich, Kirk Hadaway, Richard Houseal, Dale E.Jones, Alexei Krindatch, Richie Stanley and Richard H.Taylor. 2012. 2010 U.S.Religion Census: Religious Congregations & Membership Study. Association of Statisticians of American Religious Bodies. Jones, Dale E., et al. 2002. Congregations and Membership in the United States 2000. Nashville, TN: Glenmary Research Center.
Food Environment Statistics:
| Garfield County: | 2.21 / 10,000 pop. |
| State: | 1.37 / 10,000 pop. |
| This county: | 2.21 / 10,000 pop. |
| Utah: | 0.41 / 10,000 pop. |
| Garfield County: | 17.67 / 10,000 pop. |
| Utah: | 2.82 / 10,000 pop. |
| This county: | 15.46 / 10,000 pop. |
| State: | 5.09 / 10,000 pop. |
| Garfield County: | 8.4% |
| Utah: | 6.3% |
| Garfield County: | 24.2% |
| State: | 23.6% |
Agriculture in Garfield County:
Average size of farms: 355 acresAverage value of agricultural products sold per farm: $26,829
Average value of crops sold per acre for harvested cropland: $57.37
The value of livestock, poultry, and their products as a percentage of the total market value of agricultural products sold: 91.88%
Average total farm production expenses per farm: $29,659
Harvested cropland as a percentage of land in farms: 10.69%
Irrigated harvested cropland as a percentage of land in farms: 98.22%
Average market value of all machinery and equipment per farm: $58,876
The percentage of farms operated by a family or individual: 83.56%
Average age of principal farm operators: 58 years
Average number of cattle and calves per 100 acres of all land in farms: 16.54
Earthquake activity:
Garfield County-area historical earthquake activity is significantly above Utah state average. It is 2995% greater than the overall U.S. average.On 10/3/1915 at 06:52:48, a magnitude 7.6 (7.6 UK, Class: Major, Intensity: VIII - XII) earthquake occurred 351.5 miles away from Garfield County center
On 6/28/1992 at 11:57:34, a magnitude 7.6 (6.2 MB, 7.6 MS, 7.3 MW, Depth: 0.7 mi) earthquake occurred 358.0 miles away from the county center, causing 3 deaths (1 shaking deaths, 2 other deaths) and 400 injuries, causing $100,000,000 total damage and $40,000,000 insured losses
On 10/16/1999 at 09:46:44, a magnitude 7.4 (6.3 MB, 7.4 MS, 7.2 MW, 7.3 ML) earthquake occurred 338.0 miles away from the county center
On 12/21/1932 at 06:10:09, a magnitude 7.2 (7.2 UK) earthquake occurred 337.3 miles away from the county center
On 7/21/1952 at 11:52:14, a magnitude 7.7 (7.7 UK) earthquake occurred 437.5 miles away from Garfield County center, causing $50,000,000 total damage
On 9/2/1992 at 10:26:20, a magnitude 5.9 (5.7 MB, 5.6 MS, 5.6 MW, 5.9 ML, Depth: 9.3 mi, Class: Moderate, Intensity: VI - VII) earthquake occurred 99.2 miles away from the county center
Magnitude types: body-wave magnitude (MB), local magnitude (ML), surface-wave magnitude (MS), moment magnitude (MW)
Most recent natural disasters:
- Utah Covid-19 Pandemic, Incident Period: January 20, 2020, FEMA Id: 4525, Natural disaster type: Other
- Utah Severe Winter Storms and Flooding, Incident Period: December 20, 2010 to December 24, 2010, Major Disaster (Presidential) Declared DR-1955: February 11, 2011, FEMA Id: 1955, Natural disaster type: Winter Storm, Flood
- Utah Hurricane Katrina Evacuation, Incident Period: August 29, 2005 to October 01, 2005, Emergency Declared EM-3223: September 05, 2005, FEMA Id: 3223, Natural disaster type: Hurricane
- Utah SEVERE STORMS, LANDSLIDES, FLOODING, Incident Period: April 13, 1983, Major Disaster (Presidential) Declared DR-680: April 30, 1983, FEMA Id: 680, Natural disaster type: Storm, Landslide, Flood
- Utah Drought, Incident Period: January 20, 1977, Emergency Declared EM-3024: January 20, 1977, FEMA Id: 3024, Natural disaster type: Drought
The number of natural disasters in Garfield County (5) is a lot smaller than the US average (15).
Major Disasters (Presidential) Declared: 2
Emergencies Declared: 2
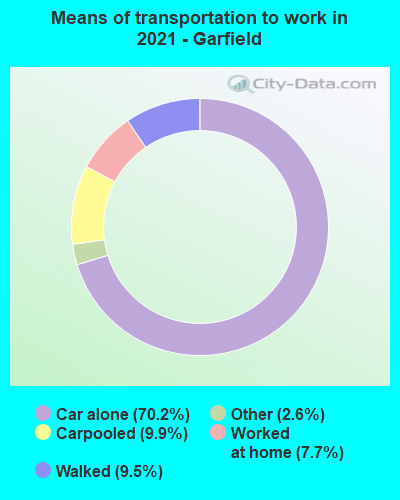
Means of transportation to work:
- Drove a car alone: 1,417 (60.0%)
- Carpooled: 441 (18.7%)
- Taxicab, motorcycle, or other means: 54 (2.3%)
- Walked: 199 (8.4%)
- Worked at home: 197 (8.3%)
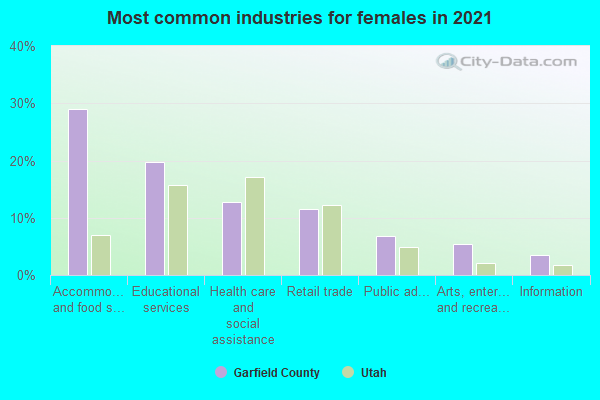
- Accommodation and food services (30%)
- Health care and social assistance (14%)
- Educational services (13%)
- Retail trade (7%)
- Arts, entertainment, and recreation (6%)
- Public administration (3%)
- Information (2%)
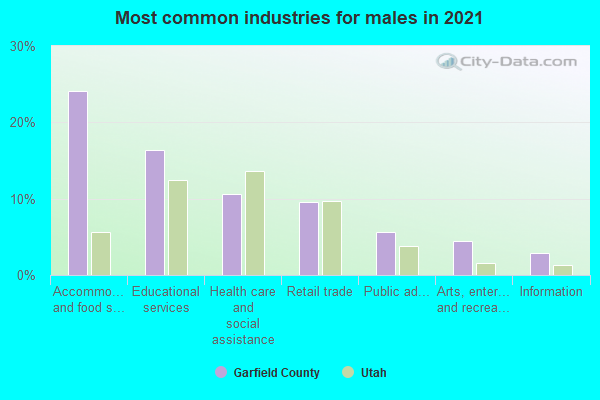
- Accommodation and food services (36%)
- Health care and social assistance (17%)
- Educational services (15%)
- Retail trade (8%)
- Arts, entertainment, and recreation (7%)
- Public administration (4%)
- Information (3%)

- Management occupations (16%)
- Food preparation and serving related occupations (15%)
- Construction and extraction occupations (13%)
- Production occupations (13%)
- Installation, maintenance, and repair occupations (6%)
- Building and grounds cleaning and maintenance occupations (5%)
- Health diagnosing and treating practitioners and other technical occupations (5%)
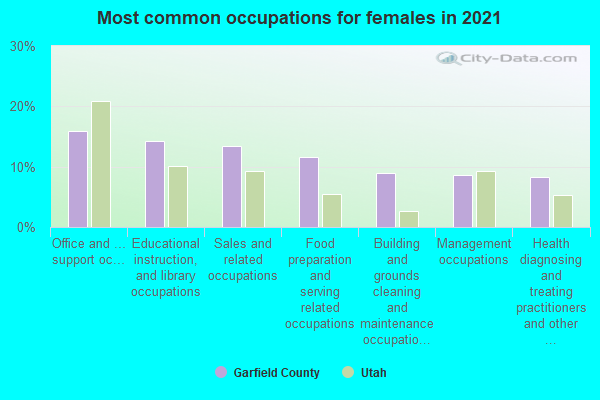
- Food preparation and serving related occupations (18%)
- Management occupations (17%)
- Office and administrative support occupations (13%)
- Educational instruction, and library occupations (11%)
- Health diagnosing and treating practitioners and other technical occupations (9%)
- Sales and related occupations (7%)
- Building and grounds cleaning and maintenance occupations (6%)
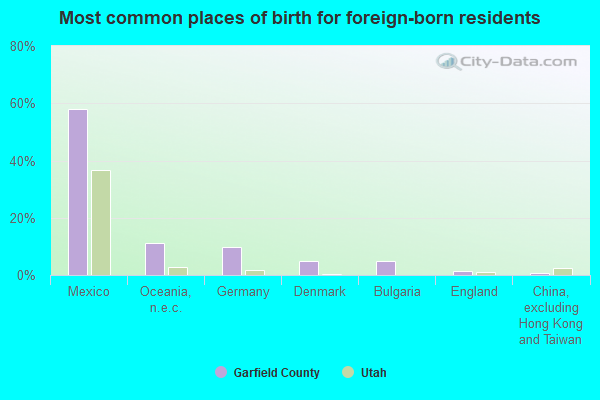
- Other Eastern Asia (96%)
- Mexico (35%)
- Oceania, n.e.c. (7%)
- Germany (2%)
- Bulgaria (2%)
- Denmark (0%)
- Cameroon (0%)
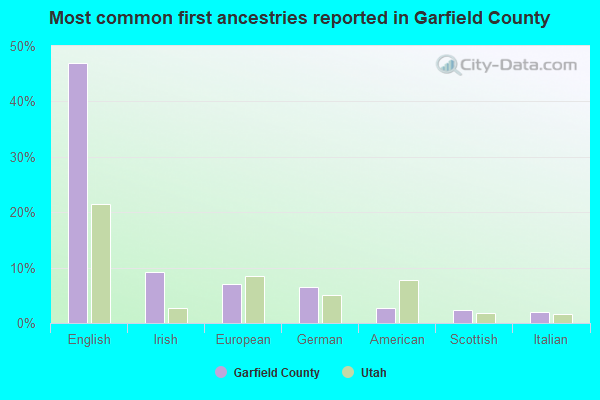
- English (43%)
- European (14%)
- Irish (5%)
- German (5%)
- American (5%)
- Scottish (2%)
- Danish (2%)
People in group quarters in Garfield County, Utah in 2010:
- 89 people in local jails and other municipal confinement facilities
- 47 people in residential treatment centers for juveniles (non-correctional)
- 27 people in nursing facilities/skilled-nursing facilities
- 8 people in correctional residential facilities
People in group quarters in Garfield County, Utah in 2000:
- 94 people in local jails and other confinement facilities (including police lockups)
- 27 people in nursing homes
- 5 people in other workers' dormitories
- 2 people in agriculture workers' dormitories on farms
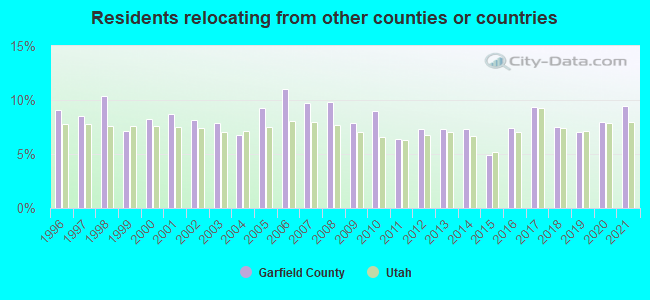
9.44% of this county's 2021 resident taxpayers lived in other counties in 2020 ($65,503 average adjusted gross income)
| Here: | 9.44% |
| Utah average: | 7.95% |
10 or fewer of this county's residents moved from foreign countries.
5.46% relocated from other counties in Utah ($40,012 average AGI)
3.98% relocated from other states ($25,491 average AGI)
Garfield County: 3.98% Utah average: 3.91%
Top counties from which taxpayers relocated into this county between 2020 and 2021:
| from Salt Lake County, UT |
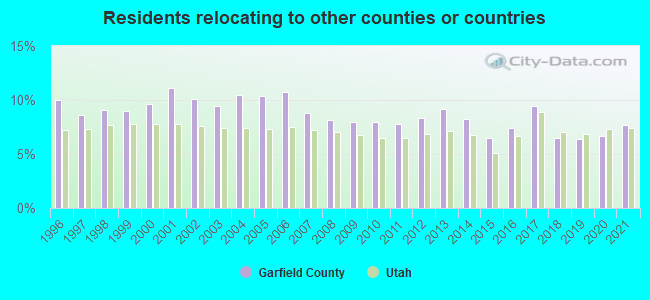
7.73% of this county's 2020 resident taxpayers moved to other counties in 2021 ($47,770 average adjusted gross income)
| Here: | 7.73% |
| Utah average: | 7.39% |
10 or fewer of this county's residents moved to foreign countries.
4.95% relocated to other counties in Utah ($29,842 average AGI)
2.78% relocated to other states ($17,928 average AGI)
Garfield County: 2.78% Utah average: 3.34%
Top counties to which taxpayers relocated from this county between 2020 and 2021:
| to Washington County, UT |
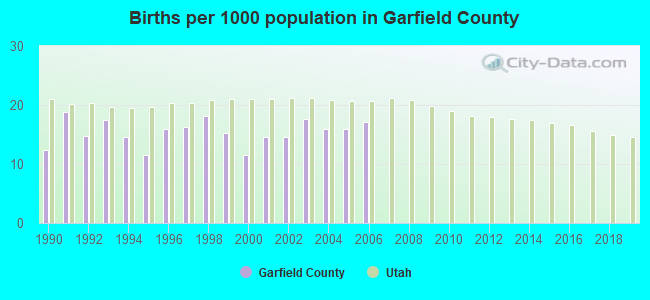
Births per 1000 population from 1990 to 1999: 15.5
Births per 1000 population from 2000 to 2006: 15.3
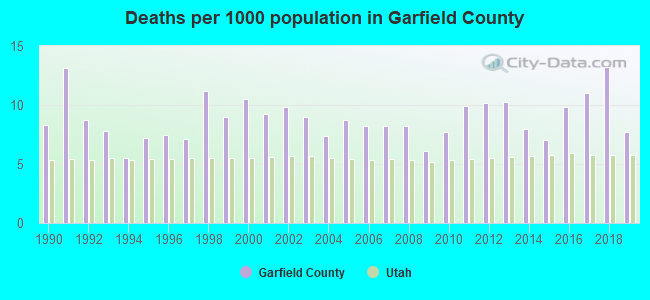
Deaths per 1000 population from 1990 to 1999: 8.5
Deaths per 1000 population from 2000 to 2009: 8.5
Deaths per 1000 population from 2010 to 2020: 9.7
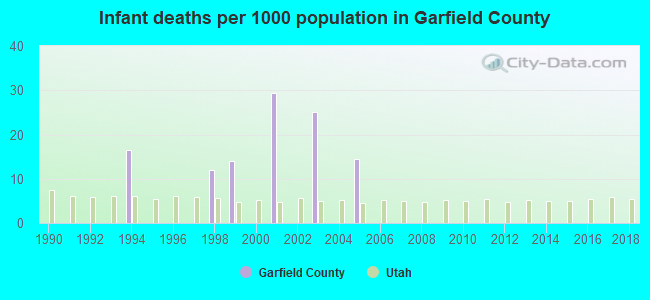
Infant deaths per 1000 live births from 1990 to 1999: 4.2
Infant deaths per 1000 live births from 2000 to 2006: 9.8
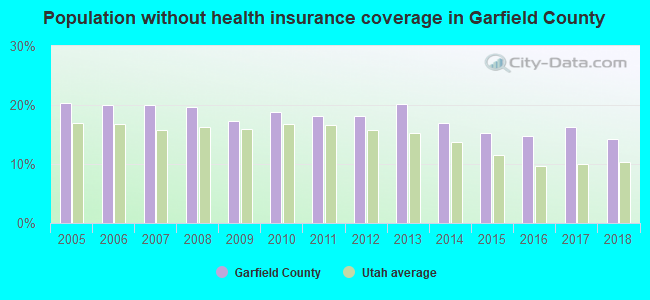
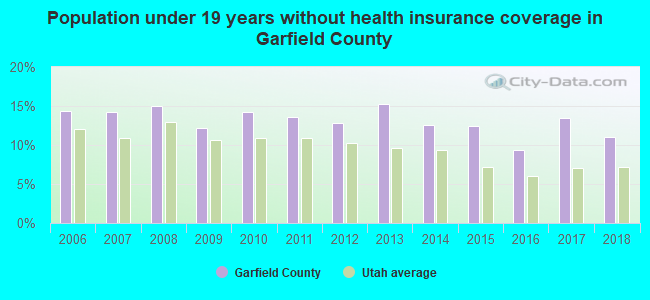
Persons under 19 years old without health insurance coverage in 2018: 11.0%
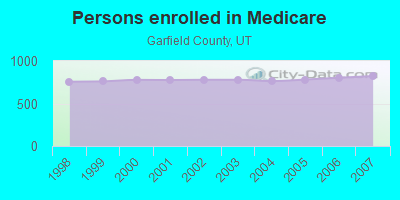
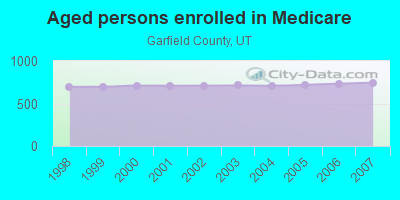
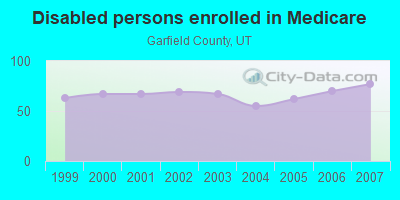
Persons enrolled in hospital insurance and/or supplemental medical insurance (Medicare) in July 1, 2007: 823 (746 aged, 77 disabled)
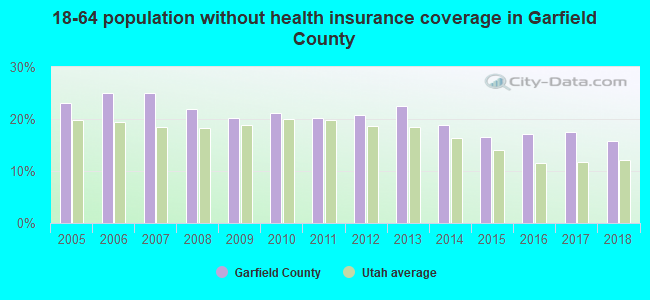
Children under 18 without health insurance coverage in 2007: 126 (10%)
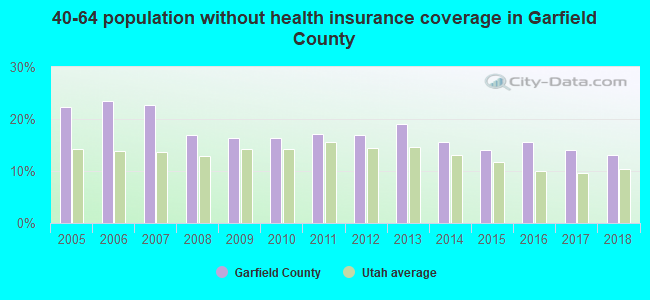
Population without health insurance coverage in 2000: 21%
Children under 18 without health insurance coverage in 2000: 21%
Short term general hospital admissions per 100,000 population in 2004: 9,216
Short term general hospital beds per 100,000 population in 2004: 994
Emergency room visits per 100,000 population in 2004: 43,664
General practice office based MDs per 100,000 population in 2005: 1,902
Medical specialist MDs per 100,000 population in 2005: 559
Dentists per 100,000 population in 1998: 22
Total births per 100,000 population, July 2005 - July 2006 : 47
Total deaths per 100,000 population, July 2005 - July 2006: 179
Household type by relationship:
Households: 5,272- Male householders: 1,035 (265 living alone), Female householders: 1,040 (237 living alone)
1,236 spouses (1,233 opposite-sex spouses), 86 unmarried partners, (83 opposite-sex unmarried partners), 1,290 children (1,226 natural, 31 adopted, 31 stepchildren), 89 grandchildren, 11 brothers or sisters, 100 parents, 0 foster children, 24 other relatives, 62 non-relatives
- In group quarters: 319
Size of family households: 819 2-persons, 222 3-persons, 201 4-persons, 137 5-persons, 55 6-persons, 19 7-or-more-persons.
Size of nonfamily households: 501 1-person, 111 2-persons.
841 married couples with children.
183 single-parent households (41 men, 142 women).
91.4% of residents of Garfield speak English at home.
5.3% of residents speak Spanish at home (87% speak English very well, 6% speak English well, 1% speak English not well, 6% don't speak English at all).
2.7% of residents speak other Indo-European language at home (100% speak English very well).
0.4% of residents speak Asian or Pacific Island language at home (39% speak English very well, 61% speak English not well).
0.1% of residents speak other language at home (100% speak English very well).
In fiscal year 2004:
Federal Government expenditure: $41,463,000 ($9,366 per capita)
Department of Defense expenditure: $335,000
Federal direct payments to individuals for retirement and disability: $11,893,000
Federal other direct payments to individuals: $4,426,000
Federal direct payments not to individuals: $182,000
Federal grants: $6,986,000
Federal procurement contracts: $11,853,000 ($0,000 Department of Defense)
Federal salaries and wages: $6,123,000 ($0,000 Department of Defense)
Federal Government direct loans: $258,000
Federal guaranteed/insured loans: $2,139,000
Federal Government insurance: $1,668,000
Population change from April 1, 2000 to July 1, 2005:
Births: 371| Here: | 83 per 1000 residents |
| State: | 103 per 1000 residents |
Deaths: 229
| Here: | 51 per 1000 residents |
| State: | 28 per 1000 residents |
Net international migration: 0
| Here: | 0 per 1000 residents |
| State: | +20 per 1000 residents |
Net internal migration: -399
| Here: | |
| State: |
Total withdrawal of fresh water for public supply: 1.56 millions of gallons per day (all from ground)
| Here: | 6.5 |
| State: | 7.6 |
| Here: | 4.4 |
| State: | 4.3 |
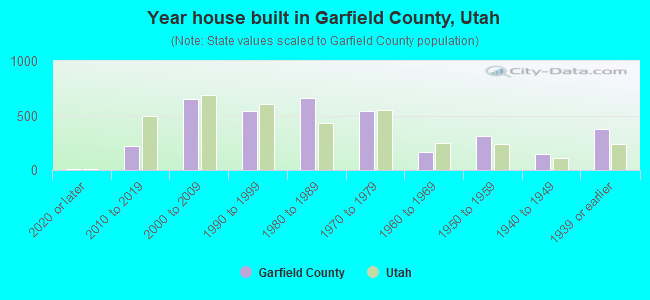
- Year house built in Garfield County, Utah
- 92020 or later
- 2112010 to 2019
- 6132000 to 2009
- 5531990 to 1999
- 6351980 to 1989
- 6041970 to 1979
- 1831960 to 1969
- 3141950 to 1959
- 1461940 to 1949
- 3171939 or earlier
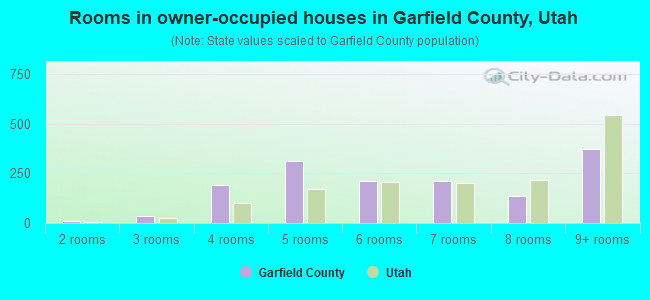
- Rooms in owner-occupied houses in Garfield County, Utah
- 01 room
- 152 rooms
- 403 rooms
- 1334 rooms
- 3345 rooms
- 2396 rooms
- 2257 rooms
- 1338 rooms
- 4119+ rooms
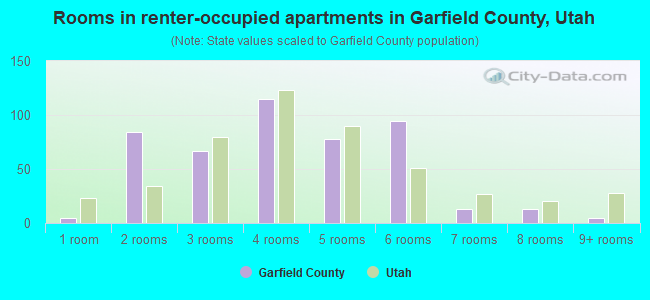
- Rooms in renter-occupied apartments in Garfield County, Utah
- 71 room
- 922 rooms
- 503 rooms
- 1414 rooms
- 895 rooms
- 1496 rooms
- 27 rooms
- 98 rooms
- 159+ rooms

- Bedrooms in owner-occupied houses in Garfield County, Utah
- 9no bedroom
- 281 bedroom
- 2442 bedrooms
- 5743 bedrooms
- 3884 bedrooms
- 2755+ bedrooms
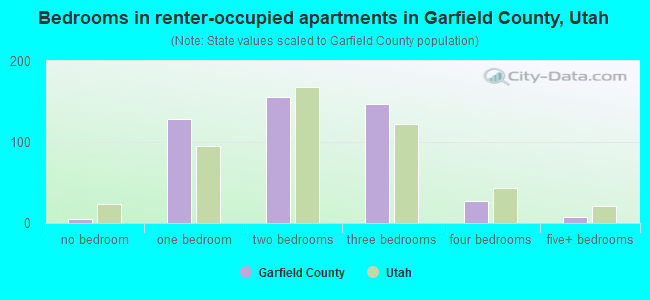
- Bedrooms in renter-occupied apartments in Garfield County, Utah
- 7no bedroom
- 1271 bedroom
- 1082 bedrooms
- 2373 bedrooms
- 554 bedrooms
- 155+ bedrooms
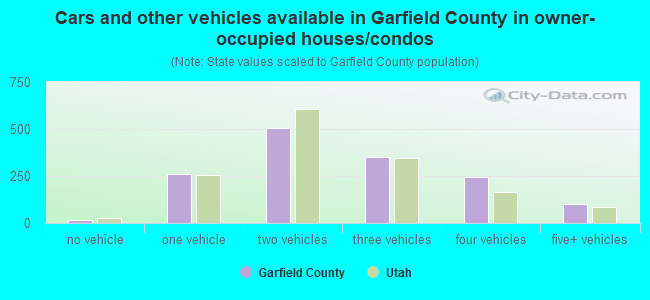
- Cars and other vehicles available in Garfield County in owner-occupied houses/condos
- 30no vehicle
- 2611 vehicle
- 5632 vehicles
- 3303 vehicles
- 2464 vehicles
- 1015+ vehicles
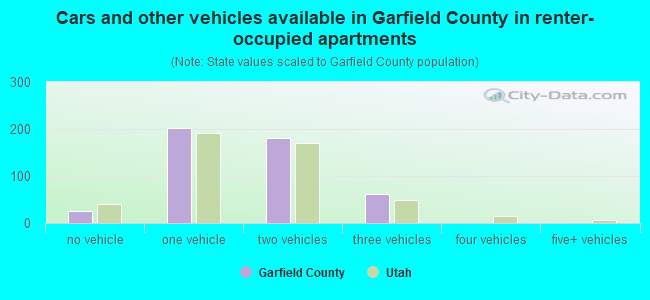
- Cars and other vehicles available in Garfield County in renter-occupied apartments
- 18no vehicle
- 2341 vehicle
- 2142 vehicles
- 843 vehicles
- 04 vehicles
- 05+ vehicles
93.3% of Garfield County residents lived in the same house 1 years ago.
Out of people who lived in different houses, 15% lived in this county.
Out of people who lived in different counties, 77% lived in Utah.
| Garfield County: | 93.3% |
| State average: | 85.7% |
Place of birth for U.S.-born residents:
- This state: 3,345
- Other state: 1,689
- Northeast: 106
- Midwest: 179
- South: 199
- West: 1,199
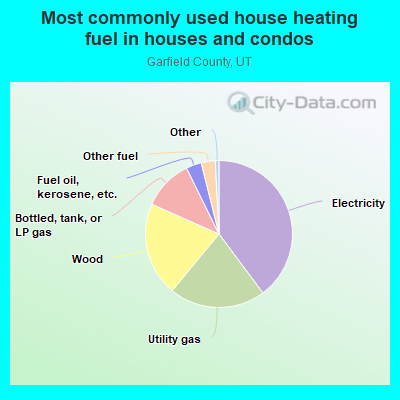
- 39.7%Electricity
- 20.9%Utility gas
- 19.0%Wood
- 11.8%Bottled, tank, or LP gas
- 5.2%Fuel oil, kerosene, etc.
- 2.5%Other fuel
- 0.8%Coal or coke
- 0.2%No fuel used
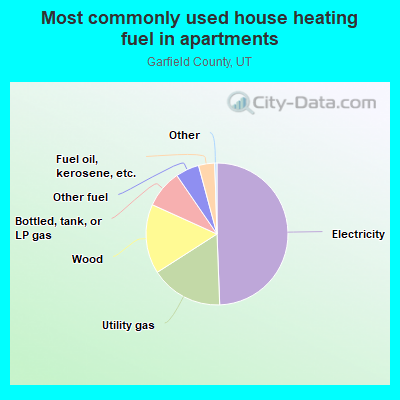
- 47.1%Electricity
- 17.7%Wood
- 13.2%Utility gas
- 9.9%Bottled, tank, or LP gas
- 7.1%Other fuel
- 5.0%Fuel oil, kerosene, etc.
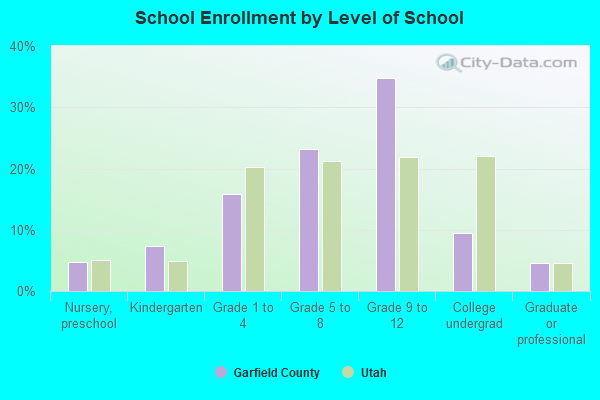
Private vs. public school enrollment:
| Here: | 18.1% |
| Utah: | 7.2% |
| Here: | 9.4% |
| Utah: | 5.3% |
| Here: | 39.7% |
| Utah: | 26.7% |
Garfield County government finances - Expenditure in 2018:
- Bond Funds - Cash and Securities: $1,810,000
Cash and Securities: $1,770,000
- Charges - Other: $3,925,000
Other: $3,659,000
Solid Waste Management: $456,000
Solid Waste Management: $448,000
- Construction - General - Other: $320,000
General - Other: $122,000
Local Fire Protection: $20,000
Water Utilities: $18,000
- Current Operations - Police Protection: $4,294,000
Police Protection: $3,588,000
Regular Highways: $3,022,000
Regular Highways: $2,719,000
Hospitals: $1,600,000
Parks and Recreation: $1,535,000
Parks and Recreation: $1,531,000
Central Staff Services: $961,000
Central Staff Services: $830,000
Financial Administration: $769,000
Health - Other: $616,000
Financial Administration: $602,000
Air Transportation: $583,000
Air Transportation: $558,000
Judicial and Legal Services: $549,000
Judicial and Legal Services: $495,000
Health - Other: $472,000
Public Welfare - Other: $466,000
Solid Waste Management: $376,000
Solid Waste Management: $373,000
Local Fire Protection: $351,000
Public Welfare - Other: $280,000
General Public Buildings: $247,000
Local Fire Protection: $239,000
General Public Buildings: $237,000
Protective Inspection and Regulation - Other: $220,000
General - Other: $190,000
Protective Inspection and Regulation - Other: $181,000
General - Other: $170,000
Hospitals: $71,000
Libraries: $44,000
Libraries: $43,000
Miscellaneous Commercial Activities - Other: $38,000
Miscellaneous Commercial Activities - Other: $31,000
Water Utilities: $18,000
Water Utilities: $4,000
- Federal Intergovernmental - General Local Government Support: $2,073,000
General Local Government Support: $984,000
Other: $11,000
- General - Interest on Debt: $72,000
Interest on Debt: $11,000
- Local Intergovernmental - Other: $810,000
Highways: $93,000
Highways: $64,000
Other: $6,000
- Long Term Debt - Beginning Outstanding - Unspecified Public Purpose: $1,800,000
Outstanding Unspecified Public Purpose: $1,632,000
Beginning Outstanding - Unspecified Public Purpose: $286,000
Retired Unspecified Public Purpose: $169,000
Retired Unspecified Public Purpose: $168,000
Outstanding Unspecified Public Purpose: $117,000
- Miscellaneous - Sale of Property: $1,337,000
Sale of Property: $771,000
Interest Earnings: $459,000
Fines and Forfeits: $300,000
Fines and Forfeits: $245,000
Interest Earnings: $176,000
Rents: $104,000
Rents: $95,000
General Revenue - Other: $76,000
Donations From Private Sources: $41,000
Donations From Private Sources: $22,000
General Revenue - Other: $20,000
- Other Capital Outlay - Regular Highways: $1,069,000
Solid Waste Management: $370,000
Police Protection: $348,000
Regular Highways: $308,000
Police Protection: $278,000
Health - Other: $224,000
General - Other: $151,000
Parks and Recreation: $60,000
Parks and Recreation: $54,000
Public Welfare - Other: $52,000
General - Other: $33,000
General Public Building: $11,000
Public Welfare - Other: $9,000
Water Utilities: $8,000
Health - Other: $7,000
Local Fire Protection: $5,000
General Public Building: $5,000
Central Staff Services: $4,000
Local Fire Protection: $3,000
Air Transportation: $1,000
- Other Funds - Cash and Securities: $14,445,000
Cash and Securities: $13,304,000
- Revenue - Water Utilities: $35,000
Water Utilities: $32,000
- Short Term Debt Outstanding - Beginning: $4,000
End of Fiscal Year: $4,000
Beginning: $1,000
- State Intergovernmental - Highways: $2,135,000
Highways: $1,700,000
General Local Government Support: $916,000
General Local Government Support: $798,000
Other: $450,000
Other: $424,000
- Tax - Other Selective Sales: $4,336,000
Other Selective Sales: $3,855,000
General Sales and Gross Receipts: $722,000
Property: $665,000
General Sales and Gross Receipts: $650,000
Property: $619,000
Occupation and Business License - Other: $341,000
Other: $300,000
Other: $271,000
Occupation and Business License - Other: $120,000
Public Utilities Sales: $42,000
Alcoholic Beverage License: $3,000
Alcoholic Beverage License: $3,000
Other License: $1,000
Other License: $1,000
- Total Salaries and Wages: $4,316,000
: $3,824,000
Garfield County government finances - Revenue in 2018:
- Bond Funds - Cash and Securities: $1,810,000
Cash and Securities: $1,770,000
- Charges - Other: $3,925,000
Other: $3,659,000
Solid Waste Management: $456,000
Solid Waste Management: $448,000
- Construction - General - Other: $320,000
General - Other: $122,000
Local Fire Protection: $20,000
Water Utilities: $18,000
- Current Operations - Police Protection: $4,294,000
Police Protection: $3,588,000
Regular Highways: $3,022,000
Regular Highways: $2,719,000
Hospitals: $1,600,000
Parks and Recreation: $1,535,000
Parks and Recreation: $1,531,000
Central Staff Services: $961,000
Central Staff Services: $830,000
Financial Administration: $769,000
Health - Other: $616,000
Financial Administration: $602,000
Air Transportation: $583,000
Air Transportation: $558,000
Judicial and Legal Services: $549,000
Judicial and Legal Services: $495,000
Health - Other: $472,000
Public Welfare - Other: $466,000
Solid Waste Management: $376,000
Solid Waste Management: $373,000
Local Fire Protection: $351,000
Public Welfare - Other: $280,000
General Public Buildings: $247,000
Local Fire Protection: $239,000
General Public Buildings: $237,000
Protective Inspection and Regulation - Other: $220,000
General - Other: $190,000
Protective Inspection and Regulation - Other: $181,000
General - Other: $170,000
Hospitals: $71,000
Libraries: $44,000
Libraries: $43,000
Miscellaneous Commercial Activities - Other: $38,000
Miscellaneous Commercial Activities - Other: $31,000
Water Utilities: $18,000
Water Utilities: $4,000
- Federal Intergovernmental - General Local Government Support: $2,073,000
General Local Government Support: $984,000
Other: $11,000
- General - Interest on Debt: $72,000
Interest on Debt: $11,000
- Local Intergovernmental - Other: $810,000
Highways: $93,000
Highways: $64,000
Other: $6,000
- Long Term Debt - Beginning Outstanding - Unspecified Public Purpose: $1,800,000
Outstanding Unspecified Public Purpose: $1,632,000
Beginning Outstanding - Unspecified Public Purpose: $286,000
Retired Unspecified Public Purpose: $169,000
Retired Unspecified Public Purpose: $168,000
Outstanding Unspecified Public Purpose: $117,000
- Miscellaneous - Sale of Property: $1,337,000
Sale of Property: $771,000
Interest Earnings: $459,000
Fines and Forfeits: $300,000
Fines and Forfeits: $245,000
Interest Earnings: $176,000
Rents: $104,000
Rents: $95,000
General Revenue - Other: $76,000
Donations From Private Sources: $41,000
Donations From Private Sources: $22,000
General Revenue - Other: $20,000
- Other Capital Outlay - Regular Highways: $1,069,000
Solid Waste Management: $370,000
Police Protection: $348,000
Regular Highways: $308,000
Police Protection: $278,000
Health - Other: $224,000
General - Other: $151,000
Parks and Recreation: $60,000
Parks and Recreation: $54,000
Public Welfare - Other: $52,000
General - Other: $33,000
General Public Building: $11,000
Public Welfare - Other: $9,000
Water Utilities: $8,000
Health - Other: $7,000
Local Fire Protection: $5,000
General Public Building: $5,000
Central Staff Services: $4,000
Local Fire Protection: $3,000
Air Transportation: $1,000
- Other Funds - Cash and Securities: $14,445,000
Cash and Securities: $13,304,000
- Revenue - Water Utilities: $35,000
Water Utilities: $32,000
- Short Term Debt Outstanding - Beginning: $4,000
End of Fiscal Year: $4,000
Beginning: $1,000
- State Intergovernmental - Highways: $2,135,000
Highways: $1,700,000
General Local Government Support: $916,000
General Local Government Support: $798,000
Other: $450,000
Other: $424,000
- Tax - Other Selective Sales: $4,336,000
Other Selective Sales: $3,855,000
General Sales and Gross Receipts: $722,000
Property: $665,000
General Sales and Gross Receipts: $650,000
Property: $619,000
Occupation and Business License - Other: $341,000
Other: $300,000
Other: $271,000
Occupation and Business License - Other: $120,000
Public Utilities Sales: $42,000
Alcoholic Beverage License: $3,000
Alcoholic Beverage License: $3,000
Other License: $1,000
Other License: $1,000
- Total Salaries and Wages: $4,316,000
: $3,824,000
Garfield County government finances - Debt in 2018:
- Bond Funds - Cash and Securities: $1,810,000
Cash and Securities: $1,770,000
- Charges - Other: $3,925,000
Other: $3,659,000
Solid Waste Management: $456,000
Solid Waste Management: $448,000
- Construction - General - Other: $320,000
General - Other: $122,000
Local Fire Protection: $20,000
Water Utilities: $18,000
- Current Operations - Police Protection: $4,294,000
Police Protection: $3,588,000
Regular Highways: $3,022,000
Regular Highways: $2,719,000
Hospitals: $1,600,000
Parks and Recreation: $1,535,000
Parks and Recreation: $1,531,000
Central Staff Services: $961,000
Central Staff Services: $830,000
Financial Administration: $769,000
Health - Other: $616,000
Financial Administration: $602,000
Air Transportation: $583,000
Air Transportation: $558,000
Judicial and Legal Services: $549,000
Judicial and Legal Services: $495,000
Health - Other: $472,000
Public Welfare - Other: $466,000
Solid Waste Management: $376,000
Solid Waste Management: $373,000
Local Fire Protection: $351,000
Public Welfare - Other: $280,000
General Public Buildings: $247,000
Local Fire Protection: $239,000
General Public Buildings: $237,000
Protective Inspection and Regulation - Other: $220,000
General - Other: $190,000
Protective Inspection and Regulation - Other: $181,000
General - Other: $170,000
Hospitals: $71,000
Libraries: $44,000
Libraries: $43,000
Miscellaneous Commercial Activities - Other: $38,000
Miscellaneous Commercial Activities - Other: $31,000
Water Utilities: $18,000
Water Utilities: $4,000
- Federal Intergovernmental - General Local Government Support: $2,073,000
General Local Government Support: $984,000
Other: $11,000
- General - Interest on Debt: $72,000
Interest on Debt: $11,000
- Local Intergovernmental - Other: $810,000
Highways: $93,000
Highways: $64,000
Other: $6,000
- Long Term Debt - Beginning Outstanding - Unspecified Public Purpose: $1,800,000
Outstanding Unspecified Public Purpose: $1,632,000
Beginning Outstanding - Unspecified Public Purpose: $286,000
Retired Unspecified Public Purpose: $169,000
Retired Unspecified Public Purpose: $168,000
Outstanding Unspecified Public Purpose: $117,000
- Miscellaneous - Sale of Property: $1,337,000
Sale of Property: $771,000
Interest Earnings: $459,000
Fines and Forfeits: $300,000
Fines and Forfeits: $245,000
Interest Earnings: $176,000
Rents: $104,000
Rents: $95,000
General Revenue - Other: $76,000
Donations From Private Sources: $41,000
Donations From Private Sources: $22,000
General Revenue - Other: $20,000
- Other Capital Outlay - Regular Highways: $1,069,000
Solid Waste Management: $370,000
Police Protection: $348,000
Regular Highways: $308,000
Police Protection: $278,000
Health - Other: $224,000
General - Other: $151,000
Parks and Recreation: $60,000
Parks and Recreation: $54,000
Public Welfare - Other: $52,000
General - Other: $33,000
General Public Building: $11,000
Public Welfare - Other: $9,000
Water Utilities: $8,000
Health - Other: $7,000
Local Fire Protection: $5,000
General Public Building: $5,000
Central Staff Services: $4,000
Local Fire Protection: $3,000
Air Transportation: $1,000
- Other Funds - Cash and Securities: $14,445,000
Cash and Securities: $13,304,000
- Revenue - Water Utilities: $35,000
Water Utilities: $32,000
- Short Term Debt Outstanding - Beginning: $4,000
End of Fiscal Year: $4,000
Beginning: $1,000
- State Intergovernmental - Highways: $2,135,000
Highways: $1,700,000
General Local Government Support: $916,000
General Local Government Support: $798,000
Other: $450,000
Other: $424,000
- Tax - Other Selective Sales: $4,336,000
Other Selective Sales: $3,855,000
General Sales and Gross Receipts: $722,000
Property: $665,000
General Sales and Gross Receipts: $650,000
Property: $619,000
Occupation and Business License - Other: $341,000
Other: $300,000
Other: $271,000
Occupation and Business License - Other: $120,000
Public Utilities Sales: $42,000
Alcoholic Beverage License: $3,000
Alcoholic Beverage License: $3,000
Other License: $1,000
Other License: $1,000
- Total Salaries and Wages: $4,316,000
: $3,824,000
Garfield County government finances - Cash and Securities in 2018:
- Bond Funds - Cash and Securities: $1,810,000
Cash and Securities: $1,770,000
- Charges - Other: $3,925,000
Other: $3,659,000
Solid Waste Management: $456,000
Solid Waste Management: $448,000
- Construction - General - Other: $320,000
General - Other: $122,000
Local Fire Protection: $20,000
Water Utilities: $18,000
- Current Operations - Police Protection: $4,294,000
Police Protection: $3,588,000
Regular Highways: $3,022,000
Regular Highways: $2,719,000
Hospitals: $1,600,000
Parks and Recreation: $1,535,000
Parks and Recreation: $1,531,000
Central Staff Services: $961,000
Central Staff Services: $830,000
Financial Administration: $769,000
Health - Other: $616,000
Financial Administration: $602,000
Air Transportation: $583,000
Air Transportation: $558,000
Judicial and Legal Services: $549,000
Judicial and Legal Services: $495,000
Health - Other: $472,000
Public Welfare - Other: $466,000
Solid Waste Management: $376,000
Solid Waste Management: $373,000
Local Fire Protection: $351,000
Public Welfare - Other: $280,000
General Public Buildings: $247,000
Local Fire Protection: $239,000
General Public Buildings: $237,000
Protective Inspection and Regulation - Other: $220,000
General - Other: $190,000
Protective Inspection and Regulation - Other: $181,000
General - Other: $170,000
Hospitals: $71,000
Libraries: $44,000
Libraries: $43,000
Miscellaneous Commercial Activities - Other: $38,000
Miscellaneous Commercial Activities - Other: $31,000
Water Utilities: $18,000
Water Utilities: $4,000
- Federal Intergovernmental - General Local Government Support: $2,073,000
General Local Government Support: $984,000
Other: $11,000
- General - Interest on Debt: $72,000
Interest on Debt: $11,000
- Local Intergovernmental - Other: $810,000
Highways: $93,000
Highways: $64,000
Other: $6,000
- Long Term Debt - Beginning Outstanding - Unspecified Public Purpose: $1,800,000
Outstanding Unspecified Public Purpose: $1,632,000
Beginning Outstanding - Unspecified Public Purpose: $286,000
Retired Unspecified Public Purpose: $169,000
Retired Unspecified Public Purpose: $168,000
Outstanding Unspecified Public Purpose: $117,000
- Miscellaneous - Sale of Property: $1,337,000
Sale of Property: $771,000
Interest Earnings: $459,000
Fines and Forfeits: $300,000
Fines and Forfeits: $245,000
Interest Earnings: $176,000
Rents: $104,000
Rents: $95,000
General Revenue - Other: $76,000
Donations From Private Sources: $41,000
Donations From Private Sources: $22,000
General Revenue - Other: $20,000
- Other Capital Outlay - Regular Highways: $1,069,000
Solid Waste Management: $370,000
Police Protection: $348,000
Regular Highways: $308,000
Police Protection: $278,000
Health - Other: $224,000
General - Other: $151,000
Parks and Recreation: $60,000
Parks and Recreation: $54,000
Public Welfare - Other: $52,000
General - Other: $33,000
General Public Building: $11,000
Public Welfare - Other: $9,000
Water Utilities: $8,000
Health - Other: $7,000
Local Fire Protection: $5,000
General Public Building: $5,000
Central Staff Services: $4,000
Local Fire Protection: $3,000
Air Transportation: $1,000
- Other Funds - Cash and Securities: $14,445,000
Cash and Securities: $13,304,000
- Revenue - Water Utilities: $35,000
Water Utilities: $32,000
- Short Term Debt Outstanding - Beginning: $4,000
End of Fiscal Year: $4,000
Beginning: $1,000
- State Intergovernmental - Highways: $2,135,000
Highways: $1,700,000
General Local Government Support: $916,000
General Local Government Support: $798,000
Other: $450,000
Other: $424,000
- Tax - Other Selective Sales: $4,336,000
Other Selective Sales: $3,855,000
General Sales and Gross Receipts: $722,000
Property: $665,000
General Sales and Gross Receipts: $650,000
Property: $619,000
Occupation and Business License - Other: $341,000
Other: $300,000
Other: $271,000
Occupation and Business License - Other: $120,000
Public Utilities Sales: $42,000
Alcoholic Beverage License: $3,000
Alcoholic Beverage License: $3,000
Other License: $1,000
Other License: $1,000
- Total Salaries and Wages: $4,316,000
: $3,824,000
Supplemental Security Income (SSI) in 2006:
- Total number of recipients: 30
- Number of aged recipients: 0
- Number of blind and disabled recipients: 0
- Number of recipients under 18: 7
- Number of recipients between 18 and 64: 19
- Number of recipients older than 64: 4
- Number of recipients also receiving OASDI: 7
- Amount of payments (thousands of dollars): 15
| Most common first names in Garfield County, UT among deceased individuals | ||
| Name | Count | Lived (average) |
|---|---|---|
| William | 22 | 75.8 years |
| James | 19 | 77.0 years |
| John | 18 | 75.5 years |
| Mary | 12 | 86.6 years |
| Robert | 10 | 71.9 years |
| Thomas | 9 | 78.3 years |
| Ruth | 8 | 83.8 years |
| Ray | 7 | 77.1 years |
| Joseph | 7 | 78.3 years |
| George | 6 | 81.2 years |
| Most common last names in Garfield County, UT among deceased individuals | ||
| Last name | Count | Lived (average) |
|---|---|---|
| Griffin | 23 | 78.8 years |
| Hatch | 20 | 77.5 years |
| Spencer | 18 | 78.2 years |
| Henrie | 17 | 81.7 years |
| Alvey | 16 | 80.0 years |
| Pollock | 12 | 80.8 years |
| Porter | 11 | 78.9 years |
| Mecham | 11 | 75.1 years |
| Davis | 10 | 71.8 years |
| Houston | 10 | 77.4 years |
| Businesses in Garfield County, UT | ||||
| Name | Count | Name | Count | |
|---|---|---|---|---|
| Arby's | 1 | True Value | 3 | |
| H&R Block | 1 | U-Haul | 1 | |
| RadioShack | 1 | UPS | 1 | |
| Subway | 2 | |||
Garfield County on our top lists:
- #37 on the list of "Top 101 counties with the highest Ozone (1-hour) air pollution readings in 2012 (ppm)"