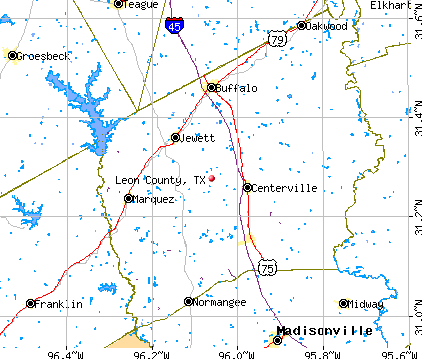
Leon County, Texas (TX)
County owner-occupied free and clear houses and condos in 2010: 3,334
County owner-occupied houses and condos in 2000: 5,125
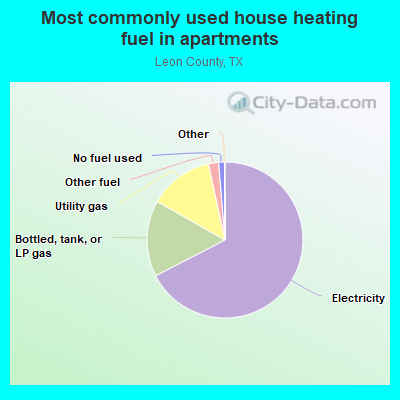
Renter-occupied apartments: 1,293 (it was 1,064 in 2000)
| % of renters here: | 17% |
| State: | 36% |
Land area: 1072 sq. mi.
Water area: 8.3 sq. mi.
Population density: 15 people per square mile (low).
Industries providing employment: Educational, health and social services (14.7%), Professional, scientific, management, administrative, and waste management services (12.3%), Arts, entertainment, recreation, accommodation and food services (12.0%), Agriculture,forestry,fishing and hunting, and mining (11.2%), Retail trade (10.5%).
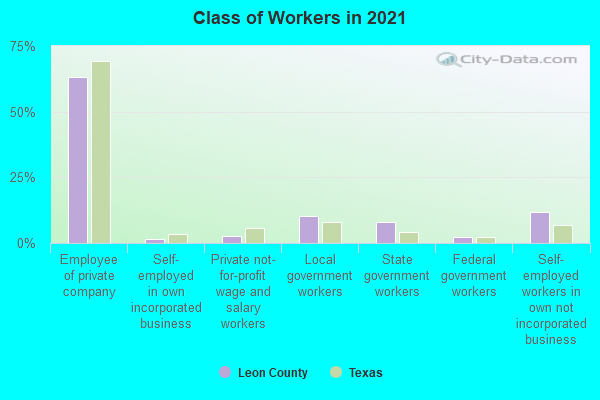
Type of workers:
- Private wage or salary: 74%
- Government: 15%
- Self-employed, not incorporated: 11%
- Unpaid family work: 0%
- OSM Map
- General Map
- Google Map
- MSN Map

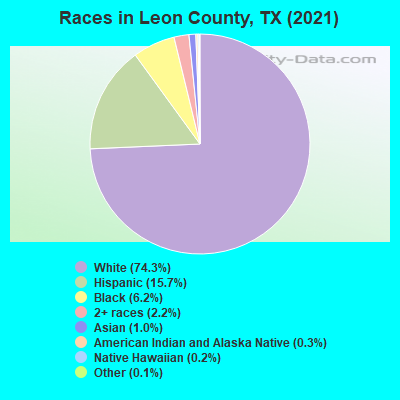
- 11,85873.8%White Non-Hispanic Alone
- 2,57916.1%Hispanic or Latino
- 1,2037.5%Black Non-Hispanic Alone
- 3662.3%Two or more races
- 270.2%American Indian and Alaska Native alone
- 220.1%Asian alone
- 80.05%Some other race alone
| Median resident age: | 45.2 years |
| Texas median age: | 35.6 years |
| Males: 8,132 | |
| Females: 8,224 |

 | Really, Houston?? (419 replies) |
| I've never been so proud of this city (144 replies) |
| Houston-Dallas bullet train clears hurdle with environmental impact statement (13 replies) |
| New County Population Estimates from the Census Bureau for Jluy 1, 2016 posted this morning about 9 A. M. (13 replies) |
| Is East Texas culturally part of the Deep South? (585 replies) |
| Texas Music Thread (199 replies) |
| Leon County: | 2.0 people |
| Texas: | 3 people |
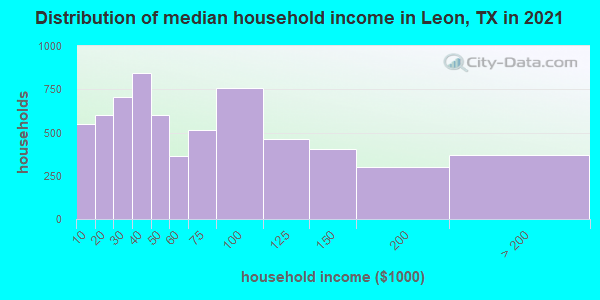
Estimated median household income in 2022: $56,773 ($30,981 in 1999)
| This county: | $56,773 |
| Texas: | $72,284 |
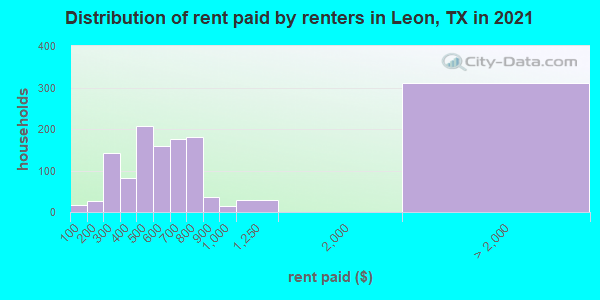
Median contract rent in 2022 for apartments: $639 (lower quartile is $514, upper quartile is $791)
| This county: | $639 |
| State: | $1117 |
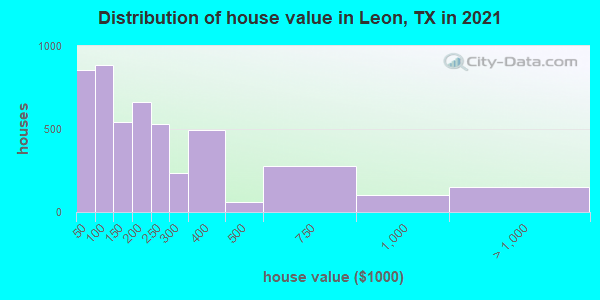
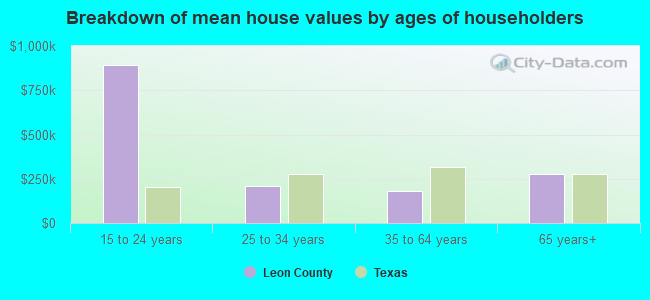
Estimated median house or condo value in 2022: $183,639 (it was $60,800 in 2000)
| Leon: | $183,639 |
| Texas: | $275,400 |
Mean price in 2022:
Median monthly housing costs for homes and condos with a mortgage: $1,220Detached houses: $307,786
Here: $307,786 State: $369,058 Townhouses or other attached units: $361,255
Here: $361,255 State: $327,631 Mobile homes: $119,846
Here: $119,846 State: $124,413
Median monthly housing costs for units without a mortgage: $468
Institutionalized population: 90
Crime in 2021 (reported by the sheriff's office or county police, not the county total):
- Murders: 0
- Rapes: 1
- Robberies: 0
- Assaults: 13
- Burglaries: 36
- Thefts: 58
- Auto thefts: 11
Crime in 2020 (reported by the sheriff's office or county police, not the county total):
- Murders: 0
- Rapes: 1
- Robberies: 0
- Assaults: 3
- Burglaries: 41
- Thefts: 66
- Auto thefts: 4

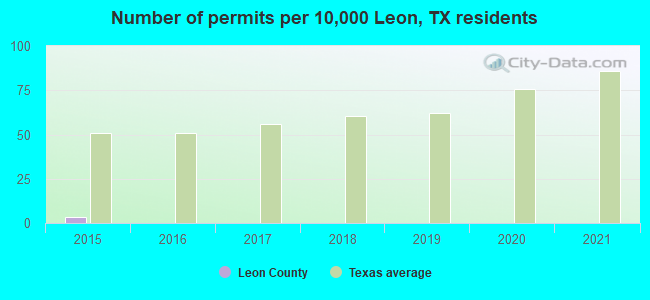
Single-family new house construction building permits:
- 2022: 0 buildings
- 2021: 0 buildings
- 2020: 0 buildings
- 2019: 0 buildings
- 2018: 0 buildings
- 2017: 0 buildings
- 2016: 0 buildings
- 2015: 5 buildings, average cost: $160,000

Median real estate property taxes paid for housing units with mortgages in 2022: $1,526 (0.8%)
Median real estate property taxes paid for housing units with no mortgage in 2022: $913 (0.5%)
| Leon County: | 14.4% |
| Texas: | 14.0% |
Median age of residents in 2022: 45.2 years old
(Males: 44.6 years old, Females: 46.3 years old)
(Median age for: White residents: 49.4 years old, Black residents: 43.1 years old, American Indian residents: 44.5 years old, Asian residents: 65.5 years old, Hispanic or Latino residents: 28.0 years old, Other race residents: 26.7 years old)
Fair market rent in 2006 for a 1-bedroom apartment in Leon County is $471 a month.
Fair market rent for a 2-bedroom apartment is $525 a month.
Fair market rent for a 3-bedroom apartment is $684 a month.
Cities in this county include: Buffalo, Hilltop Lakes, Centerville, Jewett, Normangee, Oakwood, Marquez, Leona.
Notable locations in this county outside city limits:
Notable locations in Leon County: Harvey Creek Recreation Site (A), San Augustine Park Campground (B), Powell Park (C), Bayou Boat Launch (D), Rayburn Park Campground (E), Powell Park Campground (F), High Point Lookout (G), Veach (H), Fairway Hunt Club (I), Townsend Recreation Site (J), Jackson Hill Lookout (K), Millertown (L), Powell Town Volunteer Fire Department (M), Attoyac Property Owners Volunteer Fire Department (N), Denning New Hope Volunteer Fire Department (O), Texas Forest Service San Augustine Office (P), Captain Thomas William Blount House (Q), William Garrett Plantation House (R). Display/hide their locations on the map
Churches in Leon County include: Black Ankle Church (A), Pleasant Hill Church (B), Apostolic Church (C), Shiloh Church (D), Bethel Church (E), Attoyac Church (F), Antioch Church (G), Ratcliff Church (H), China Chapel Church (I). Display/hide their locations on the map
Cemeteries: Price Cemetery (1), Liberty Hill Church (2), Cartwright Cemetery (3), Chumley Cemetery (4), McCadley Cemetery (5), Clay Cemetery (6), Crooker Cemetery (7). Display/hide their locations on the map
Lakes and reservoirs: Cattail Pond (A), Highland Pond (B), Hunts Lake (C), City Lake (D), Spring Lake (E), Lilly Lake (F), Spring Lake (G), San Augustine City Lake (H). Display/hide their locations on the map
Streams, rivers, and creeks: Bridge Creek (A), Boggy Creek (B), Bog Creek (C), Blue Creek (D), Blackland Branch (E), Black Branch (F), Wash Branch (G), Blackbum Branch (H), Couchatana Creek (I). Display/hide their locations on the map
Parks in Leon County include: San Augustine Park (1), Blount Park (2), Jackson Hill Park (3), Bannister Wildlife Management Area (4). Display/hide their locations on the map
Neighboring counties: Clarke County, Alabama  , Coffee County, Alabama , Covington County, Alabama , Camden County, Georgia , Worth County, Georgia .
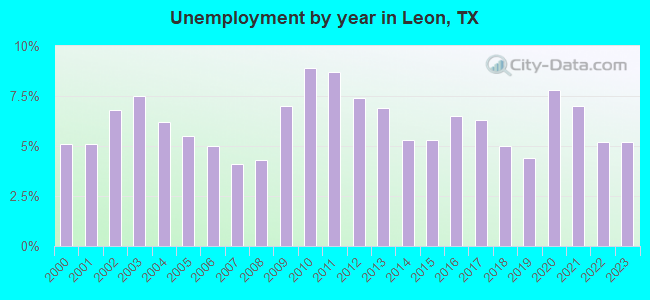
| Here: | 4.4% |
| Texas: | 3.5% |


Current college students: 338
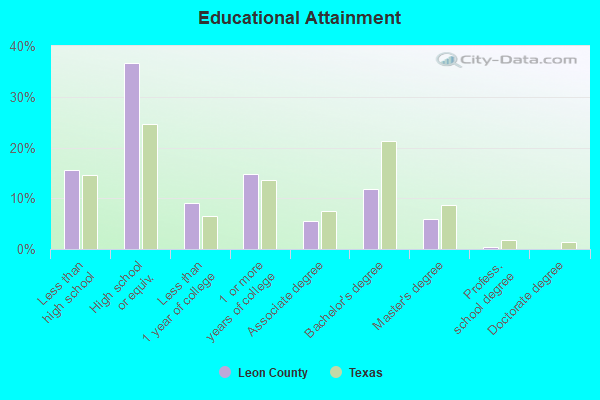
People 25 years of age or older with a high school degree or higher: 84.6%
People 25 years of age or older with a bachelor's degree or higher: 15.0%
Number of foreign born residents: 770 (22.2% naturalized citizens)
| Leon County: | 4.7% |
| Whole state: | 17.2% |

- Year of entry for the foreign-born population
- 1452010 or later
- 1632000 to 2009
- 2781990 to 1999
- 2201980 to 1989
- 711970 to 1979
- 41Before 1970
Mean travel time to work (commute): minutes
Percentage of county residents living and working in this county: 98.2%
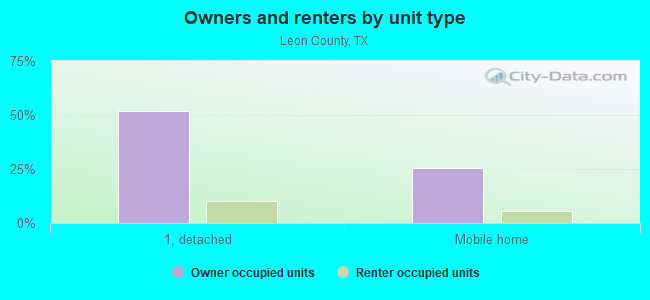
Housing units in structures:
- One, detached: 5,296
- One, attached: 44
- Two: 84
- 3 or 4: 150
- 5 to 9: 67
- 10 to 19: 12
- 20 to 49: 20
- 50 or more: 14
- Mobile homes: 3,460
- Boats, RVs, vans, etc.: 9
Housing units in Leon County with a mortgage: 1,685 (74 second mortgage, 0 home equity loan, 80 both second mortgage and home equity loan)
Houses without a mortgage: 0
| Here: | 100.0% with mortgage |
| State: | 98.4% with mortgage |
Religion statistics for Leon County
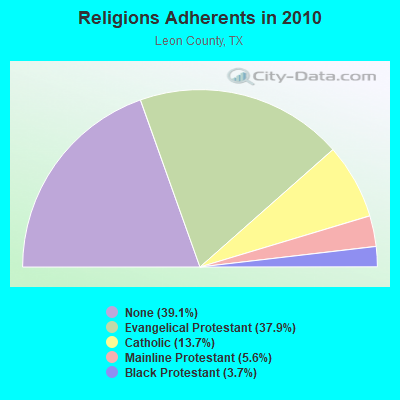
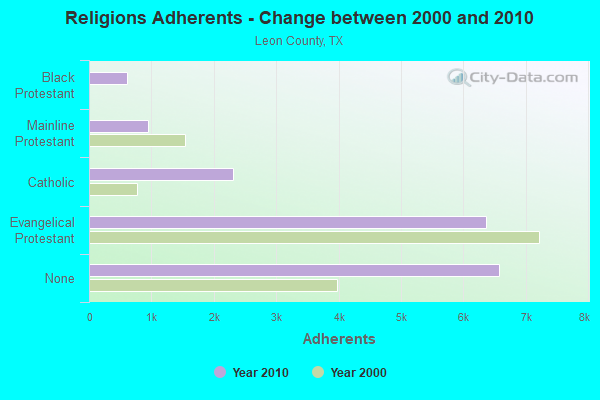
| Religion | Adherents | Congregations |
|---|---|---|
| Evangelical Protestant | 6,365 | 37 |
| Catholic | 2,302 | 3 |
| Mainline Protestant | 941 | 10 |
| Black Protestant | 616 | 6 |
| Other | - | 1 |
| None | 6,577 | - |
Source: Clifford Grammich, Kirk Hadaway, Richard Houseal, Dale E.Jones, Alexei Krindatch, Richie Stanley and Richard H.Taylor. 2012. 2010 U.S.Religion Census: Religious Congregations & Membership Study. Association of Statisticians of American Religious Bodies. Jones, Dale E., et al. 2002. Congregations and Membership in the United States 2000. Nashville, TN: Glenmary Research Center.
Food Environment Statistics:
| Leon County: | 4.27 / 10,000 pop. |
| State: | 1.47 / 10,000 pop. |
| This county: | 1.83 / 10,000 pop. |
| Texas: | 1.11 / 10,000 pop. |
| Leon County: | 9.75 / 10,000 pop. |
| Texas: | 3.95 / 10,000 pop. |
| This county: | 4.88 / 10,000 pop. |
| State: | 6.13 / 10,000 pop. |
| Leon County: | 10.3% |
| Texas: | 8.9% |
| Leon County: | 26.1% |
| State: | 26.6% |
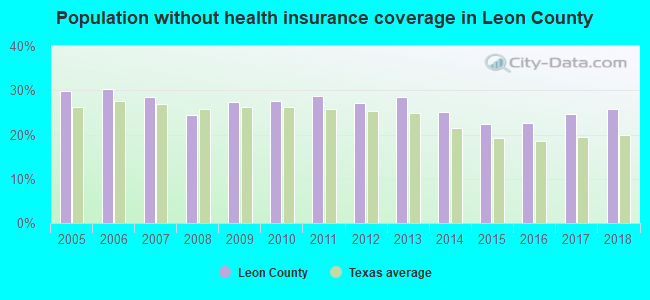
| Here: | 18.9% |
| State: | 15.7% |
Agriculture in Leon County:
Average size of farms: 295 acresAverage value of agricultural products sold per farm: $26,883
Average value of crops sold per acre for harvested cropland: $54.32
The value of nursery, greenhouse, floriculture, and sod as a percentage of the total market value of agricultural products sold: 0.35%
The value of livestock, poultry, and their products as a percentage of the total market value of agricultural products sold: 94.17%
Average total farm production expenses per farm: $27,835
Harvested cropland as a percentage of land in farms: 9.79%
Irrigated harvested cropland as a percentage of land in farms: 2.02%
Average market value of all machinery and equipment per farm: $33,584
The percentage of farms operated by a family or individual: 94.97%
Average age of principal farm operators: 59 years
Average number of cattle and calves per 100 acres of all land in farms: 18.57
Milk cows as a percentage of all cattle and calves: 0.03%
Vegetables: 236 harvested acres
Land in orchards: 302 acres
Tornado activity:
Leon County historical area-adjusted tornado activity is significantly below Texas state average. It is 3689562.5 times below overall U.S. average.Tornadoes in this county have caused one fatality and 42 injuries recorded between 1950 and 2004.
On 4/30/1954, a category 2 (max. wind speeds 113-157 mph) tornado injured 25 people and caused between $50,000 and $500,000 in damages.
Earthquake activity:
Leon County-area historical earthquake activity is significantly above Texas state average. It is 294% greater than the overall U.S. average.On 5/17/2012 at 08:12:00, a magnitude 4.8 (4.8 MW, Depth: 3.1 mi, Class: Light, Intensity: IV - V) earthquake occurred 109.5 miles away from Leon County center
On 11/6/2011 at 03:53:10, a magnitude 5.7 (5.7 MW, Depth: 3.2 mi, Class: Moderate, Intensity: VI - VII) earthquake occurred 297.2 miles away from the county center
On 9/3/2016 at 12:02:44, a magnitude 5.8 (5.8 MW, Depth: 3.5 mi) earthquake occurred 359.6 miles away from the county center
On 9/2/2013 at 23:51:15, a magnitude 4.3 (4.3 MW, Depth: 2.9 mi) earthquake occurred 105.8 miles away from the county center
On 10/20/2011 at 12:24:41, a magnitude 4.8 (4.8 MW, Depth: 3.1 mi) earthquake occurred 205.8 miles away from Leon County center
On 6/16/1978 at 11:46:54, a magnitude 5.3 (4.4 MB, 4.6 UK, 5.3 ML) earthquake occurred 300.9 miles away from the county center
Magnitude types: body-wave magnitude (MB), local magnitude (ML), moment magnitude (MW)
Most recent natural disasters:
- Texas Covid-19 Pandemic, Incident Period: January 20, 2020, FEMA Id: 4485, Natural disaster type: Other
- Texas Severe Winter Storms, Tornadoes, Straight-line Winds, and Flooding, Incident Period: December 26, 2016 to January 21, 2016, Major Disaster (Presidential) Declared DR-4255: February 09, 2016, FEMA Id: 4255, Natural disaster type: Winter Storm, Tornado, Flood, Wind
- Texas Severe Storms and Flooding, Incident Period: May 22, 2016 to June 24, 2016, Major Disaster (Presidential) Declared DR-4272: June 11, 2016, FEMA Id: 4272, Natural disaster type: Storm, Flood
- Texas Severe Storms, Tornadoes, Straight-line Winds, and Flooding, Incident Period: May 04, 2015 to June 23, 2015, Major Disaster (Presidential) Declared DR-4223: May 29, 2015, FEMA Id: 4223, Natural disaster type: Storm, Tornado, Flood, Wind
- Texas Wildfires, Incident Period: August 30, 2011 to December 31, 2011, Major Disaster (Presidential) Declared DR-4029: September 09, 2011, FEMA Id: 4029, Natural disaster type: Fire
- Texas Hurricane Ike, Incident Period: September 07, 2008 to October 02, 2008, Major Disaster (Presidential) Declared DR-1791: September 13, 2008, FEMA Id: 1791, Natural disaster type: Hurricane
- Texas Wildfires, Incident Period: March 14, 2008 to September 01, 2008, Emergency Declared EM-3284: March 14, 2008, FEMA Id: 3284, Natural disaster type: Fire
- Texas Hurricane Rita, Incident Period: September 23, 2005 to October 14, 2005, Major Disaster (Presidential) Declared DR-1606: September 24, 2005, FEMA Id: 1606, Natural disaster type: Hurricane
- Texas Hurricane Rita, Incident Period: September 20, 2005 to October 14, 2005, Emergency Declared EM-3261: September 21, 2005, FEMA Id: 3261, Natural disaster type: Hurricane
- Texas Hurricane Katrina, Incident Period: August 29, 2005 to October 01, 2005, Emergency Declared EM-3216: September 02, 2005, FEMA Id: 3216, Natural disaster type: Hurricane
- 10 other natural disasters have been reported since 1953.
The number of natural disasters in Leon County (20) is greater than the US average (15).
Major Disasters (Presidential) Declared: 13
Emergencies Declared: 6
Causes of natural disasters: Floods: 8, Storms: 8, Tornadoes: 6, Fires: 4, Hurricanes: 4, Winds: 2, Winter Storm: 1, Other: 2 (Note: some incidents may be assigned to more than one category).

Means of transportation to work:
- Drove a car alone: 4,441 (72.0%)
- Carpooled: 1,147 (18.6%)
- Bus: 2 (0.0%)
- Taxicab, motorcycle, or other means: 24 (0.4%)
- Bicycle: 50 (0.8%)
- Walked: 30 (0.5%)
- Worked at home: 342 (5.5%)

- Accommodation and food services (13%)
- Health care and social assistance (11%)
- Retail trade (11%)
- Educational services (9%)
- Administrative and support and waste management services (6%)
- Other services, except public administration (6%)
- Public administration (5%)
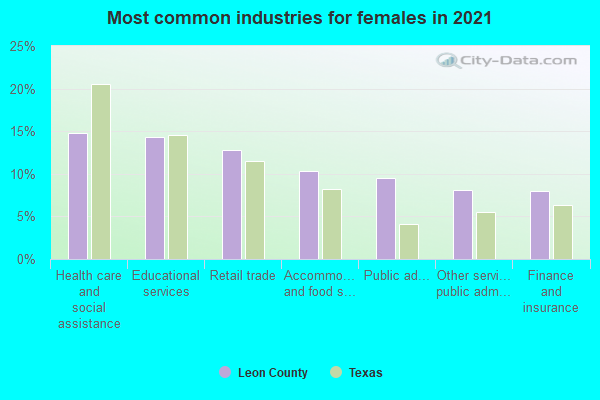
- Accommodation and food services (16%)
- Health care and social assistance (14%)
- Retail trade (13%)
- Educational services (11%)
- Administrative and support and waste management services (7%)
- Other services, except public administration (7%)
- Public administration (6%)
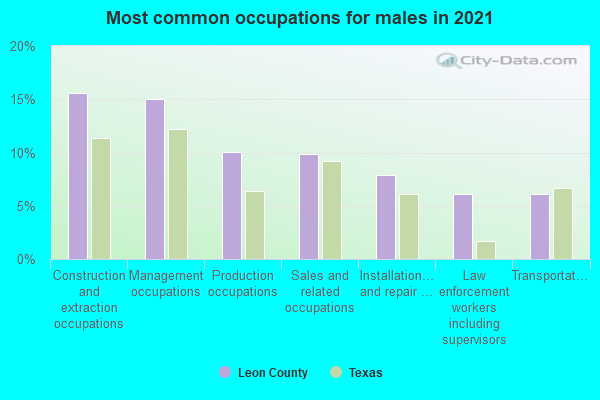
- Management occupations (17%)
- Construction and extraction occupations (16%)
- Sales and related occupations (9%)
- Production occupations (8%)
- Transportation occupations (7%)
- Installation, maintenance, and repair occupations (6%)
- Material moving occupations (5%)
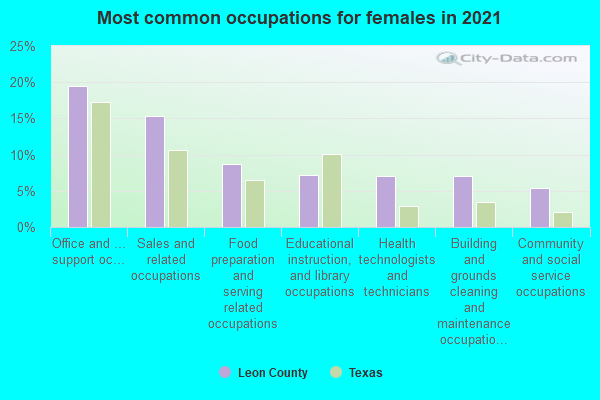
- Office and administrative support occupations (21%)
- Food preparation and serving related occupations (16%)
- Sales and related occupations (14%)
- Management occupations (9%)
- Health technologists and technicians (5%)
- Healthcare support occupations (5%)
- Building and grounds cleaning and maintenance occupations (4%)
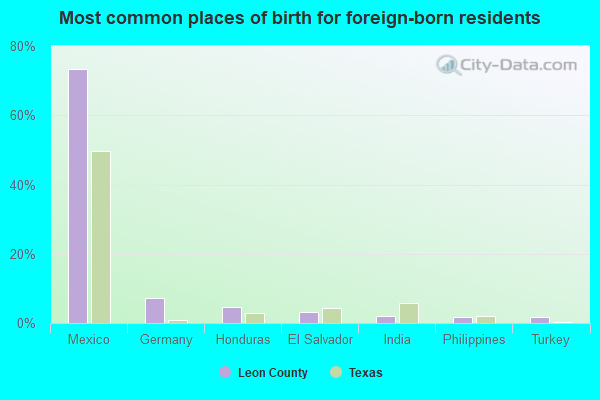
- Mexico (74%)
- Germany (7%)
- Honduras (6%)
- El Salvador (5%)
- Other Caribbean (2%)
- Denmark (1%)
- India (1%)
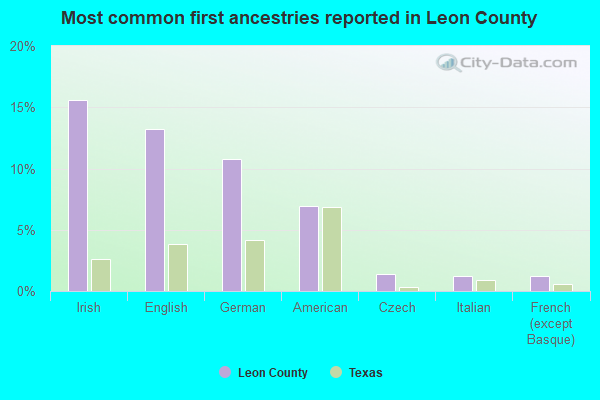
- English (16%)
- Irish (15%)
- German (9%)
- American (9%)
- Scottish (3%)
- French (except Basque) (1%)
- Czech (1%)
People in group quarters in Leon County, Texas in 2010:
- 63 people in nursing facilities/skilled-nursing facilities
- 27 people in local jails and other municipal confinement facilities
- 14 people in group homes intended for adults
23 people in local jails and other confinement facilities (including police lockups)
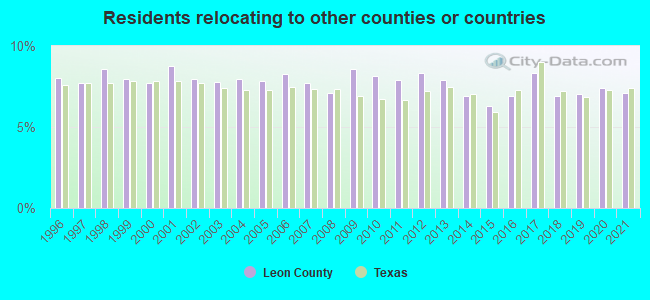
9.63% of this county's 2021 resident taxpayers lived in other counties in 2020 ($67,545 average adjusted gross income)
| Here: | 9.63% |
| Texas average: | 8.12% |
10 or fewer of this county's residents moved from foreign countries.
8.56% relocated from other counties in Texas ($61,024 average AGI)
1.06% relocated from other states ($6,520 average AGI)
Leon County: 1.06% Texas average: 2.83%

Top counties from which taxpayers relocated into this county between 2020 and 2021:
| from Harris County, TX | |
| from Montgomery County, TX | |
| from Brazos County, TX | |
| from Freestone County, TX | |
| from Anderson County, TX | |
| from Dallas County, TX | |
| from Madison County, TX |
7.12% of this county's 2020 resident taxpayers moved to other counties in 2021 ($44,482 average adjusted gross income)
| Here: | 7.12% |
| Texas average: | 7.40% |
10 or fewer of this county's residents moved to foreign countries.
6.54% relocated to other counties in Texas ($42,236 average AGI)
0.58% relocated to other states ($2,245 average AGI)
Leon County: 0.58% Texas average: 2.08%
Top counties to which taxpayers relocated from this county between 2020 and 2021:
| to Brazos County, TX | |
| to Harris County, TX | |
| to Freestone County, TX | |
| to Montgomery County, TX | |
| to Anderson County, TX | |
| to Madison County, TX | |
| to Limestone County, TX |
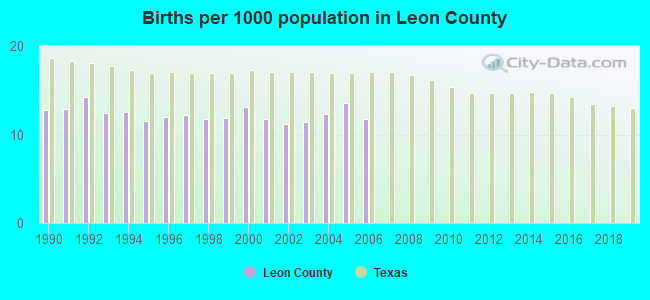
Births per 1000 population from 1990 to 1999: 12.4
Births per 1000 population from 2000 to 2006: 12.1
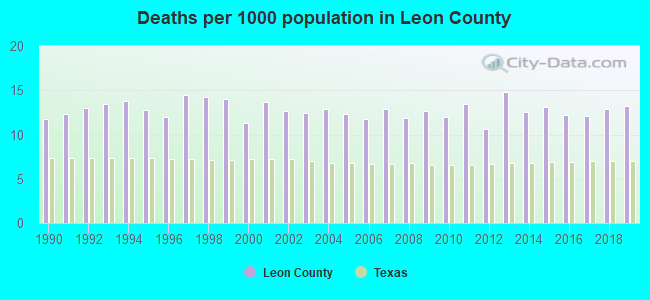
Deaths per 1000 population from 1990 to 1999: 13.2
Deaths per 1000 population from 2000 to 2009: 12.4
Deaths per 1000 population from 2010 to 2020: 12.8
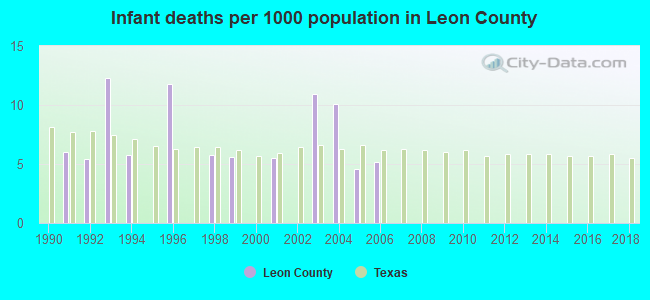
Infant deaths per 1000 live births from 1990 to 1999: 5.3
Infant deaths per 1000 live births from 2000 to 2006: 5.2
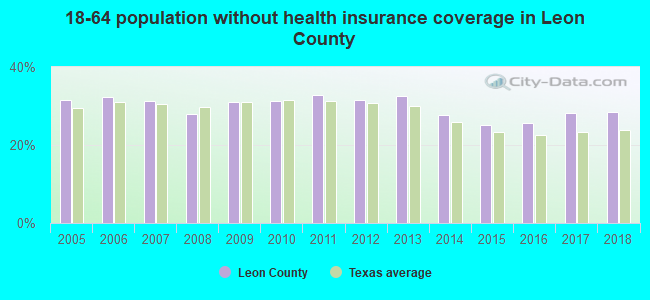
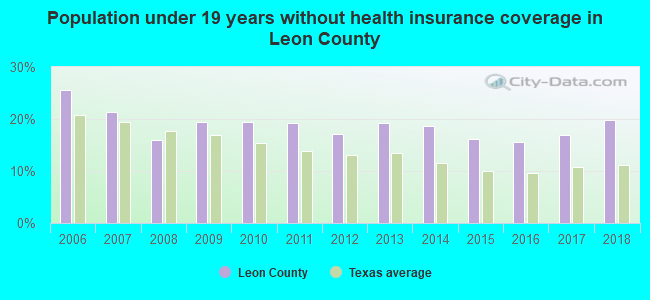
Persons under 19 years old without health insurance coverage in 2018: 19.8%
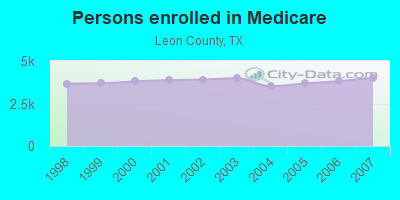
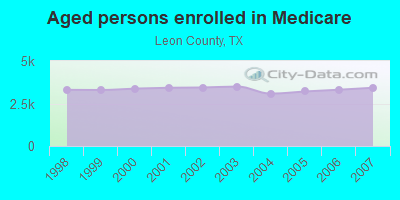
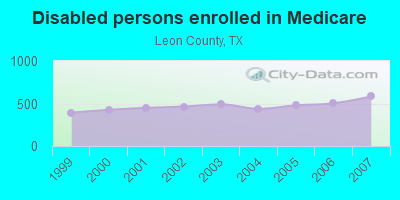
Persons enrolled in hospital insurance and/or supplemental medical insurance (Medicare) in July 1, 2007: 4,008 (3,425 aged, 583 disabled)
Children under 18 without health insurance coverage in 2007: 803 (21%)
Most common underlying causes of death in Leon County, Texas in 1999 - 2019:
- Bronchus or lung, unspecified - Malignant neoplasms (338)
- Acute myocardial infarction, unspecified (274)
- Chronic obstructive pulmonary disease, unspecified (182)
- Atherosclerotic heart disease (122)
- Alzheimer disease, unspecified (82)
- Stroke, not specified as haemorrhage or infarction (40)
- Congestive heart failure (20)
- Unspecified dementia (13)
Population without health insurance coverage in 2000: 17%
Children under 18 without health insurance coverage in 2000: 17%
Medical specialist MDs per 100,000 population in 2005: 1,322
Dentists per 100,000 population in 1998: 31
Total births per 100,000 population, July 2005 - July 2006 : 21
Total deaths per 100,000 population, July 2005 - July 2006: 61
Limited-service eating places per 100,000 population in 2005 : 6
Suicides per 1,000,000 population from 2000 to 2006: 189.7. This is more than state average.
Household type by relationship:
Households: 16,356- Male householders: 3,330 (763 living alone), Female householders: 3,431 (1,033 living alone)
3,937 spouses (3,937 opposite-sex spouses), 312 unmarried partners, (312 opposite-sex unmarried partners), 4,169 children (3,636 natural, 302 adopted, 233 stepchildren), 548 grandchildren, 93 brothers or sisters, 224 parents, 0 foster children, 168 other relatives, 152 non-relatives
- In group quarters: 89
Size of family households: 2,584 2-persons, 943 3-persons, 649 4-persons, 380 5-persons, 90 6-persons, 85 7-or-more-persons.
Size of nonfamily households: 1,797 1-person, 237 2-persons, 8 3-persons, 4 4-persons.
2,307 married couples with children.
713 single-parent households (73 men, 640 women).
88.5% of residents of Leon speak English at home.
10.9% of residents speak Spanish at home (68% speak English very well, 12% speak English well, 17% speak English not well, 4% don't speak English at all).
0.7% of residents speak other Indo-European language at home (100% speak English very well).
In fiscal year 2004:
Federal Government expenditure: $127,815,000 ($7,936 per capita)
Department of Defense expenditure: $2,317,000
Federal direct payments to individuals for retirement and disability: $57,976,000
Federal other direct payments to individuals: $27,905,000
Federal direct payments not to individuals: $159,000
Federal grants: $37,992,000
Federal procurement contracts: $786,000 ($25,000 Department of Defense)
Federal salaries and wages: $2,996,000 ($0,000 Department of Defense)
Federal Government direct loans: $104,000
Federal guaranteed/insured loans: $1,430,000
Federal Government insurance: $407,000
Population change from April 1, 2000 to July 1, 2005:
Births: 978| Here: | 60 per 1000 residents |
| State: | 85 per 1000 residents |
Deaths: 1,030
| Here: | 63 per 1000 residents |
| State: | 35 per 1000 residents |
Net international migration: +113
| Here: | +7 per 1000 residents |
| State: | +29 per 1000 residents |
Net internal migration: +977
| Here: | +60 per 1000 residents |
| State: | +10 per 1000 residents |
Total withdrawal of fresh water for public supply: 1.59 millions of gallons per day (all from ground)
| Here: | 6.0 |
| State: | 6.3 |
| Here: | 4.5 |
| State: | 4.0 |
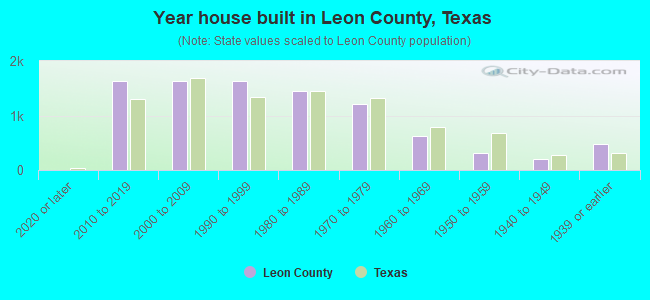
- Year house built in Leon County, Texas
- 02020 or later
- 1,5262010 to 2019
- 1,8082000 to 2009
- 1,5071990 to 1999
- 1,6531980 to 1989
- 1,0991970 to 1979
- 4871960 to 1969
- 3081950 to 1959
- 2001940 to 1949
- 4851939 or earlier
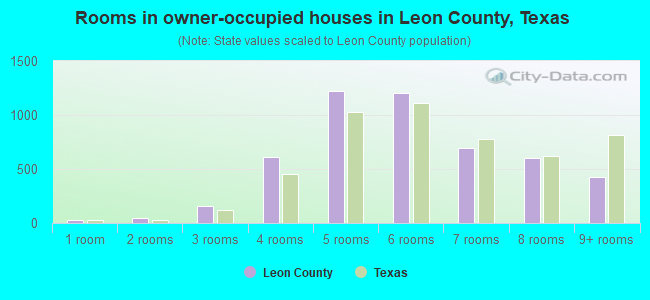
- Rooms in owner-occupied houses in Leon County, Texas
- 241 room
- 532 rooms
- 2263 rooms
- 6054 rooms
- 1,1595 rooms
- 1,3016 rooms
- 7607 rooms
- 5948 rooms
- 5929+ rooms
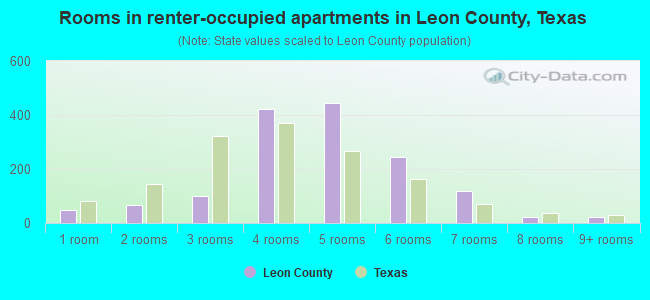
- Rooms in renter-occupied apartments in Leon County, Texas
- 321 room
- 02 rooms
- 1423 rooms
- 5134 rooms
- 3965 rooms
- 1776 rooms
- 887 rooms
- 428 rooms
- 339+ rooms

- Bedrooms in owner-occupied houses in Leon County, Texas
- 26no bedroom
- 1261 bedroom
- 9062 bedrooms
- 3,0653 bedrooms
- 1,0834 bedrooms
- 695+ bedrooms
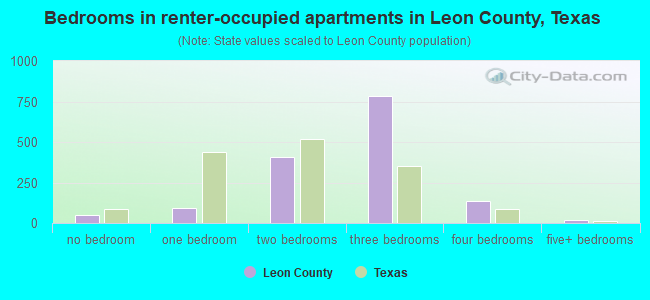
- Bedrooms in renter-occupied apartments in Leon County, Texas
- 32no bedroom
- 431 bedroom
- 4472 bedrooms
- 7953 bedrooms
- 1034 bedrooms
- 195+ bedrooms
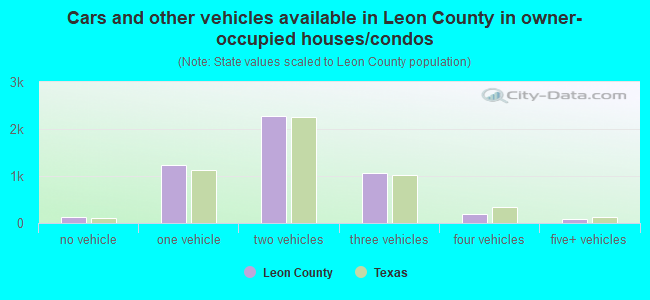
- Cars and other vehicles available in Leon County in owner-occupied houses/condos
- 72no vehicle
- 1,2401 vehicle
- 2,3772 vehicles
- 1,2523 vehicles
- 2444 vehicles
- 1125+ vehicles
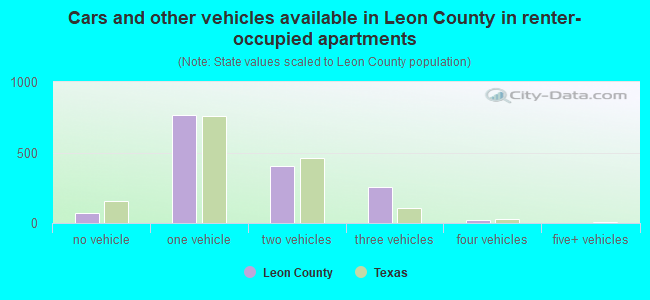
- Cars and other vehicles available in Leon County in renter-occupied apartments
- 60no vehicle
- 6681 vehicle
- 4072 vehicles
- 2933 vehicles
- 244 vehicles
- 25+ vehicles
89.8% of Leon County residents lived in the same house 1 years ago.
Out of people who lived in different houses, 33% lived in this county.
Out of people who lived in different counties, 86% lived in Texas.
| Leon County: | 89.8% |
| State average: | 85.7% |
Place of birth for U.S.-born residents:
- This state: 12,426
- Other state: 2,927
- Northeast: 511
- Midwest: 611
- South: 1,416
- West: 365
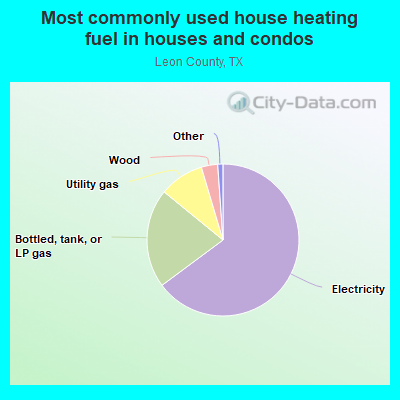
- 64.2%Electricity
- 22.8%Bottled, tank, or LP gas
- 8.0%Utility gas
- 3.9%Wood
- 0.8%No fuel used
- 0.1%Other fuel
- 69.6%Electricity
- 13.0%Utility gas
- 12.6%Bottled, tank, or LP gas
- 2.5%No fuel used
- 2.0%Other fuel
- 0.4%Wood
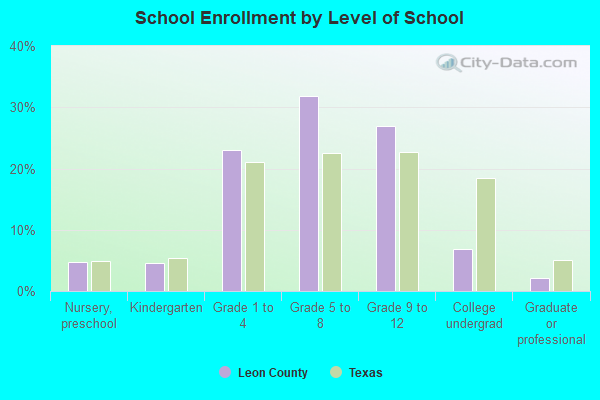
Private vs. public school enrollment:
| Here: | 5.5% |
| Texas: | 8.8% |
| Here: | 15.9% |
| Texas: | 8.0% |
| Here: | 8.5% |
| Texas: | 16.2% |
Leon County government finances - Expenditure in 2017:
- Charges - Other: $322,000
- Construction - Regular Highways: $473,000
General - Other: $228,000
- Current Operations - Regular Highways: $1,494,000
Police Protection: $949,000
Judicial and Legal Services: $898,000
Correctional Institutions: $827,000
Financial Administration: $508,000
Central Staff Services: $340,000
General - Other: $195,000
Public Welfare, Vendor Payments for Medical Care: $83,000
General Public Buildings: $78,000
Local Fire Protection: $55,000
Libraries: $52,000
Natural Resources - Other: $36,000
Health - Other: $8,000
- General - Interest on Debt: $102,000
- Long Term Debt - Beginning Outstanding - Unspecified Public Purpose: $2,738,000
Outstanding Unspecified Public Purpose: $2,596,000
Retired Unspecified Public Purpose: $142,000
- Miscellaneous - Fines and Forfeits: $320,000
General Revenue - Other: $50,000
Sale of Property: $23,000
Donations From Private Sources: $8,000
Rents: $1,000
Interest Earnings: $0
- Other Capital Outlay - Regular Highways: $144,000
General - Other: $35,000
Police Protection: $26,000
Financial Administration: $10,000
Central Staff Services: $2,000
Correctional Institutions: $1,000
Judicial and Legal Services: $1,000
Libraries: $1,000
- State Intergovernmental - Other: $153,000
Highways: $131,000
General Local Government Support: $5,000
Health and Hospitals: $4,000
- Tax - Property: $3,943,000
Motor Vehicle License: $365,000
- Total Salaries and Wages: $1,978,000
Leon County government finances - Revenue in 2017:
- Charges - Other: $322,000
- Construction - Regular Highways: $473,000
General - Other: $228,000
- Current Operations - Regular Highways: $1,494,000
Police Protection: $949,000
Judicial and Legal Services: $898,000
Correctional Institutions: $827,000
Financial Administration: $508,000
Central Staff Services: $340,000
General - Other: $195,000
Public Welfare, Vendor Payments for Medical Care: $83,000
General Public Buildings: $78,000
Local Fire Protection: $55,000
Libraries: $52,000
Natural Resources - Other: $36,000
Health - Other: $8,000
- General - Interest on Debt: $102,000
- Long Term Debt - Beginning Outstanding - Unspecified Public Purpose: $2,738,000
Outstanding Unspecified Public Purpose: $2,596,000
Retired Unspecified Public Purpose: $142,000
- Miscellaneous - Fines and Forfeits: $320,000
General Revenue - Other: $50,000
Sale of Property: $23,000
Donations From Private Sources: $8,000
Rents: $1,000
Interest Earnings: $0
- Other Capital Outlay - Regular Highways: $144,000
General - Other: $35,000
Police Protection: $26,000
Financial Administration: $10,000
Central Staff Services: $2,000
Correctional Institutions: $1,000
Judicial and Legal Services: $1,000
Libraries: $1,000
- State Intergovernmental - Other: $153,000
Highways: $131,000
General Local Government Support: $5,000
Health and Hospitals: $4,000
- Tax - Property: $3,943,000
Motor Vehicle License: $365,000
- Total Salaries and Wages: $1,978,000
Leon County government finances - Debt in 2017:
- Charges - Other: $322,000
- Construction - Regular Highways: $473,000
General - Other: $228,000
- Current Operations - Regular Highways: $1,494,000
Police Protection: $949,000
Judicial and Legal Services: $898,000
Correctional Institutions: $827,000
Financial Administration: $508,000
Central Staff Services: $340,000
General - Other: $195,000
Public Welfare, Vendor Payments for Medical Care: $83,000
General Public Buildings: $78,000
Local Fire Protection: $55,000
Libraries: $52,000
Natural Resources - Other: $36,000
Health - Other: $8,000
- General - Interest on Debt: $102,000
- Long Term Debt - Beginning Outstanding - Unspecified Public Purpose: $2,738,000
Outstanding Unspecified Public Purpose: $2,596,000
Retired Unspecified Public Purpose: $142,000
- Miscellaneous - Fines and Forfeits: $320,000
General Revenue - Other: $50,000
Sale of Property: $23,000
Donations From Private Sources: $8,000
Rents: $1,000
Interest Earnings: $0
- Other Capital Outlay - Regular Highways: $144,000
General - Other: $35,000
Police Protection: $26,000
Financial Administration: $10,000
Central Staff Services: $2,000
Correctional Institutions: $1,000
Judicial and Legal Services: $1,000
Libraries: $1,000
- State Intergovernmental - Other: $153,000
Highways: $131,000
General Local Government Support: $5,000
Health and Hospitals: $4,000
- Tax - Property: $3,943,000
Motor Vehicle License: $365,000
- Total Salaries and Wages: $1,978,000
Leon County government finances - Cash and Securities in 2017:
- Charges - Other: $322,000
- Construction - Regular Highways: $473,000
General - Other: $228,000
- Current Operations - Regular Highways: $1,494,000
Police Protection: $949,000
Judicial and Legal Services: $898,000
Correctional Institutions: $827,000
Financial Administration: $508,000
Central Staff Services: $340,000
General - Other: $195,000
Public Welfare, Vendor Payments for Medical Care: $83,000
General Public Buildings: $78,000
Local Fire Protection: $55,000
Libraries: $52,000
Natural Resources - Other: $36,000
Health - Other: $8,000
- General - Interest on Debt: $102,000
- Long Term Debt - Beginning Outstanding - Unspecified Public Purpose: $2,738,000
Outstanding Unspecified Public Purpose: $2,596,000
Retired Unspecified Public Purpose: $142,000
- Miscellaneous - Fines and Forfeits: $320,000
General Revenue - Other: $50,000
Sale of Property: $23,000
Donations From Private Sources: $8,000
Rents: $1,000
Interest Earnings: $0
- Other Capital Outlay - Regular Highways: $144,000
General - Other: $35,000
Police Protection: $26,000
Financial Administration: $10,000
Central Staff Services: $2,000
Correctional Institutions: $1,000
Judicial and Legal Services: $1,000
Libraries: $1,000
- State Intergovernmental - Other: $153,000
Highways: $131,000
General Local Government Support: $5,000
Health and Hospitals: $4,000
- Tax - Property: $3,943,000
Motor Vehicle License: $365,000
- Total Salaries and Wages: $1,978,000
Supplemental Security Income (SSI) in 2006:
- Total number of recipients: 427
- Number of aged recipients: 87
- Number of blind and disabled recipients: 340
- Number of recipients under 18: 49
- Number of recipients between 18 and 64: 241
- Number of recipients older than 64: 137
- Number of recipients also receiving OASDI: 205
- Amount of payments (thousands of dollars): 162
| Most common first names in Leon County, TX among deceased individuals | ||
| Name | Count | Lived (average) |
|---|---|---|
| James | 167 | 71.1 years |
| Mary | 133 | 78.9 years |
| William | 125 | 74.9 years |
| John | 124 | 76.0 years |
| Robert | 115 | 73.2 years |
| George | 70 | 75.8 years |
| Willie | 64 | 75.8 years |
| Charles | 48 | 74.9 years |
| Joe | 46 | 76.0 years |
| Henry | 46 | 78.7 years |
| Most common last names in Leon County, TX among deceased individuals | ||
| Last name | Count | Lived (average) |
|---|---|---|
| Johnson | 131 | 78.4 years |
| Smith | 90 | 77.4 years |
| Jones | 78 | 75.3 years |
| Williams | 76 | 75.5 years |
| Davis | 63 | 77.8 years |
| Brown | 52 | 72.2 years |
| Watson | 51 | 79.2 years |
| Robinson | 41 | 79.1 years |
| Taylor | 40 | 73.8 years |
| Moore | 38 | 77.7 years |
| Businesses in Leon County, TX | ||||
| Name | Count | Name | Count | |
|---|---|---|---|---|
| Ace Hardware | 1 | Jack In The Box | 1 | |
| Church's Chicken | 1 | Pizza Hut | 1 | |
| Comfort Inn | 1 | SONIC Drive-In | 1 | |
| Days Inn | 2 | Subway | 3 | |
| FedEx | 2 | True Value | 1 | |
| H&R Block | 1 | U-Haul | 3 | |
| Hilton | 1 | UPS | 2 | |