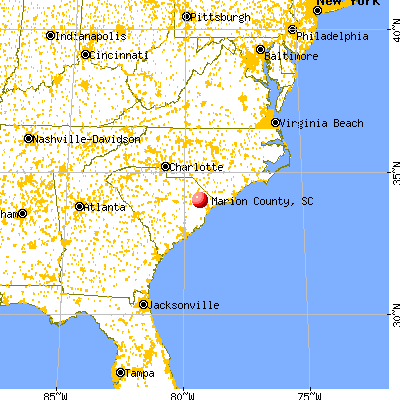
Marion County, South Carolina (SC)
County owner-occupied free and clear houses and condos in 2010: 4,361
County owner-occupied houses and condos in 2000: 9,762
Renter-occupied apartments: 4,078 (it was 3,539 in 2000)
| % of renters here: | 27% |
| State: | 31% |
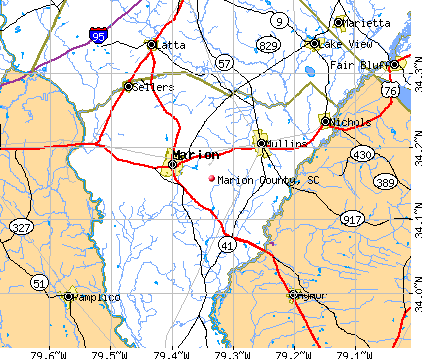
Land area: 489 sq. mi.
Water area: 5.0 sq. mi.
Population density: 61 people per square mile (average).
Industries providing employment: Educational, health and social services (22.5%), Manufacturing (14.9%), Transportation and warehousing,and utilities (12.3%), Retail trade (12.0%).
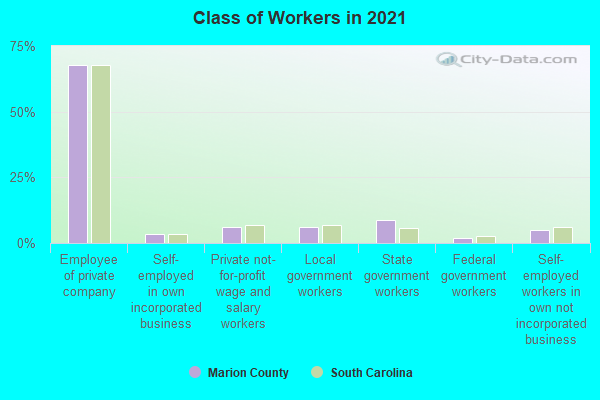
Type of workers:
- Private wage or salary: 76%
- Government: 18%
- Self-employed, not incorporated: 5%
- Unpaid family work: 0%
- OSM Map
- General Map
- Google Map
- MSN Map

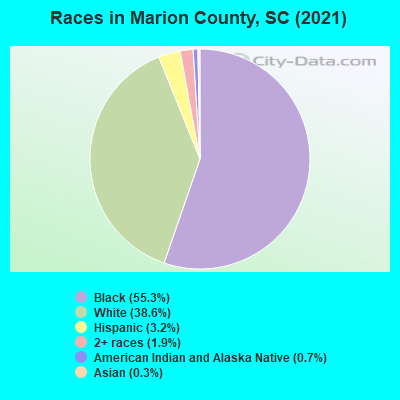
- 16,40055.4%Black Non-Hispanic Alone
- 11,33038.3%White Non-Hispanic Alone
- 1,0303.5%Hispanic or Latino
- 4941.7%Two or more races
- 2730.9%American Indian and Alaska Native alone
- 640.2%Asian alone
- 250.08%Some other race alone
| Median resident age: | 42.1 years |
| South Carolina median age: | 40.5 years |
| Males: 13,927 | |
| Females: 16,079 |

 | What's New/Closing/Coming to Florence (424 replies) |
| South Carolina 10 year growth changes (157 replies) |
| Is Greenville as amazing as it seems? Questions about growth and crime (54 replies) |
| What is life like in Marion? (6 replies) |
| New Downtown for Myrtle Beach (14 replies) |
| I-73 Could Boost Pee Dee and Coastal Region (11 replies) |
| Marion County: | 2.0 people |
| South Carolina: | 2 people |
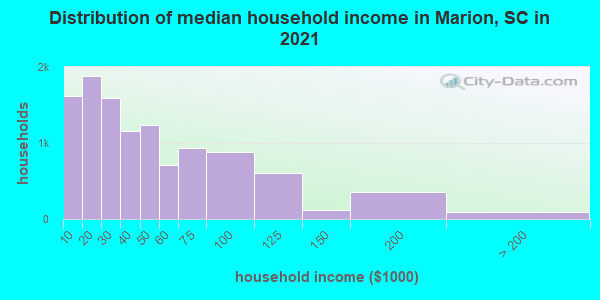
Estimated median household income in 2022: $36,250 ($26,526 in 1999)
| This county: | $36,250 |
| South Carolina: | $64,115 |
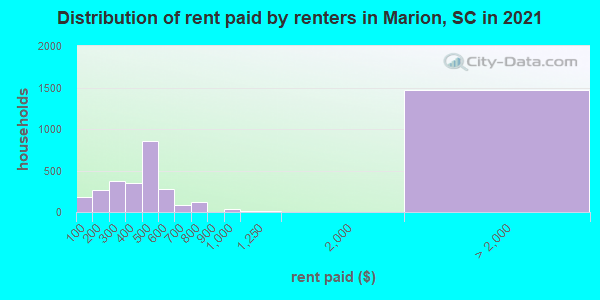
Median contract rent in 2022 for apartments: $465 (lower quartile is $288, upper quartile is $547)
| This county: | $465 |
| State: | $893 |
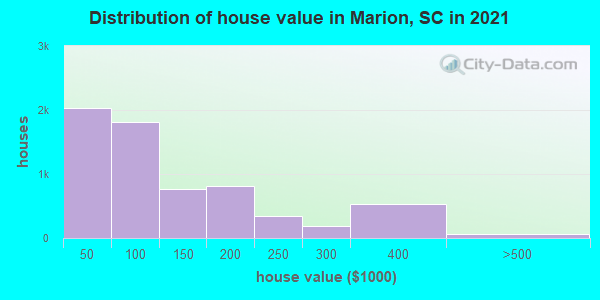
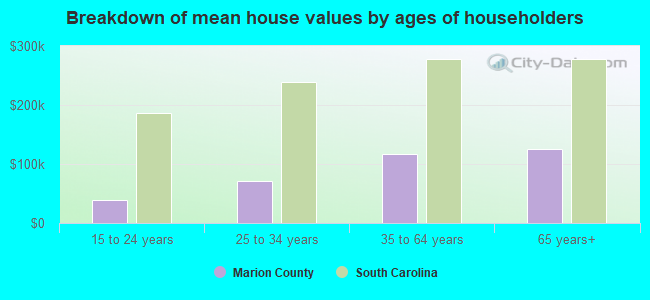
Estimated median house or condo value in 2022: $106,221 (it was $55,600 in 2000)
| Marion: | $106,221 |
| South Carolina: | $254,600 |
Median monthly housing costs for homes and condos with a mortgage: $1,009
Median monthly housing costs for units without a mortgage: $354
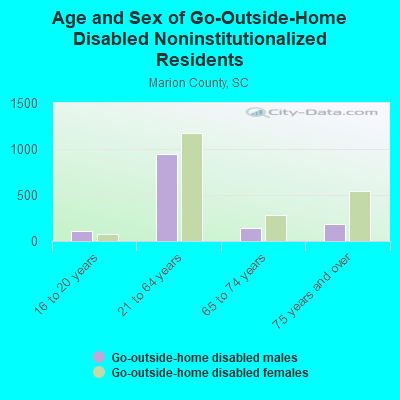
Institutionalized population: 178
Crime in 2021 (reported by the sheriff's office or county police, not the county total):
- Murders: 6
- Rapes: 4
- Robberies: 3
- Assaults: 65
- Burglaries: 72
- Thefts: 277
- Auto thefts: 37
Crime in 2020 (reported by the sheriff's office or county police, not the county total):
- Murders: 6
- Rapes: 7
- Robberies: 7
- Assaults: 83
- Burglaries: 120
- Thefts: 271
- Auto thefts: 39
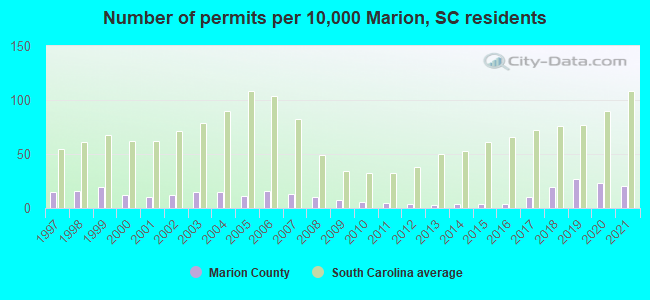
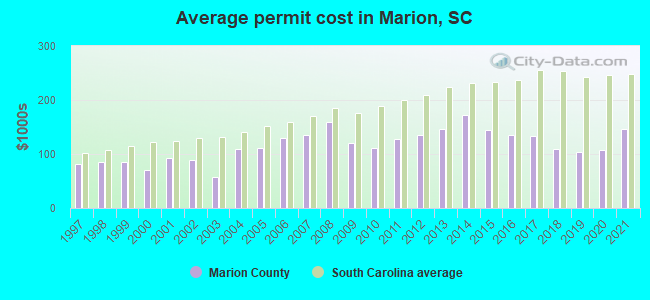
Single-family new house construction building permits:
- 2022: 77 buildings, average cost: $132,400
- 2021: 70 buildings, average cost: $145,700
- 2020: 81 buildings, average cost: $108,200
- 2019: 94 buildings, average cost: $103,600
- 2018: 67 buildings, average cost: $109,100
- 2017: 34 buildings, average cost: $134,000
- 2016: 13 buildings, average cost: $135,900
- 2015: 13 buildings, average cost: $144,100
- 2014: 15 buildings, average cost: $172,400
- 2013: 12 buildings, average cost: $146,000
- 2012: 15 buildings, average cost: $136,100
- 2011: 18 buildings, average cost: $127,900
- 2010: 20 buildings, average cost: $110,700
- 2009: 25 buildings, average cost: $120,600
- 2008: 37 buildings, average cost: $158,900
- 2007: 45 buildings, average cost: $135,800
- 2006: 58 buildings, average cost: $130,100
- 2005: 40 buildings, average cost: $111,700
- 2004: 54 buildings, average cost: $108,700
- 2003: 53 buildings, average cost: $56,600
- 2002: 41 buildings, average cost: $88,400
- 2001: 36 buildings, average cost: $91,700
- 2000: 41 buildings, average cost: $70,800
- 1999: 66 buildings, average cost: $85,300
- 1998: 55 buildings, average cost: $85,300
- 1997: 52 buildings, average cost: $80,600
Median real estate property taxes paid for housing units with mortgages in 2022: $614 (0.5%)
Median real estate property taxes paid for housing units with no mortgage in 2022: $382 (0.5%)
| Marion County: | 26.6% |
| South Carolina: | 14.0% |
Median age of residents in 2022: 42.1 years old
(Males: 39.2 years old, Females: 44.4 years old)
(Median age for: White residents: 49.0 years old, Black residents: 37.9 years old, American Indian residents: 26.0 years old, Asian residents: 40.7 years old, Hispanic or Latino residents: 35.8 years old, Other race residents: 35.3 years old)
Fair market rent in 2006 for a 1-bedroom apartment in Marion County is $398 a month.
Fair market rent for a 2-bedroom apartment is $481 a month.
Fair market rent for a 3-bedroom apartment is $584 a month.
Cities in this county include: Marion, Mullins, Brittons Neck, Centenary, Nichols, Sellers.
Notable locations in this county outside city limits:
Notable locations in Marion County: Apache Campground (A), Arcadian Shores Golf Links (B), Azalea Sands Golf Course (C), Bear Bluff Lodge (D), Beachwood Golf Club (E), Camp Inpaco (F), Conway Golf Course (G), Deer Track Golf Club (H), Dunes Golf Course (I), Heathland at the Legends Golf Course (J), Lake Arrowhead Campground (K), Lakewood Campground (L), Myrtle Beach Campground (M), Myrtle Beach National Golf Course (N), Myrtle Beach Racquet Club (O), Myrtle Beach Tennis Club (P), Myrtlewood Golf Course (Q), Ocean Lakes Family Campground (R), Parker Landing (S), Pirateland Campground (T). Display/hide their locations on the map
Shopping Centers: Briarcliffe Mall Shopping Center (1), Magnolia Plaza Shopping Center (2), Outlet Park at Waccamaw Shopping Center (3), Plantation Square Shopping Center (4). Display/hide their locations on the map
Churches in Marion County include: Toddville Church (A), Sweet Home Church (B), Pleasant Union Church (C), Simpson Creek Church (D), Salem Church (E), Saint Pauls Church (F), Saint Marys Church (G), Saint Johns Church (H), Rehobeth Church (I). Display/hide their locations on the map
Cemeteries: Thompkins Cemetery (1), Pleasant Grove Cemetery (2), Stevens Cemetery (3), Flag Patch Cemetery (4), Pleasant Plains Cemetery (5), Live Oak Cemetery (6), Mount Calvery Cemetery (7). Display/hide their locations on the map
Lakes, reservoirs, and swamps: Scrogging Lake (A), Broad Lake (B), Cox Ferry Lake (C), Tyler Ponds (D), Union Lake (E), Sessions Lake (F), Vaught Lake (G), Vol Rowll Lake (H). Display/hide their locations on the map
Streams, rivers, and creeks: Chinners Swamp (A), Zeeks Branch (B), Cowford Swamp (C), Crab Tree Swamp (D), Bradley Branch (E), Little Cedar Pond (F), Willow Springs Branch (G), Stanley Creek (H), Spring Swamp (I). Display/hide their locations on the map
Park in Marion County: Cox Park (1). Display/hide its location on the map
Beaches: Midway Swash (A), White Point Swash (B), Singleton Swash (C). Display/hide their locations on the map
Neighboring counties: Abbeville County  , Curry County, New Mexico , Pickens County
  , Pontotoc County, Mississippi , Winston County, Alabama , Rockdale County, Georgia .
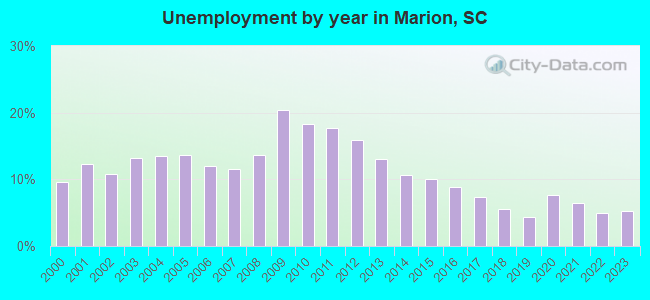
| Here: | 4.5% |
| South Carolina: | 3.1% |
Current college students: 1,234
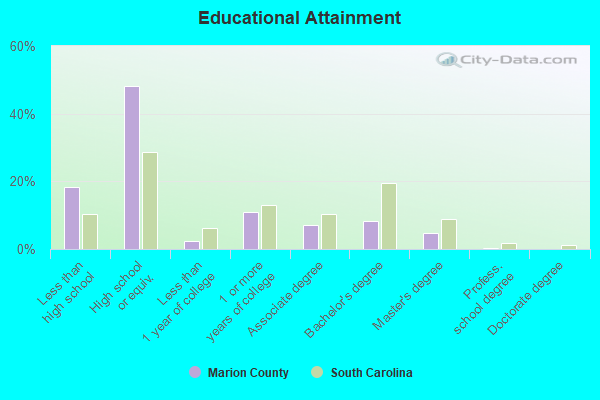
People 25 years of age or older with a high school degree or higher: 84.5%
People 25 years of age or older with a bachelor's degree or higher: 13.7%
Number of foreign born residents: 487 (28.1% naturalized citizens)
| Marion County: | 1.6% |
| Whole state: | 5.2% |
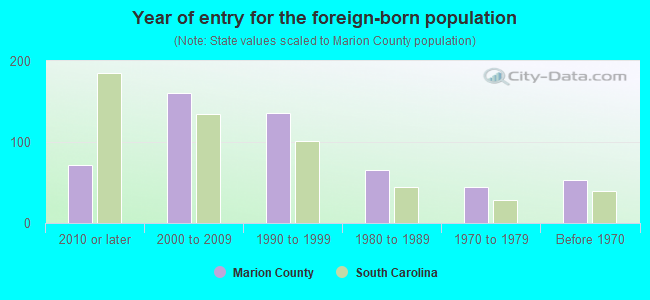
- Year of entry for the foreign-born population
- 612010 or later
- 2442000 to 2009
- 1061990 to 1999
- 661980 to 1989
- 441970 to 1979
- 53Before 1970
Mean travel time to work (commute): minutes
Percentage of county residents living and working in this county: 94.4%
Housing units in structures:
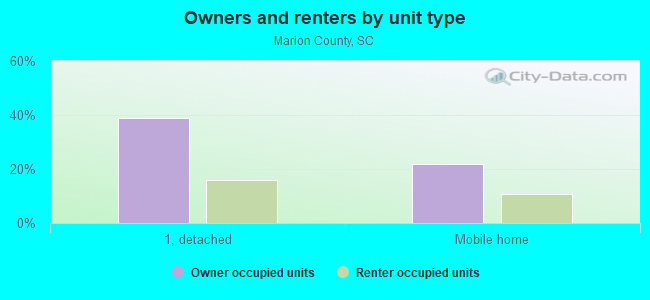
- One, detached: 8,237
- One, attached: 33
- Two: 679
- 3 or 4: 325
- 5 to 9: 232
- 20 or more: 1
- Mobile homes: 5,032
- Boats, RVs, vans, etc.: 57
Housing units in Marion County with a mortgage: 2,523 (151 second mortgage, 0 home equity loan, 108 both second mortgage and home equity loan)
Houses without a mortgage: 36
| Here: | 5.3% with mortgage |
| State: | 97.3% with mortgage |
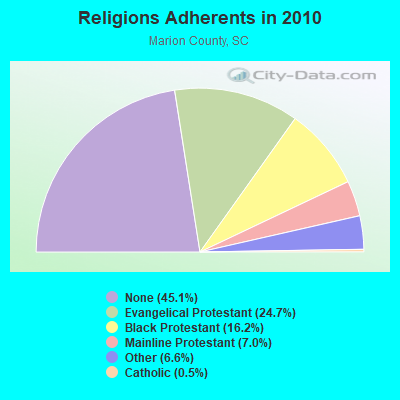
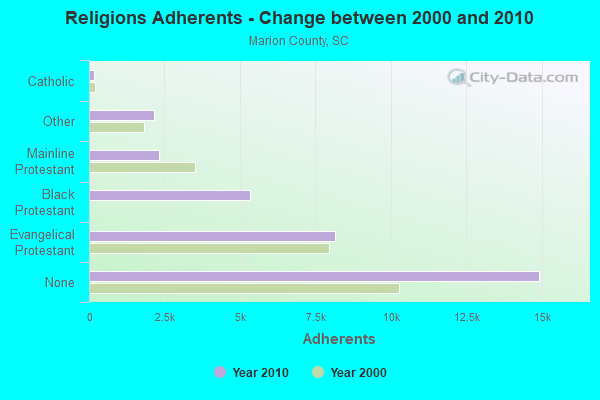
Religion statistics for Marion County
| Religion | Adherents | Congregations |
|---|---|---|
| Evangelical Protestant | 8,160 | 38 |
| Black Protestant | 5,344 | 23 |
| Mainline Protestant | 2,325 | 16 |
| Other | 2,166 | 2 |
| Catholic | 150 | 1 |
| None | 14,917 | - |
Source: Clifford Grammich, Kirk Hadaway, Richard Houseal, Dale E.Jones, Alexei Krindatch, Richie Stanley and Richard H.Taylor. 2012. 2010 U.S.Religion Census: Religious Congregations & Membership Study. Association of Statisticians of American Religious Bodies. Jones, Dale E., et al. 2002. Congregations and Membership in the United States 2000. Nashville, TN: Glenmary Research Center.
Food Environment Statistics:
| Marion County: | 3.25 / 10,000 pop. |
| State: | 1.99 / 10,000 pop. |
| This county: | 1.18 / 10,000 pop. |
| South Carolina: | 0.85 / 10,000 pop. |
| Marion County: | 7.38 / 10,000 pop. |
| South Carolina: | 5.38 / 10,000 pop. |
| This county: | 5.02 / 10,000 pop. |
| State: | 7.75 / 10,000 pop. |
| Marion County: | 14.1% |
| South Carolina: | 10.6% |
| Marion County: | 35.2% |
| State: | 29.4% |
| Here: | 15.3% |
| State: | 13.4% |
Agriculture in Marion County:
Average size of farms: 438 acresAverage value of agricultural products sold per farm: $113,412
Average value of crops sold per acre for harvested cropland: $446.42
The value of nursery, greenhouse, floriculture, and sod as a percentage of the total market value of agricultural products sold: 0.49%
The value of livestock, poultry, and their products as a percentage of the total market value of agricultural products sold: 32.31%
Average total farm production expenses per farm: $100,637
Harvested cropland as a percentage of land in farms: 39.28%
Average market value of all machinery and equipment per farm: $108,845
The percentage of farms operated by a family or individual: 92.02%
Average age of principal farm operators: 59 years
Average number of cattle and calves per 100 acres of all land in farms: 5.62
Corn for grain: 5028 harvested acres
All wheat for grain: 4512 harvested acres
Upland cotton: 4934 harvested acres
Soybeans for beans: 18304 harvested acres
Vegetables: 142 harvested acres
Land in orchards: 29 acres
Tornado activity:
Marion County historical area-adjusted tornado activity is significantly below South Carolina state average. It is 1087404.9 times below overall U.S. average.Tornadoes in this county have caused 120 injuries recorded between 1950 and 2004.
On 8/17/1965, a category 3 (max. wind speeds 158-206 mph) tornado injured 46 people and caused between $50,000 and $500,000 in damages.
Earthquake activity:
Marion County-area historical earthquake activity is significantly above South Carolina state average. It is 50% smaller than the overall U.S. average.On 8/23/2011 at 17:51:04, a magnitude 5.8 (5.8 MW, Depth: 3.7 mi, Class: Moderate, Intensity: VI - VII) earthquake occurred 271.2 miles away from Marion County center
On 11/22/1974 at 05:25:55, a magnitude 4.7 (4.7 MB, Class: Light, Intensity: IV - V) earthquake occurred 98.6 miles away from the county center
On 8/9/2020 at 12:07:37, a magnitude 5.1 (5.1 MW, Depth: 4.7 mi) earthquake occurred 188.6 miles away from the county center
On 8/2/1974 at 08:52:09, a magnitude 4.9 (4.3 MB, 4.9 LG) earthquake occurred 181.7 miles away from the county center
On 8/21/1992 at 16:31:55, a magnitude 4.4 (4.1 MB, 4.1 LG, 4.4 LG, Depth: 6.2 mi) earthquake occurred 88.7 miles away from Marion County center
On 9/25/2006 at 05:44:20, a magnitude 3.7 (3.7 ML, Depth: 3.1 mi, Class: Light, Intensity: II - III) earthquake occurred 26.7 miles away from the county center
Magnitude types: regional Lg-wave magnitude (LG), body-wave magnitude (MB), local magnitude (ML), moment magnitude (MW)
Most recent natural disasters:
- South Carolina Covid-19 Pandemic, Incident Period: January 20, 2020, FEMA Id: 4492, Natural disaster type: Other
- South Carolina Hurricane Dorian, Incident Period: August 31, 2019 - September 6, 2019, FEMA Id: 4464, Natural disaster type: Hurricane
- South Carolina Hurricane Florence, Incident Period: September 8, 2018 - October 8, 2018, FEMA Id: 4394, Natural disaster type: Hurricane
- South Carolina Hurricane Irma, Incident Period: September 6, 2017 - September 13, 2017, FEMA Id: 4346, Natural disaster type: Hurricane
- South Carolina Hurricane Matthew, Incident Period: October 04, 2016 to October 30, 2016, Emergency Declared EM-3378: October 06, 2016, FEMA Id: 3378, Natural disaster type: Hurricane
- South Carolina Hurricane Matthew, Incident Period: October 04, 2016 to October 30, 2016, Major Disaster (Presidential) Declared DR-4286: October 11, 2016, FEMA Id: 4286, Natural disaster type: Hurricane
- South Carolina Severe Storms and Flooding, Incident Period: October 01, 2015 to October 23, 2015, Emergency Declared EM-3373: October 03, 2015, FEMA Id: 3373, Natural disaster type: Storm, Flood
- South Carolina Severe Storms and Flooding, Incident Period: October 01, 2015 to October 23, 2015, Major Disaster (Presidential) Declared DR-4241: October 05, 2015, FEMA Id: 4241, Natural disaster type: Storm, Flood
- South Carolina Severe Winter Storm, Incident Period: February 10, 2014 to February 19, 2014, Emergency Declared EM-3369: February 12, 2014, FEMA Id: 3369, Natural disaster type: Winter Storm
- South Carolina Severe Winter Storm, Incident Period: February 10, 2014 to February 15, 2014, Major Disaster (Presidential) Declared DR-4166: March 12, 2014, FEMA Id: 4166, Natural disaster type: Winter Storm
- 8 other natural disasters have been reported since 1953.
The number of natural disasters in Marion County (18) is near the US average (15).
Major Disasters (Presidential) Declared: 9
Emergencies Declared: 5
Causes of natural disasters: Hurricanes: 10, Winter Storms: 3, Floods: 2, Storms: 2, Ice Storm: 1, Tropical Storm: 1, Other: 1 (Note: some incidents may be assigned to more than one category).
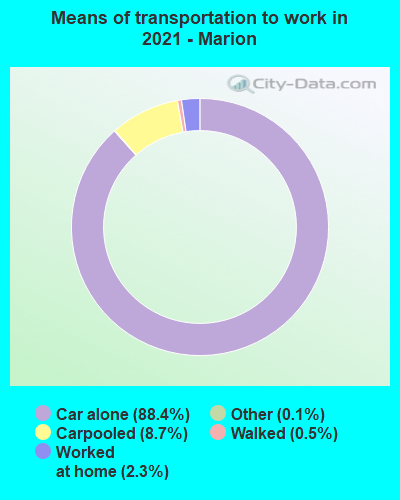
Means of transportation to work:
- Drove a car alone: 6,395 (82.3%)
- Carpooled: 856 (11.0%)
- Taxicab, motorcycle, or other means: 18 (0.2%)
- Walked: 40 (0.5%)
- Worked at home: 283 (3.6%)
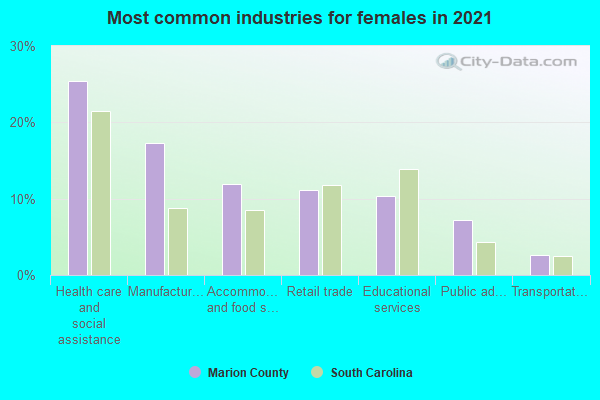
- Health care and social assistance (25%)
- Retail trade (13%)
- Manufacturing (11%)
- Accommodation and food services (10%)
- Educational services (9%)
- Public administration (6%)
- Transportation and warehousing (5%)
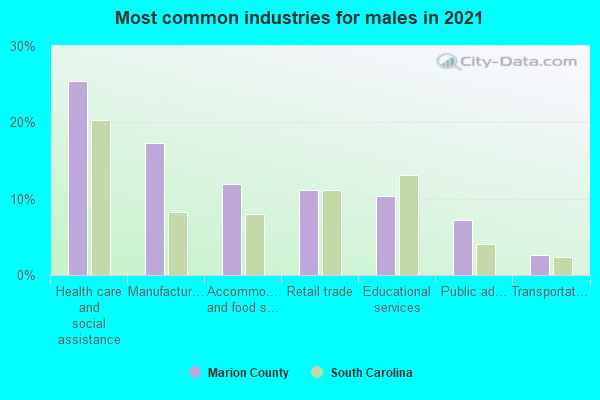
- Health care and social assistance (27%)
- Retail trade (14%)
- Manufacturing (12%)
- Accommodation and food services (11%)
- Educational services (10%)
- Public administration (7%)
- Transportation and warehousing (5%)

- Transportation occupations (18%)
- Production occupations (12%)
- Construction and extraction occupations (11%)
- Management occupations (9%)
- Material moving occupations (8%)
- Installation, maintenance, and repair occupations (7%)
- Sales and related occupations (6%)

- Office and administrative support occupations (14%)
- Sales and related occupations (14%)
- Production occupations (11%)
- Educational instruction, and library occupations (10%)
- Food preparation and serving related occupations (9%)
- Health diagnosing and treating practitioners and other technical occupations (9%)
- Healthcare support occupations (8%)
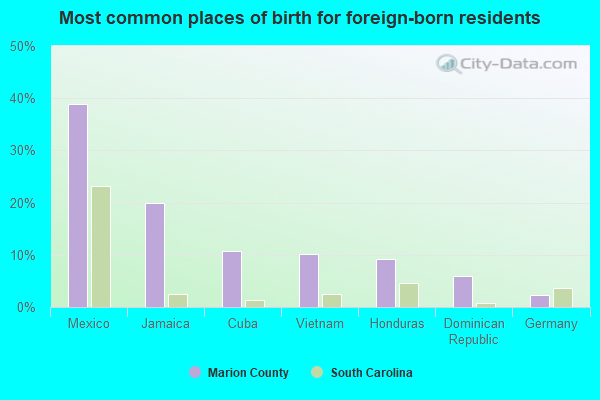
- Mexico (43%)
- Honduras (13%)
- Jamaica (10%)
- Dominican Republic (9%)
- Italy (4%)
- Vietnam (4%)
- Haiti (3%)
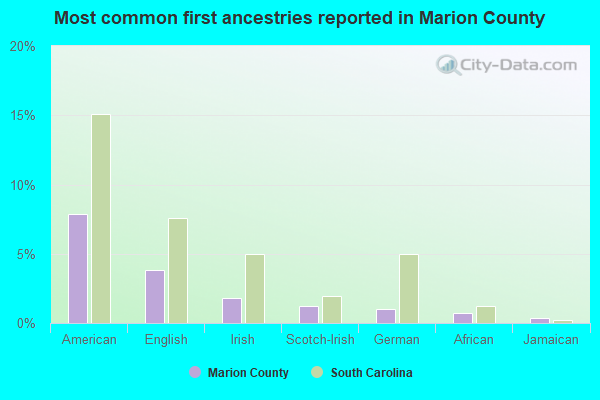
- American (8%)
- English (5%)
- Scotch-Irish (1%)
- African (1%)
- German (1%)
- Irish (1%)
- Eastern European (0%)
People in group quarters in Marion County, South Carolina in 2010:
- 178 people in nursing facilities/skilled-nursing facilities
- 13 people in group homes intended for adults
- 12 people in residential treatment centers for adults
People in group quarters in Marion County, South Carolina in 2000:
- 206 people in nursing homes
- 71 people in local jails and other confinement facilities (including police lockups)
- 29 people in state prisons
- 16 people in other noninstitutional group quarters
- 6 people in homes or halfway houses for drug/alcohol abuse
- 3 people in halfway houses
- 3 people in agriculture workers' dormitories on farms
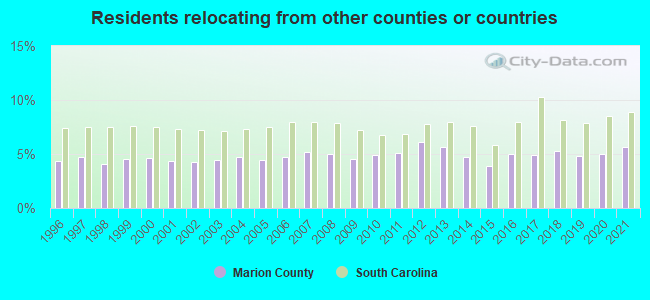
5.66% of this county's 2021 resident taxpayers lived in other counties in 2020 ($33,252 average adjusted gross income)
| Here: | 5.66% |
| South Carolina average: | 8.89% |
10 or fewer of this county's residents moved from foreign countries.
3.66% relocated from other counties in South Carolina ($20,735 average AGI)
2.00% relocated from other states ($12,517 average AGI)
Marion County: 2.00% South Carolina average: 4.96%
Top counties from which taxpayers relocated into this county between 2020 and 2021:
| from Horry County, SC | |
| from Dillon County, SC | |
| from Florence County, SC | |
| from Richland County, SC |
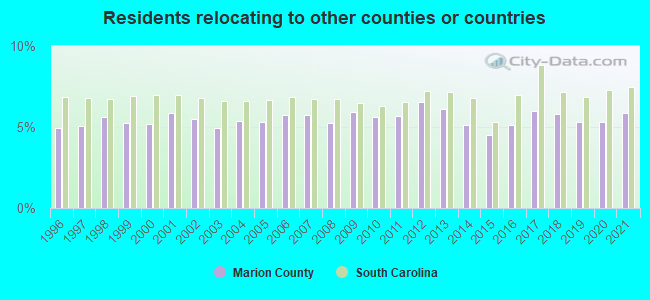
5.89% of this county's 2020 resident taxpayers moved to other counties in 2021 ($35,336 average adjusted gross income)
| Here: | 5.89% |
| South Carolina average: | 7.46% |
10 or fewer of this county's residents moved to foreign countries.
4.37% relocated to other counties in South Carolina ($25,823 average AGI)
1.52% relocated to other states ($9,513 average AGI)
Marion County: 1.52% South Carolina average: 3.47%
Top counties to which taxpayers relocated from this county between 2020 and 2021:
| to Horry County, SC | |
| to Florence County, SC | |
| to Dillon County, SC | |
| to Richland County, SC |
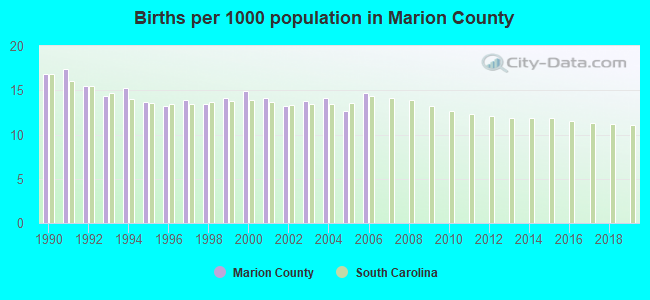
Births per 1000 population from 1990 to 1999: 14.8
Births per 1000 population from 2000 to 2006: 13.9
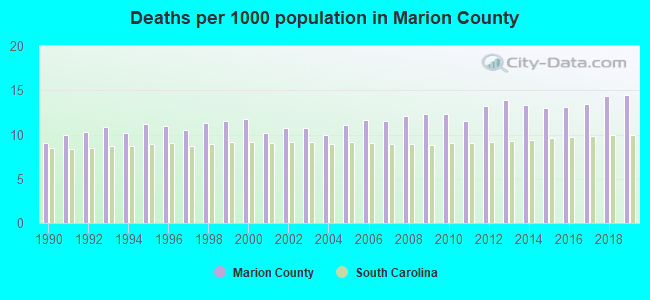
Deaths per 1000 population from 1990 to 1999: 10.6
Deaths per 1000 population from 2000 to 2009: 11.2
Deaths per 1000 population from 2010 to 2020: 13.7
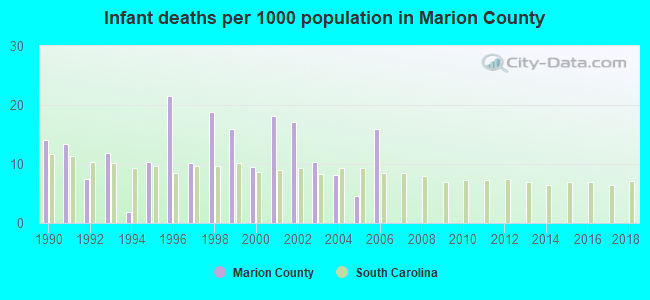
Infant deaths per 1000 live births from 1990 to 1999: 12.5
Infant deaths per 1000 live births from 2000 to 2006: 12.0
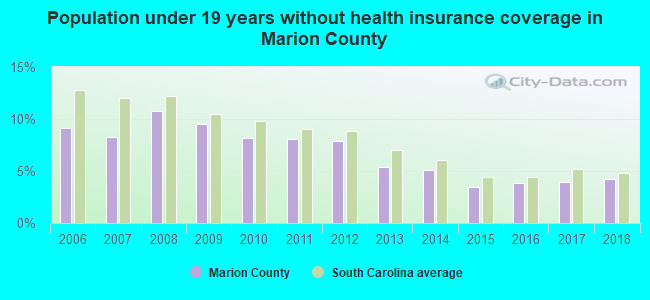
Persons under 19 years old without health insurance coverage in 2018: 4.2%
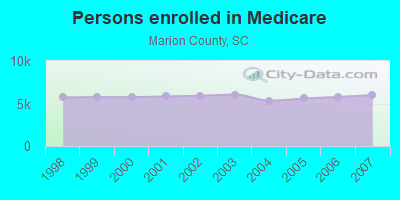
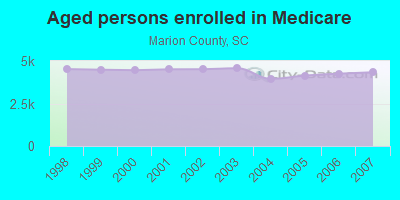
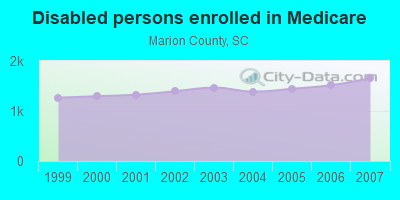
Persons enrolled in hospital insurance and/or supplemental medical insurance (Medicare) in July 1, 2007: 5,991 (4,338 aged, 1,653 disabled)
Children under 18 without health insurance coverage in 2007: 651 (7%)
Most common underlying causes of death in Marion County, South Carolina in 1999 - 2019:
- Acute myocardial infarction, unspecified (672)
- Bronchus or lung, unspecified - Malignant neoplasms (462)
- Atherosclerotic heart disease (366)
- Cardiac arrest, unspecified (307)
- Stroke, not specified as haemorrhage or infarction (267)
- Congestive heart failure (265)
- Chronic obstructive pulmonary disease, unspecified (257)
- Unspecified dementia (174)
- Alzheimer disease, unspecified (165)
- Septicaemia, unspecified (105)
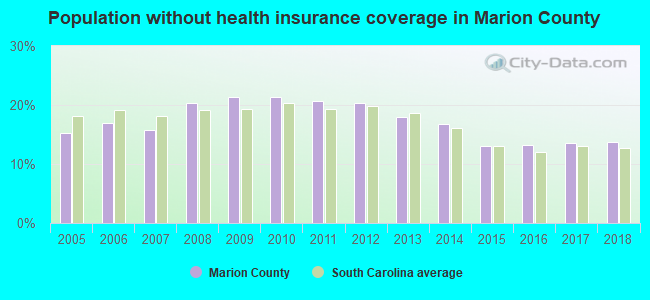
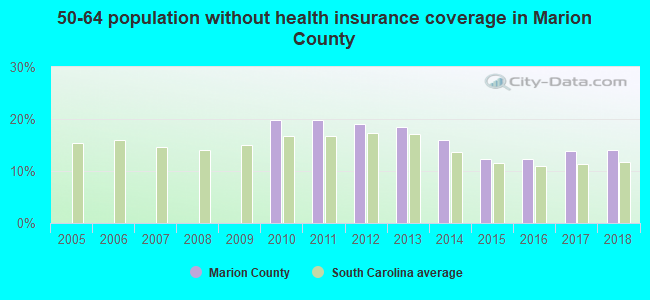
Population without health insurance coverage in 2000: 22%
Children under 18 without health insurance coverage in 2000: 19%
Short term general hospital admissions per 100,000 population in 2004: 21,687
Short term general hospital beds per 100,000 population in 2004: 353
Emergency room visits per 100,000 population in 2004: 15,570
General practice office based MDs per 100,000 population in 2005: 1,516
Medical specialist MDs per 100,000 population in 2005: 1,132
Dentists per 100,000 population in 1998: 11
Total births per 100,000 population, July 2005 - July 2006 : 14
Total deaths per 100,000 population, July 2005 - July 2006: 63
Limited-service eating places per 100,000 population in 2005 : 6
EPA green book nonattainment status in 2004-2006: 1
Crimes per 100,000 population in 1996: 1
Homicides per 1,000,000 population from 2000 to 2006: 102.6. This is more than state average.
Household type by relationship:
Households: 30,006- Male householders: 4,468 (1,675 living alone), Female householders: 7,446 (2,510 living alone)
3,644 spouses (3,644 opposite-sex spouses), 595 unmarried partners, (585 opposite-sex unmarried partners), 9,098 children (8,821 natural, 199 adopted, 57 stepchildren), 1,380 grandchildren, 534 brothers or sisters, 597 parents, 0 foster children, 894 other relatives, 911 non-relatives
- In group quarters: 210
Size of family households: 3,703 2-persons, 1,451 3-persons, 1,254 4-persons, 267 5-persons, 414 6-persons, 59 7-or-more-persons.
Size of nonfamily households: 4,188 1-person, 535 2-persons, 25 3-persons, 6 4-persons.
2,042 married couples with children.
2,922 single-parent households (96 men, 2,826 women).
96.1% of residents of Marion speak English at home.
3.3% of residents speak Spanish at home (71% speak English very well, 29% speak English well).
0.2% of residents speak other Indo-European language at home (20% speak English very well, 80% speak English well).
0.2% of residents speak Asian or Pacific Island language at home (68% speak English very well, 32% speak English well).
0.1% of residents speak other language at home (100% speak English very well).
In fiscal year 2004:
Federal Government expenditure: $318,928,000 ($9,090 per capita)
Department of Defense expenditure: $80,345,000
Federal direct payments to individuals for retirement and disability: $91,700,000
Federal other direct payments to individuals: $58,531,000
Federal direct payments not to individuals: $4,493,000
Federal grants: $82,415,000
Federal procurement contracts: $73,804,000 ($72,731,000 Department of Defense)
Federal salaries and wages: $7,985,000 ($3,427,000 Department of Defense)
Federal Government direct loans: $1,427,000
Federal guaranteed/insured loans: $1,526,000
Federal Government insurance: $22,098,000
Population change from April 1, 2000 to July 1, 2005:
Births: 2,689| Here: | 77 per 1000 residents |
| State: | 69 per 1000 residents |
Deaths: 1,973
| Here: | 57 per 1000 residents |
| State: | 46 per 1000 residents |
Net international migration: +261
| Here: | +7 per 1000 residents |
| State: | +9 per 1000 residents |
Net internal migration: -1,495
| Here: | |
| State: |
Total withdrawal of fresh water for public supply: 4.71 millions of gallons per day (all from ground)
| Here: | 6.0 |
| State: | 6.4 |
| Here: | 4.5 |
| State: | 4.5 |
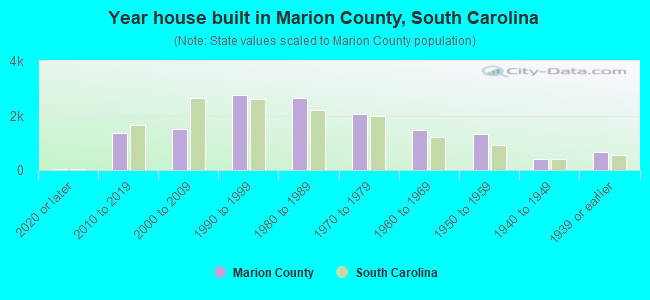
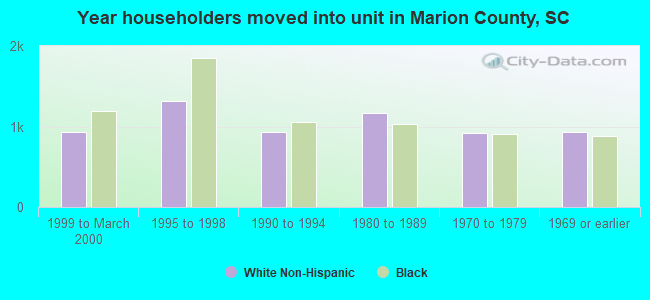
- Year house built in Marion County, South Carolina
- 952020 or later
- 1,0442010 to 2019
- 1,8262000 to 2009
- 2,8651990 to 1999
- 2,1381980 to 1989
- 2,2921970 to 1979
- 1,5271960 to 1969
- 1,3321950 to 1959
- 3061940 to 1949
- 6891939 or earlier
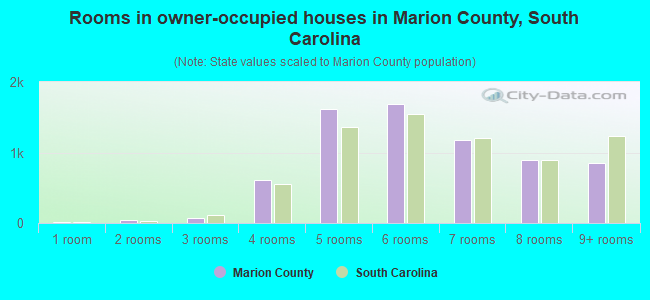
- Rooms in owner-occupied houses in Marion County, South Carolina
- 721 room
- 702 rooms
- 2563 rooms
- 7604 rooms
- 1,5525 rooms
- 1,7616 rooms
- 1,0457 rooms
- 7958 rooms
- 9219+ rooms
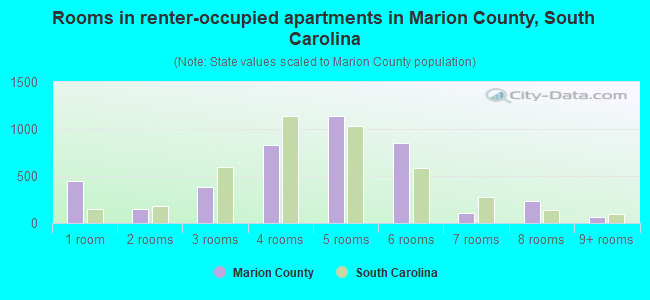
- Rooms in renter-occupied apartments in Marion County, South Carolina
- 4501 room
- 1832 rooms
- 7253 rooms
- 9434 rooms
- 1,1305 rooms
- 7006 rooms
- 1167 rooms
- 2158 rooms
- 1139+ rooms
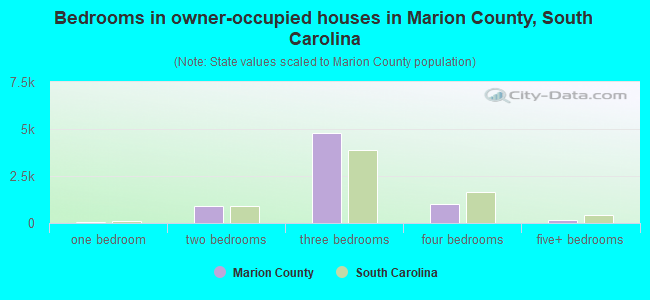
- Bedrooms in owner-occupied houses in Marion County, South Carolina
- 70no bedroom
- 921 bedroom
- 1,2112 bedrooms
- 4,5623 bedrooms
- 1,0934 bedrooms
- 1515+ bedrooms
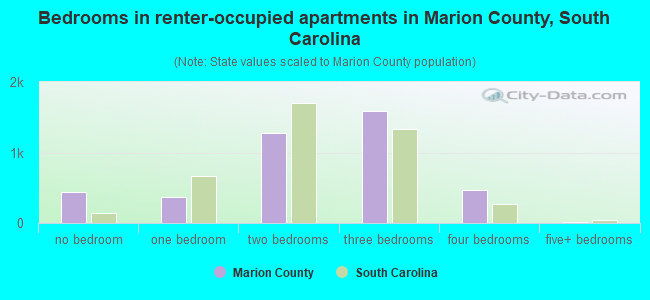
- Bedrooms in renter-occupied apartments in Marion County, South Carolina
- 458no bedroom
- 4511 bedroom
- 1,4162 bedrooms
- 1,6483 bedrooms
- 5224 bedrooms
- 495+ bedrooms
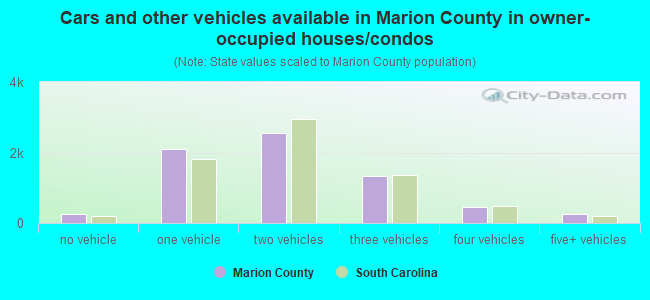
- Cars and other vehicles available in Marion County in owner-occupied houses/condos
- 359no vehicle
- 2,2331 vehicle
- 2,6822 vehicles
- 1,3073 vehicles
- 4244 vehicles
- 2155+ vehicles
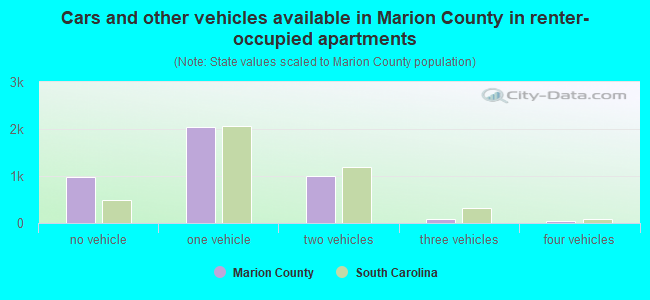
- Cars and other vehicles available in Marion County in renter-occupied apartments
- 1,009no vehicle
- 2,2371 vehicle
- 1,1832 vehicles
- 1323 vehicles
- 234 vehicles
- 05+ vehicles
93.0% of Marion County residents lived in the same house 1 years ago.
Out of people who lived in different houses, 39% lived in this county.
Out of people who lived in different counties, 53% lived in South Carolina.
| Marion County: | 93.0% |
| State average: | 86.5% |
Place of birth for U.S.-born residents:
- This state: 23,749
- Other state: 5,285
- Northeast: 1,455
- Midwest: 525
- South: 3,020
- West: 251
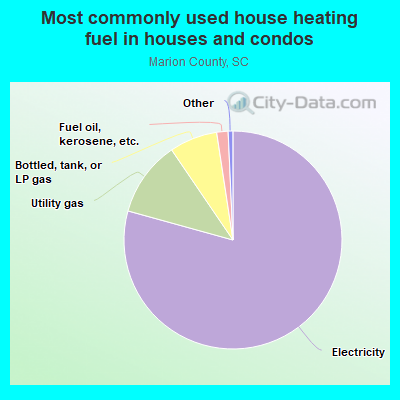
- 80.4%Electricity
- 10.1%Utility gas
- 6.5%Bottled, tank, or LP gas
- 1.4%Fuel oil, kerosene, etc.
- 1.4%No fuel used
- 0.2%Wood

- 88.8%Electricity
- 4.6%Bottled, tank, or LP gas
- 4.6%Utility gas
- 0.8%Fuel oil, kerosene, etc.
- 0.6%No fuel used
- 0.6%Wood
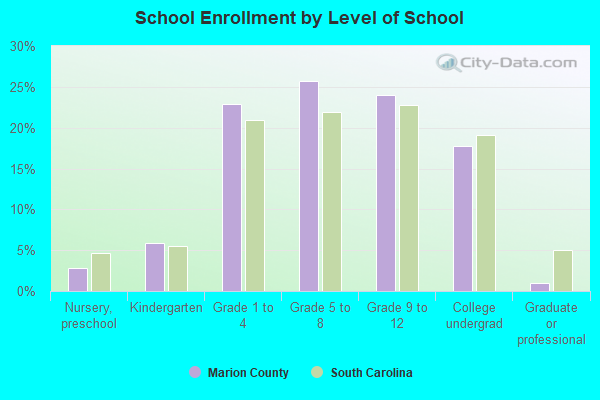
Private vs. public school enrollment:
| Here: | 8.6% |
| South Carolina: | 14.4% |
| Here: | 15.8% |
| South Carolina: | 11.1% |
| Here: | 22.2% |
| South Carolina: | 21.9% |

Marion County government finances - Expenditure in 2018:
- Bond Funds - Cash and Securities: $1,389,000
- Charges - Solid Waste Management: $1,414,000
Other: $913,000
Air Transportation: $177,000
- Construction - Local Fire Protection: $506,000
Housing and Community Development: $287,000
Regular Highways: $272,000
- Current Operations - Police Protection: $4,059,000
Correctional Institutions: $2,230,000
Health - Other: $1,599,000
Solid Waste Management: $1,507,000
Judicial and Legal Services: $1,426,000
Central Staff Services: $1,149,000
Regular Highways: $1,062,000
Financial Administration: $867,000
General - Other: $843,000
General Public Buildings: $781,000
Housing and Community Development: $738,000
Protective Inspection and Regulation - Other: $293,000
Air Transportation: $238,000
Public Welfare - Other: $99,000
Parks and Recreation: $48,000
- Federal Intergovernmental - Other: $181,000
- General - Interest on Debt: $375,000
- Intergovernmental to Local - Other - Libraries: $661,000
Other - Local Fire Protection: $553,000
Other - Parks and Recreation: $145,000
Other - General - Other: $77,000
Other - Hospitals: $36,000
Other - Police Protection: $23,000
Other - Air Transportation: $20,000
Other - Housing and Community Development: $20,000
Other - Health - Other: $14,000
- Local Intergovernmental - Public Welfare: $146,000
Other: $69,000
- Long Term Debt - Beginning Outstanding - Unspecified Public Purpose: $16,262,000
Outstanding Unspecified Public Purpose: $15,521,000
Retired Unspecified Public Purpose: $2,561,000
Issue, Unspecified Public Purpose: $1,819,000
- Miscellaneous - General Revenue - Other: $1,323,000
Fines and Forfeits: $683,000
Rents: $172,000
Sale of Property: $115,000
Interest Earnings: $39,000
- Other Capital Outlay - Parks and Recreation: $246,000
Police Protection: $211,000
Regular Highways: $139,000
Central Staff Services: $123,000
General - Other: $34,000
General Public Building: $31,000
Correctional Institutions: $9,000
Judicial and Legal Services: $9,000
Health - Other: $2,000
- Other Funds - Cash and Securities: $8,706,000
- Sinking Funds - Cash and Securities: $855,000
- State Intergovernmental - General Local Government Support: $1,267,000
Other: $516,000
Highways: $272,000
Public Welfare: $5,000
- Tax - Property: $9,615,000
General Sales and Gross Receipts: $2,909,000
Other: $544,000
Other Selective Sales: $233,000
Occupation and Business License - Other: $228,000
Public Utility License: $53,000
Documentary and Stock Transfer: $49,000
- Total Salaries and Wages: $7,159,000
Marion County government finances - Revenue in 2018:
- Bond Funds - Cash and Securities: $1,389,000
- Charges - Solid Waste Management: $1,414,000
Other: $913,000
Air Transportation: $177,000
- Construction - Local Fire Protection: $506,000
Housing and Community Development: $287,000
Regular Highways: $272,000
- Current Operations - Police Protection: $4,059,000
Correctional Institutions: $2,230,000
Health - Other: $1,599,000
Solid Waste Management: $1,507,000
Judicial and Legal Services: $1,426,000
Central Staff Services: $1,149,000
Regular Highways: $1,062,000
Financial Administration: $867,000
General - Other: $843,000
General Public Buildings: $781,000
Housing and Community Development: $738,000
Protective Inspection and Regulation - Other: $293,000
Air Transportation: $238,000
Public Welfare - Other: $99,000
Parks and Recreation: $48,000
- Federal Intergovernmental - Other: $181,000
- General - Interest on Debt: $375,000
- Intergovernmental to Local - Other - Libraries: $661,000
Other - Local Fire Protection: $553,000
Other - Parks and Recreation: $145,000
Other - General - Other: $77,000
Other - Hospitals: $36,000
Other - Police Protection: $23,000
Other - Air Transportation: $20,000
Other - Housing and Community Development: $20,000
Other - Health - Other: $14,000
- Local Intergovernmental - Public Welfare: $146,000
Other: $69,000
- Long Term Debt - Beginning Outstanding - Unspecified Public Purpose: $16,262,000
Outstanding Unspecified Public Purpose: $15,521,000
Retired Unspecified Public Purpose: $2,561,000
Issue, Unspecified Public Purpose: $1,819,000
- Miscellaneous - General Revenue - Other: $1,323,000
Fines and Forfeits: $683,000
Rents: $172,000
Sale of Property: $115,000
Interest Earnings: $39,000
- Other Capital Outlay - Parks and Recreation: $246,000
Police Protection: $211,000
Regular Highways: $139,000
Central Staff Services: $123,000
General - Other: $34,000
General Public Building: $31,000
Correctional Institutions: $9,000
Judicial and Legal Services: $9,000
Health - Other: $2,000
- Other Funds - Cash and Securities: $8,706,000
- Sinking Funds - Cash and Securities: $855,000
- State Intergovernmental - General Local Government Support: $1,267,000
Other: $516,000
Highways: $272,000
Public Welfare: $5,000
- Tax - Property: $9,615,000
General Sales and Gross Receipts: $2,909,000
Other: $544,000
Other Selective Sales: $233,000
Occupation and Business License - Other: $228,000
Public Utility License: $53,000
Documentary and Stock Transfer: $49,000
- Total Salaries and Wages: $7,159,000
Marion County government finances - Debt in 2018:
- Bond Funds - Cash and Securities: $1,389,000
- Charges - Solid Waste Management: $1,414,000
Other: $913,000
Air Transportation: $177,000
- Construction - Local Fire Protection: $506,000
Housing and Community Development: $287,000
Regular Highways: $272,000
- Current Operations - Police Protection: $4,059,000
Correctional Institutions: $2,230,000
Health - Other: $1,599,000
Solid Waste Management: $1,507,000
Judicial and Legal Services: $1,426,000
Central Staff Services: $1,149,000
Regular Highways: $1,062,000
Financial Administration: $867,000
General - Other: $843,000
General Public Buildings: $781,000
Housing and Community Development: $738,000
Protective Inspection and Regulation - Other: $293,000
Air Transportation: $238,000
Public Welfare - Other: $99,000
Parks and Recreation: $48,000
- Federal Intergovernmental - Other: $181,000
- General - Interest on Debt: $375,000
- Intergovernmental to Local - Other - Libraries: $661,000
Other - Local Fire Protection: $553,000
Other - Parks and Recreation: $145,000
Other - General - Other: $77,000
Other - Hospitals: $36,000
Other - Police Protection: $23,000
Other - Air Transportation: $20,000
Other - Housing and Community Development: $20,000
Other - Health - Other: $14,000
- Local Intergovernmental - Public Welfare: $146,000
Other: $69,000
- Long Term Debt - Beginning Outstanding - Unspecified Public Purpose: $16,262,000
Outstanding Unspecified Public Purpose: $15,521,000
Retired Unspecified Public Purpose: $2,561,000
Issue, Unspecified Public Purpose: $1,819,000
- Miscellaneous - General Revenue - Other: $1,323,000
Fines and Forfeits: $683,000
Rents: $172,000
Sale of Property: $115,000
Interest Earnings: $39,000
- Other Capital Outlay - Parks and Recreation: $246,000
Police Protection: $211,000
Regular Highways: $139,000
Central Staff Services: $123,000
General - Other: $34,000
General Public Building: $31,000
Correctional Institutions: $9,000
Judicial and Legal Services: $9,000
Health - Other: $2,000
- Other Funds - Cash and Securities: $8,706,000
- Sinking Funds - Cash and Securities: $855,000
- State Intergovernmental - General Local Government Support: $1,267,000
Other: $516,000
Highways: $272,000
Public Welfare: $5,000
- Tax - Property: $9,615,000
General Sales and Gross Receipts: $2,909,000
Other: $544,000
Other Selective Sales: $233,000
Occupation and Business License - Other: $228,000
Public Utility License: $53,000
Documentary and Stock Transfer: $49,000
- Total Salaries and Wages: $7,159,000
Marion County government finances - Cash and Securities in 2018:
- Bond Funds - Cash and Securities: $1,389,000
- Charges - Solid Waste Management: $1,414,000
Other: $913,000
Air Transportation: $177,000
- Construction - Local Fire Protection: $506,000
Housing and Community Development: $287,000
Regular Highways: $272,000
- Current Operations - Police Protection: $4,059,000
Correctional Institutions: $2,230,000
Health - Other: $1,599,000
Solid Waste Management: $1,507,000
Judicial and Legal Services: $1,426,000
Central Staff Services: $1,149,000
Regular Highways: $1,062,000
Financial Administration: $867,000
General - Other: $843,000
General Public Buildings: $781,000
Housing and Community Development: $738,000
Protective Inspection and Regulation - Other: $293,000
Air Transportation: $238,000
Public Welfare - Other: $99,000
Parks and Recreation: $48,000
- Federal Intergovernmental - Other: $181,000
- General - Interest on Debt: $375,000
- Intergovernmental to Local - Other - Libraries: $661,000
Other - Local Fire Protection: $553,000
Other - Parks and Recreation: $145,000
Other - General - Other: $77,000
Other - Hospitals: $36,000
Other - Police Protection: $23,000
Other - Air Transportation: $20,000
Other - Housing and Community Development: $20,000
Other - Health - Other: $14,000
- Local Intergovernmental - Public Welfare: $146,000
Other: $69,000
- Long Term Debt - Beginning Outstanding - Unspecified Public Purpose: $16,262,000
Outstanding Unspecified Public Purpose: $15,521,000
Retired Unspecified Public Purpose: $2,561,000
Issue, Unspecified Public Purpose: $1,819,000
- Miscellaneous - General Revenue - Other: $1,323,000
Fines and Forfeits: $683,000
Rents: $172,000
Sale of Property: $115,000
Interest Earnings: $39,000
- Other Capital Outlay - Parks and Recreation: $246,000
Police Protection: $211,000
Regular Highways: $139,000
Central Staff Services: $123,000
General - Other: $34,000
General Public Building: $31,000
Correctional Institutions: $9,000
Judicial and Legal Services: $9,000
Health - Other: $2,000
- Other Funds - Cash and Securities: $8,706,000
- Sinking Funds - Cash and Securities: $855,000
- State Intergovernmental - General Local Government Support: $1,267,000
Other: $516,000
Highways: $272,000
Public Welfare: $5,000
- Tax - Property: $9,615,000
General Sales and Gross Receipts: $2,909,000
Other: $544,000
Other Selective Sales: $233,000
Occupation and Business License - Other: $228,000
Public Utility License: $53,000
Documentary and Stock Transfer: $49,000
- Total Salaries and Wages: $7,159,000
Supplemental Security Income (SSI) in 2006:
- Total number of recipients: 1,722
- Number of aged recipients: 281
- Number of blind and disabled recipients: 1,441
- Number of recipients under 18: 244
- Number of recipients between 18 and 64: 920
- Number of recipients older than 64: 558
- Number of recipients also receiving OASDI: 787
- Amount of payments (thousands of dollars): 670
| Most common first names in Marion County, SC among deceased individuals | ||
| Name | Count | Lived (average) |
|---|---|---|
| James | 313 | 68.9 years |
| Mary | 268 | 76.5 years |
| William | 247 | 70.9 years |
| John | 238 | 71.5 years |
| Robert | 162 | 69.2 years |
| Willie | 157 | 68.9 years |
| Annie | 139 | 77.0 years |
| George | 120 | 71.6 years |
| Henry | 105 | 70.2 years |
| Joseph | 89 | 69.5 years |
| Most common last names in Marion County, SC among deceased individuals | ||
| Last name | Count | Lived (average) |
|---|---|---|
| Davis | 289 | 70.5 years |
| Johnson | 250 | 72.8 years |
| Smith | 213 | 73.6 years |
| Williams | 201 | 71.1 years |
| Rogers | 187 | 73.2 years |
| Lewis | 145 | 73.7 years |
| Brown | 139 | 70.7 years |
| Jones | 122 | 75.6 years |
| Legette | 110 | 68.9 years |
| Collins | 109 | 72.0 years |
| Businesses in Marion County, SC | ||||
| Name | Count | Name | Count | |
|---|---|---|---|---|
| AT&T | 1 | McDonald's | 1 | |
| Ace Hardware | 1 | New Balance | 1 | |
| Advance Auto Parts | 1 | Nike | 3 | |
| Arby's | 1 | Payless | 1 | |
| AutoZone | 1 | Pizza Hut | 2 | |
| Burger King | 2 | RadioShack | 1 | |
| CVS | 2 | Subway | 3 | |
| Comfort Inn | 1 | T-Mobile | 1 | |
| Decora Cabinetry | 2 | True Value | 1 | |
| FedEx | 2 | U-Haul | 4 | |
| H&R Block | 2 | UPS | 2 | |
| Hardee's | 1 | Walgreens | 1 | |
| KFC | 1 | Walmart | 1 | |
| Lane Furniture | 3 | Wendy's | 1 | |
| MasterBrand Cabinets | 2 | |||