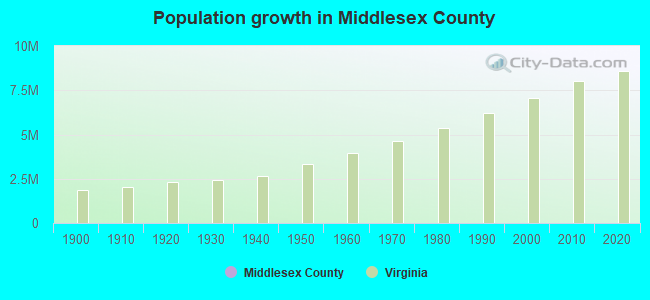
Middlesex County, Virginia (VA)
County owner-occupied free and clear houses and condos in 2010: 1,699
County owner-occupied houses and condos in 2000: 3,530
Renter-occupied apartments: 920 (it was 723 in 2000)
| % of renters here: | 17% |
| State: | 33% |
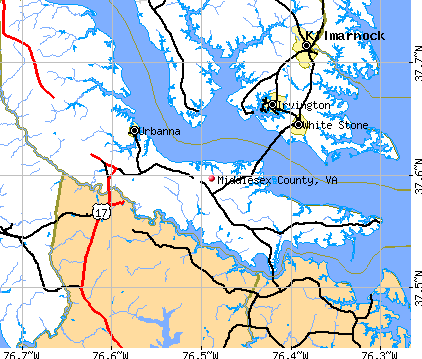
Land area: 130 sq. mi.
Water area: 80.5 sq. mi.
Population density: 83 people per square mile (average).
Industries providing employment: Educational, health and social services (22.9%), Retail trade (15.9%).
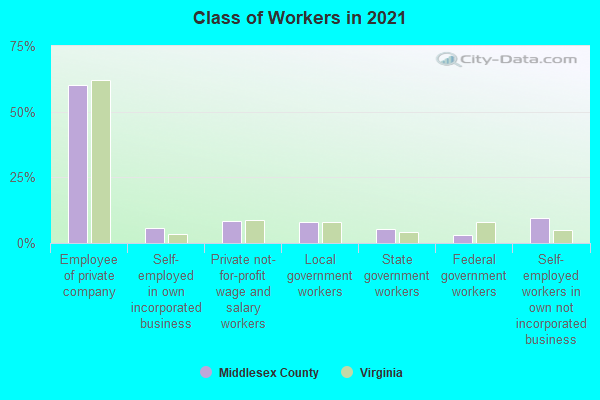
Type of workers:
- Private wage or salary: 75%
- Government: 17%
- Self-employed, not incorporated: 8%
- Unpaid family work: 0%
- OSM Map
- General Map
- Google Map
- MSN Map

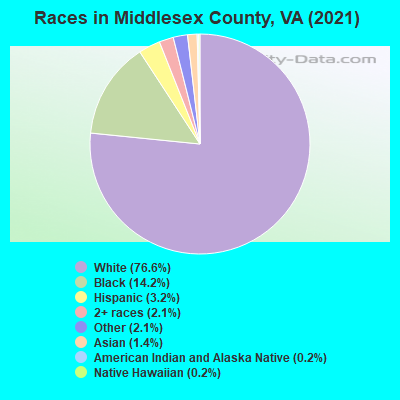
- 8,21876.4%White Non-Hispanic Alone
- 1,53914.3%Black Non-Hispanic Alone
- 3513.3%Hispanic or Latino
- 2912.7%Two or more races
- 2452.3%Some other race alone
- 860.8%Asian alone
- 240.2%Native Hawaiian and Other
Pacific Islander alone
| Median resident age: | 55.3 years |
| Virginia median age: | 39.0 years |
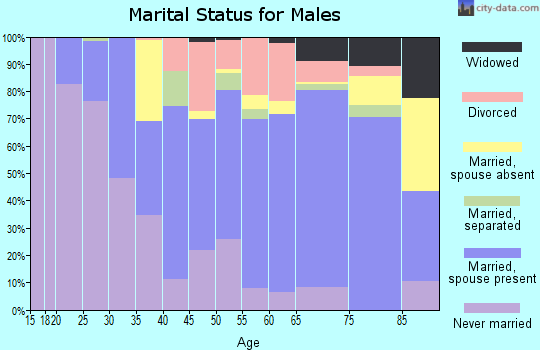
| Males: 5,398 | |
| Females: 5,413 |

 | politics in N Arlington (35 replies) |
| Any Safe Suburbs around Fredericksburg, VA? (15 replies) |
| NoVA or NJ? (24 replies) |
| moving back to virginia (3 replies) |
| Middlesex County: | 2.0 people |
| Virginia: | 3 people |
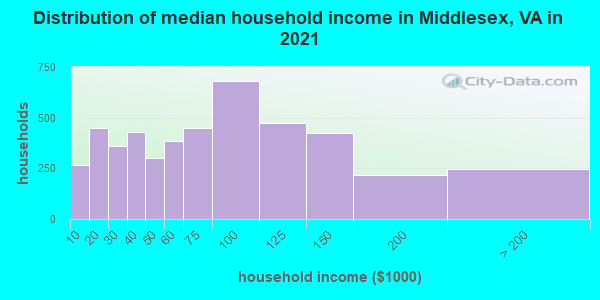
Estimated median household income in 2022: $68,294 ($36,875 in 1999)
| This county: | $68,294 |
| Virginia: | $85,873 |
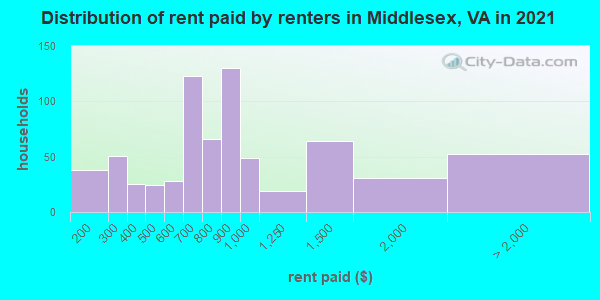
Median contract rent in 2022 for apartments: $872 (lower quartile is $679, upper quartile is $974)
| This county: | $872 |
| State: | $1270 |
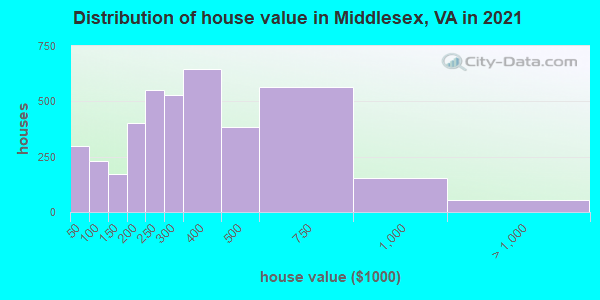
Estimated median house or condo value in 2022: $310,920 (it was $110,400 in 2000)
| Middlesex: | $310,920 |
| Virginia: | $365,700 |
Mean price in 2022:
Median monthly housing costs for homes and condos with a mortgage: $1,356Detached houses: $418,192
Here: $418,192 State: $472,865 Townhouses or other attached units: $447,090
Here: $447,090 State: $457,437 In 5-or-more-unit structures: $160,416
Here: $160,416 State: $382,551 Mobile homes: $166,809
Here: $166,809 State: $100,736
Median monthly housing costs for units without a mortgage: $483
Institutionalized population: 350
Crime in 2021 (reported by the sheriff's office or county police, not the county total):
- Murders: 0
- Rapes: 7
- Robberies: 1
- Assaults: 6
- Burglaries: 16
- Thefts: 71
- Auto thefts: 9
Crime in 2020 (reported by the sheriff's office or county police, not the county total):
- Murders: 0
- Rapes: 6
- Robberies: 0
- Assaults: 12
- Burglaries: 14
- Thefts: 74
- Auto thefts: 6
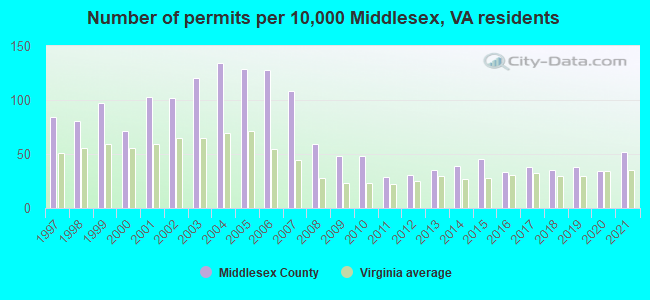
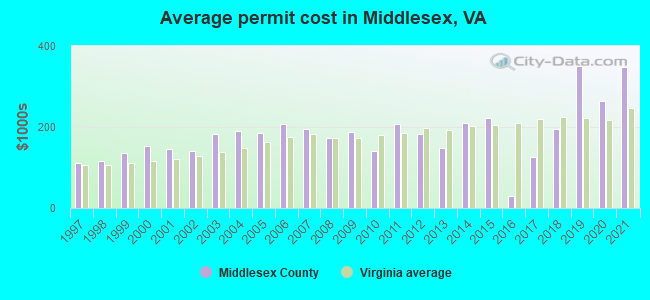
Single-family new house construction building permits:
- 2022: 45 buildings, average cost: $260,400
- 2021: 52 buildings, average cost: $347,000
- 2020: 34 buildings, average cost: $265,400
- 2019: 38 buildings, average cost: $351,300
- 2018: 35 buildings, average cost: $195,200
- 2017: 38 buildings, average cost: $125,000
- 2016: 33 buildings, average cost: $30,300
- 2015: 45 buildings, average cost: $221,600
- 2014: 39 buildings, average cost: $209,100
- 2013: 35 buildings, average cost: $146,900
- 2012: 31 buildings, average cost: $183,200
- 2011: 29 buildings, average cost: $206,900
- 2010: 48 buildings, average cost: $140,900
- 2009: 48 buildings, average cost: $187,400
- 2008: 59 buildings, average cost: $172,100
- 2007: 107 buildings, average cost: $195,900
- 2006: 127 buildings, average cost: $207,600
- 2005: 128 buildings, average cost: $183,800
- 2004: 133 buildings, average cost: $189,600
- 2003: 119 buildings, average cost: $182,800
- 2002: 101 buildings, average cost: $140,100
- 2001: 102 buildings, average cost: $145,000
- 2000: 71 buildings, average cost: $151,700
- 1999: 96 buildings, average cost: $135,500
- 1998: 80 buildings, average cost: $114,500
- 1997: 83 buildings, average cost: $111,600
Median real estate property taxes paid for housing units with mortgages in 2022: $1,498 (0.5%)
Median real estate property taxes paid for housing units with no mortgage in 2022: $1,777 (0.6%)
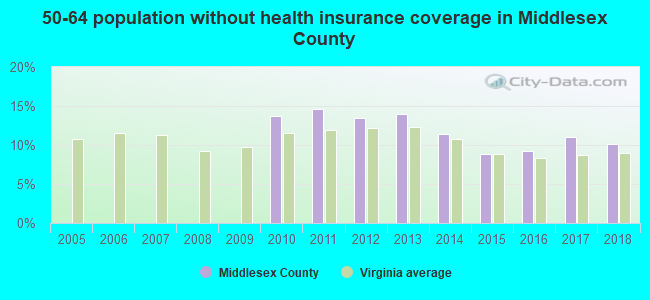
| Middlesex County: | 10.2% |
| Virginia: | 10.6% |
Median age of residents in 2022: 55.3 years old
(Males: 54.3 years old, Females: 57.3 years old)
(Median age for: White residents: 57.3 years old, Black residents: 56.0 years old, Asian residents: 20.1 years old, Hispanic or Latino residents: 28.4 years old, Other race residents: 20.7 years old)
Fair market rent in 2006 for a 1-bedroom apartment in Middlesex County is $477 a month.
Fair market rent for a 2-bedroom apartment is $581 a month.
Fair market rent for a 3-bedroom apartment is $708 a month.
Cities in this county include: Deltaville, Saluda, Urbanna.
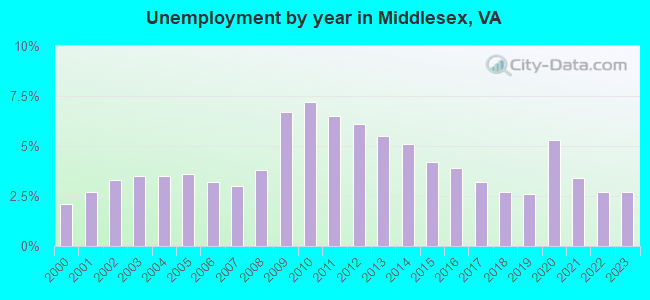
| Here: | 2.3% |
| Virginia: | 2.7% |
Current college students: 310
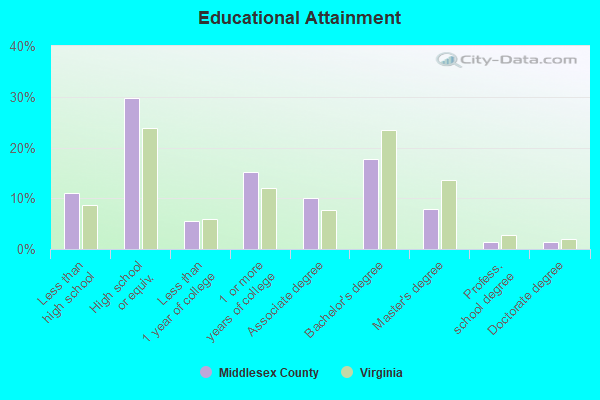
People 25 years of age or older with a high school degree or higher: 89.4%
People 25 years of age or older with a bachelor's degree or higher: 29.6%
Number of foreign born residents: 386 (57.2% naturalized citizens)
| Middlesex County: | 3.6% |
| Whole state: | 12.7% |

- Year of entry for the foreign-born population
- 1922010 or later
- 452000 to 2009
- 821990 to 1999
- 221980 to 1989
- 171970 to 1979
- 71Before 1970
Mean travel time to work (commute): minutes
Percentage of county residents living and working in this county: 100.1%
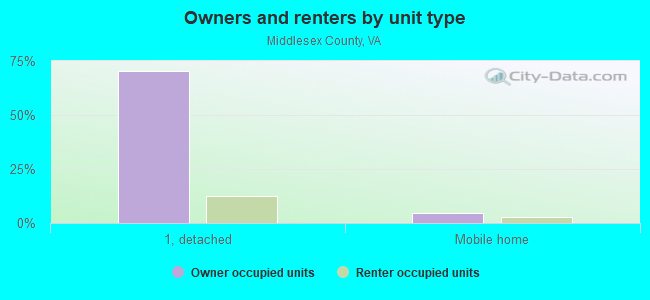
Housing units in structures:
- One, detached: 6,133
- One, attached: 149
- Two: 69
- 3 or 4: 117
- 5 to 9: 113
- 10 to 19: 14
- 50 or more: 8
- Mobile homes: 613
Housing units in Middlesex County with a mortgage: 1,991 (185 second mortgage, 0 home equity loan, 169 both second mortgage and home equity loan)
Houses without a mortgage: 185
| Here: | 0.5% with mortgage |
| State: | 97.2% with mortgage |
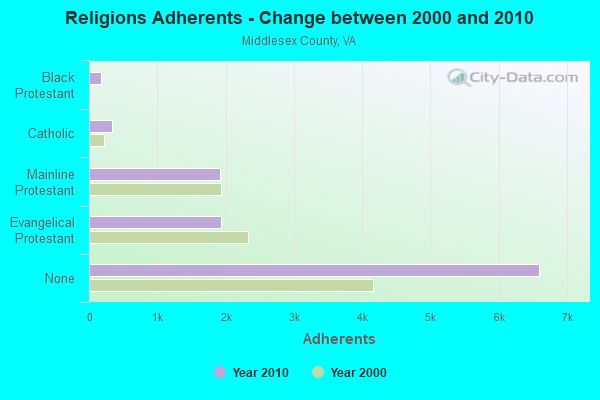
Religion statistics for Middlesex County
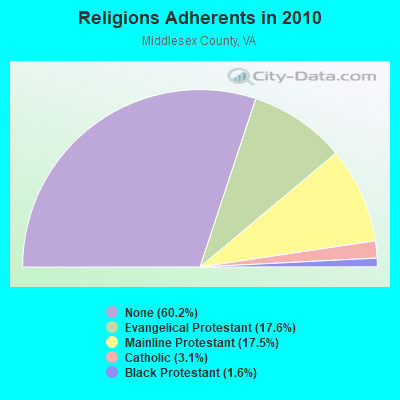
| Religion | Adherents | Congregations |
|---|---|---|
| Evangelical Protestant | 1,931 | 11 |
| Mainline Protestant | 1,919 | 6 |
| Catholic | 341 | 1 |
| Black Protestant | 170 | 1 |
| Other | 2 | - |
| None | 6,596 | - |
Source: Clifford Grammich, Kirk Hadaway, Richard Houseal, Dale E.Jones, Alexei Krindatch, Richie Stanley and Richard H.Taylor. 2012. 2010 U.S.Religion Census: Religious Congregations & Membership Study. Association of Statisticians of American Religious Bodies. Jones, Dale E., et al. 2002. Congregations and Membership in the United States 2000. Nashville, TN: Glenmary Research Center.
Food Environment Statistics:
| Middlesex County: | 4.73 / 10,000 pop. |
| State: | 2.03 / 10,000 pop. |
| This county: | 0.95 / 10,000 pop. |
| Virginia: | 1.43 / 10,000 pop. |
| Middlesex County: | 7.56 / 10,000 pop. |
| Virginia: | 4.03 / 10,000 pop. |
| This county: | 12.29 / 10,000 pop. |
| State: | 7.65 / 10,000 pop. |
| Middlesex County: | 11.1% |
| Virginia: | 9.3% |
| Middlesex County: | 26.4% |
| State: | 26.7% |
| Here: | 19.6% |
| State: | 18.6% |
Agriculture in Middlesex County:
Average size of farms: 210 acresAverage value of agricultural products sold per farm: $51,556
Average value of crops sold per acre for harvested cropland: $330.46
The value of nursery, greenhouse, floriculture, and sod as a percentage of the total market value of agricultural products sold: 1.19%
The value of livestock, poultry, and their products as a percentage of the total market value of agricultural products sold: 10.80%
Average total farm production expenses per farm: $48,543
Harvested cropland as a percentage of land in farms: 66.25%
Irrigated harvested cropland as a percentage of land in farms: 4.63%
Average market value of all machinery and equipment per farm: $53,489
The percentage of farms operated by a family or individual: 86.14%
Average age of principal farm operators: 58 years
Average number of cattle and calves per 100 acres of all land in farms: 4.75
Corn for grain: 5734 harvested acres
All wheat for grain: 2404 harvested acres
Soybeans for beans: 6172 harvested acres
Land in orchards: 43 acres
Earthquake activity:
Middlesex County-area historical earthquake activity is significantly above Virginia state average. It is 61% smaller than the overall U.S. average.On 8/23/2011 at 17:51:04, a magnitude 5.8 (5.8 MW, Depth: 3.7 mi, Class: Moderate, Intensity: VI - VII) earthquake occurred 82.1 miles away from Middlesex County center
On 12/9/2003 at 20:59:14, a magnitude 4.5 (4.5 MB, 4.5 LG, Class: Light, Intensity: IV - V) earthquake occurred 77.5 miles away from the county center
On 8/25/2011 at 05:07:52, a magnitude 4.5 (4.5 ML, Depth: 4.2 mi) earthquake occurred 84.4 miles away from the county center
On 12/9/2003 at 20:59:18, a magnitude 4.5 (4.5 ML, Depth: 6.2 mi) earthquake occurred 89.0 miles away from the county center
On 8/24/2011 at 00:04:36, a magnitude 4.2 (4.2 ML) earthquake occurred 83.1 miles away from Middlesex County center
On 8/9/2020 at 12:07:37, a magnitude 5.1 (5.1 MW, Depth: 4.7 mi) earthquake occurred 265.7 miles away from the county center
Magnitude types: regional Lg-wave magnitude (LG), body-wave magnitude (MB), local magnitude (ML), moment magnitude (MW)
Most recent natural disasters:
- Virginia Covid-19 Pandemic, Incident Period: January 20, 2020, Major Disaster (Presidential) Declared DR-4512-VA: April 2, 2020, FEMA Id: 4512, Natural disaster type: Other
- Virginia Tropical Storm Michael, Incident Period: October 9, 2018 - October 16, 2018, FEMA Id: 4411, Natural disaster type: Tropical Storm
- Virginia Hurricane Sandy, Incident Period: October 26, 2012 to November 01, 2012, Emergency Declared EM-3359: October 29, 2012, FEMA Id: 3359, Natural disaster type: Hurricane
- Virginia Hurricane Irene, Incident Period: August 26, 2011 to September 04, 2011, Emergency Declared EM-3329: August 26, 2011, FEMA Id: 3329, Natural disaster type: Hurricane
- Virginia Hurricane Irene, Incident Period: August 26, 2011 to August 28, 2011, Major Disaster (Presidential) Declared DR-4024: September 03, 2011, FEMA Id: 4024, Natural disaster type: Hurricane
- Virginia Severe Storms and Flooding, Including Severe Storms and Flooding Associated with Tropical Depression Ernesto, Incident Period: August 29, 2006 to September 07, 2006, Major Disaster (Presidential) Declared DR-1661: September 22, 2006, FEMA Id: 1661, Natural disaster type: Storm, Flood, Tropical Depression
- Virginia Hurricane Katrina Evacuation, Incident Period: August 29, 2005 to October 01, 2005, Emergency Declared EM-3240: September 12, 2005, FEMA Id: 3240, Natural disaster type: Hurricane
- Virginia Hurricane Isabel, Incident Period: September 18, 2003 to October 01, 2003, Major Disaster (Presidential) Declared DR-1491: September 18, 2003, FEMA Id: 1491, Natural disaster type: Hurricane
- Virginia Winter Storm, Incident Period: January 25, 2000 to January 30, 2000, Major Disaster (Presidential) Declared DR-1318: February 28, 2000, FEMA Id: 1318, Natural disaster type: Winter Storm
- Virginia Hurricane Floyd, Incident Period: September 13, 1999 to September 26, 1999, Major Disaster (Presidential) Declared DR-1293: September 18, 1999, FEMA Id: 1293, Natural disaster type: Hurricane
- 8 other natural disasters have been reported since 1953.
The number of natural disasters in Middlesex County (18) is near the US average (15).
Major Disasters (Presidential) Declared: 11
Emergencies Declared: 6
Causes of natural disasters: Hurricanes: 8, Floods: 3, Storms: 3, Tropical Storms: 2, Winter Storms: 2, Blizzard: 1, Drought: 1, Ice Storm: 1, Tropical Depression: 1, Other: 1 (Note: some incidents may be assigned to more than one category).
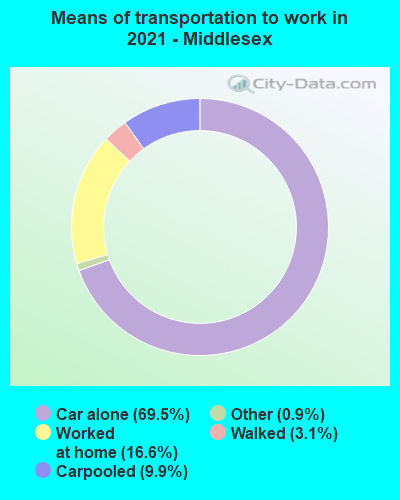
Means of transportation to work:
- Drove a car alone: 2,445 (64.9%)
- Carpooled: 294 (7.8%)
- Taxicab, motorcycle, or other means: 48 (1.3%)
- Walked: 101 (2.7%)
- Worked at home: 983 (26.1%)

- Health care and social assistance (18%)
- Retail trade (16%)
- Educational services (14%)
- Other services, except public administration (7%)
- Professional, scientific, and technical services (6%)
- Finance and insurance (4%)
- Real estate and rental and leasing (4%)
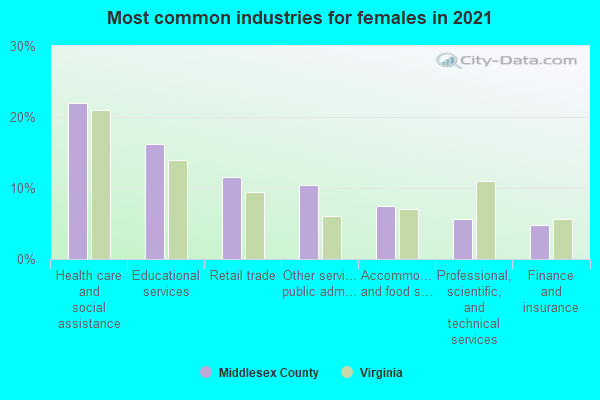
- Health care and social assistance (20%)
- Retail trade (19%)
- Educational services (16%)
- Other services, except public administration (8%)
- Professional, scientific, and technical services (7%)
- Finance and insurance (5%)
- Real estate and rental and leasing (5%)

- Management occupations (16%)
- Sales and related occupations (15%)
- Installation, maintenance, and repair occupations (11%)
- Construction and extraction occupations (10%)
- Production occupations (7%)
- Transportation occupations (5%)
- Material moving occupations (4%)
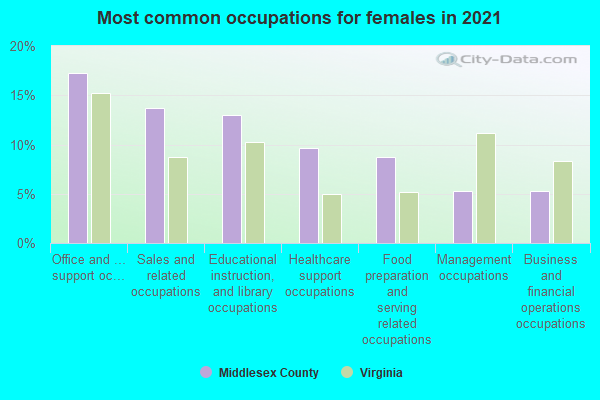
- Sales and related occupations (20%)
- Office and administrative support occupations (18%)
- Educational instruction, and library occupations (13%)
- Management occupations (7%)
- Healthcare support occupations (6%)
- Food preparation and serving related occupations (5%)
- Personal care and service occupations (4%)
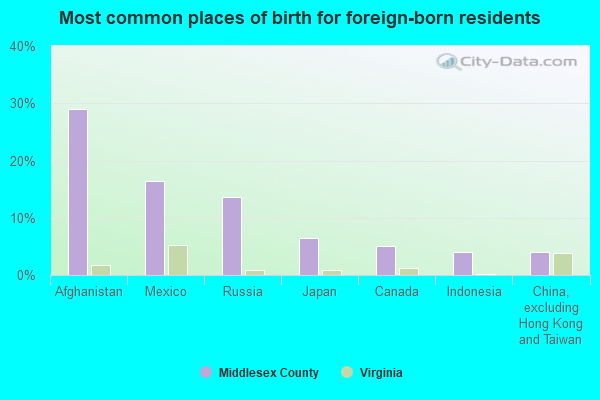
- El Salvador (22%)
- Afghanistan (16%)
- Mexico (14%)
- Russia (12%)
- Oceania, n.e.c. (8%)
- Germany (5%)
- Canada (3%)
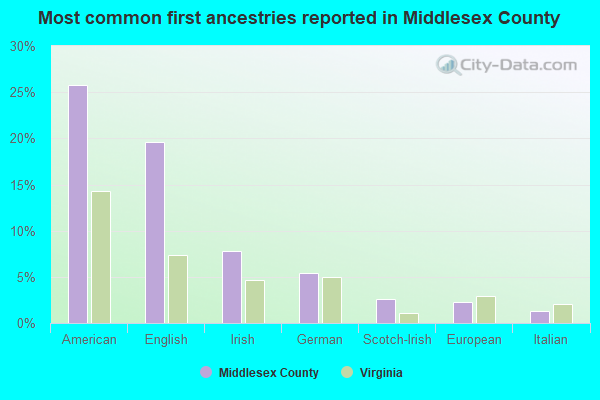
- American (29%)
- English (19%)
- Irish (9%)
- German (4%)
- European (2%)
- Scotch-Irish (2%)
- Scottish (1%)

People in group quarters in Middlesex County, Virginia in 2010:
- 235 people in local jails and other municipal confinement facilities
- 115 people in nursing facilities/skilled-nursing facilities
- 26 people in workers' group living quarters and job corps centers
- 11 people in group homes intended for adults
- 6 people in residential treatment centers for adults
People in group quarters in Middlesex County, Virginia in 2000:
- 136 people in local jails and other confinement facilities (including police lockups)
- 115 people in nursing homes
- 8 people in homes for the mentally retarded
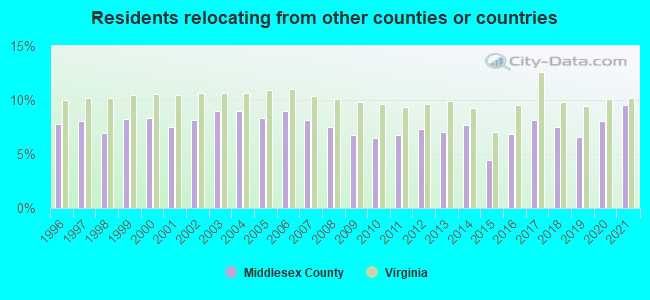
9.52% of this county's 2021 resident taxpayers lived in other counties in 2020 ($82,429 average adjusted gross income)
| Here: | 9.52% |
| Virginia average: | 10.16% |
10 or fewer of this county's residents moved from foreign countries.
7.73% relocated from other counties in Virginia ($69,981 average AGI)
1.78% relocated from other states ($12,448 average AGI)
Middlesex County: 1.78% Virginia average: 3.91%
Top counties from which taxpayers relocated into this county between 2020 and 2021:
| from Gloucester County, VA | |
| from Henrico County, VA | |
| from Chesterfield County, VA | |
| from Richmond city, VA |
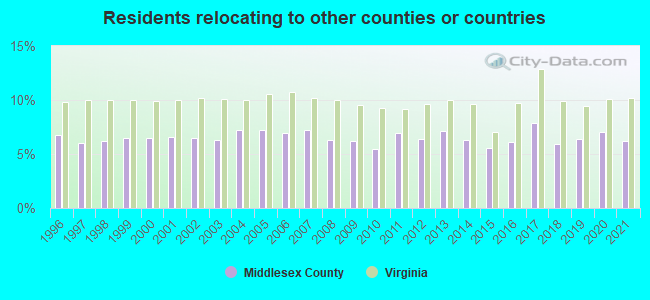
6.17% of this county's 2020 resident taxpayers moved to other counties in 2021 ($55,735 average adjusted gross income)
| Here: | 6.17% |
| Virginia average: | 10.20% |
10 or fewer of this county's residents moved to foreign countries.
4.89% relocated to other counties in Virginia ($40,879 average AGI)
1.29% relocated to other states ($14,856 average AGI)
Middlesex County: 1.29% Virginia average: 3.98%
Top counties to which taxpayers relocated from this county between 2020 and 2021:
| to Gloucester County, VA |
Births per 1000 population from 1990 to 1999: 8.5
Births per 1000 population from 2000 to 2006: 7.4

Deaths per 1000 population from 1990 to 1999: 13.9
Deaths per 1000 population from 2000 to 2009: 13.6
Deaths per 1000 population from 2010 to 2020: 15.1

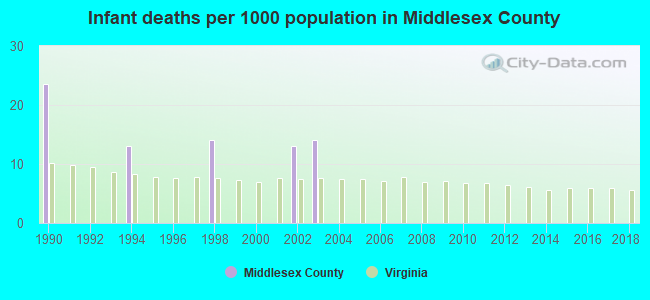
Infant deaths per 1000 live births from 1990 to 1999: 5.1
Infant deaths per 1000 live births from 2000 to 2006: 3.9
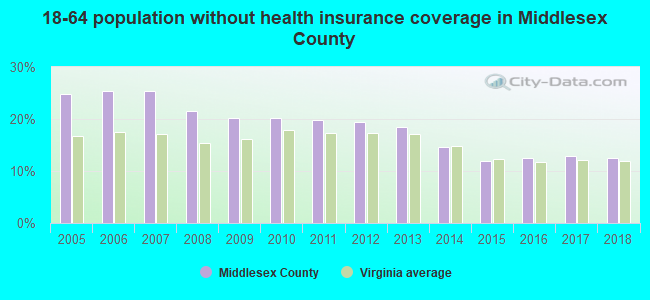
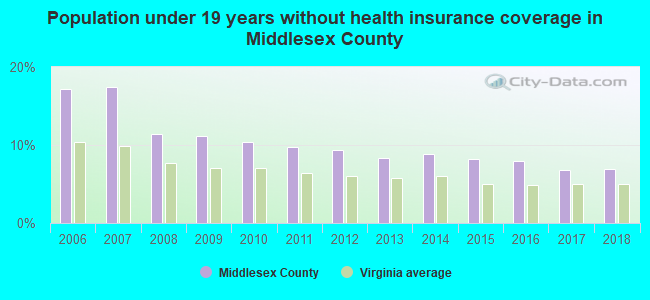
Persons under 19 years old without health insurance coverage in 2018: 6.9%
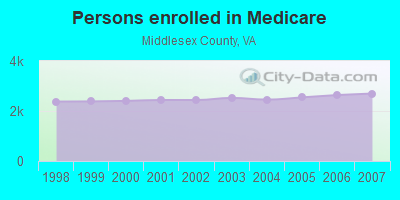
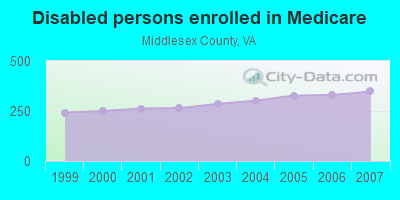
Persons enrolled in hospital insurance and/or supplemental medical insurance (Medicare) in July 1, 2007: 2,699 (2,351 aged, 348 disabled)
Children under 18 without health insurance coverage in 2007: 293 (16%)

Most common underlying causes of death in Middlesex County, Virginia in 1999 - 2019:
- Bronchus or lung, unspecified - Malignant neoplasms (197)
- Acute myocardial infarction, unspecified (127)
- Atherosclerotic heart disease (62)
- Alzheimer disease, unspecified (53)
- Stroke, not specified as haemorrhage or infarction (37)
- Unspecified dementia (21)
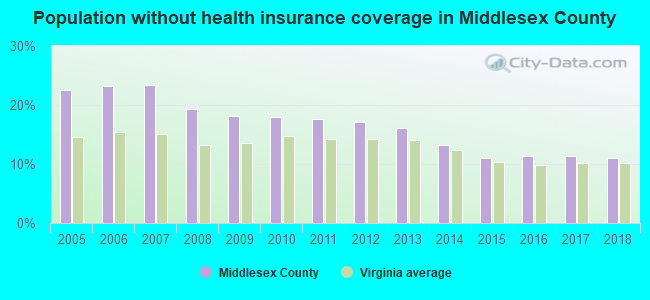
Population without health insurance coverage in 2000: 10%
Children under 18 without health insurance coverage in 2000: 7%
Medical specialist MDs per 100,000 population in 2005: 1,401
Dentists per 100,000 population in 1998: 10
Total births per 100,000 population, July 2005 - July 2006 : 42
Total deaths per 100,000 population, July 2005 - July 2006: 38
Limited-service eating places per 100,000 population in 2005 : 19
Household type by relationship:
Households: 10,811- Male householders: 2,453 (749 living alone), Female householders: 2,390 (742 living alone)
2,489 spouses (2,433 opposite-sex spouses), 341 unmarried partners, (341 opposite-sex unmarried partners), 1,844 children (1,792 natural, 21 adopted, 34 stepchildren), 223 grandchildren, 57 brothers or sisters, 60 parents, 12 foster children, 213 other relatives, 354 non-relatives
- In group quarters: 401
Size of family households: 1,973 2-persons, 524 3-persons, 300 4-persons, 143 5-persons, 122 6-persons, 17 7-or-more-persons.
Size of nonfamily households: 1,490 1-person, 242 2-persons, 35 3-persons, 14 4-persons.
789 married couples with children.
446 single-parent households (180 men, 266 women).
96.0% of residents of Middlesex speak English at home.
2.6% of residents speak Spanish at home (66% speak English very well, 19% speak English well, 16% speak English not well).
1.5% of residents speak other Indo-European language at home (65% speak English very well, 28% speak English well, 7% don't speak English at all).
0.5% of residents speak Asian or Pacific Island language at home (100% speak English very well).
0.1% of residents speak other language at home (100% speak English very well).
In fiscal year 2004:
Federal Government expenditure: $74,653,000 ($7,117 per capita)
Department of Defense expenditure: $8,562,000
Federal direct payments to individuals for retirement and disability: $44,327,000
Federal other direct payments to individuals: $15,797,000
Federal direct payments not to individuals: $3,106,000
Federal grants: $5,965,000
Federal procurement contracts: $3,724,000 ($3,325,000 Department of Defense)
Federal salaries and wages: $1,734,000 ($289,000 Department of Defense)
Federal Government direct loans: $1,033,000
Federal guaranteed/insured loans: $1,278,000
Federal Government insurance: $62,094,000
Population change from April 1, 2000 to July 1, 2005:
Births: 390| Here: | 37 per 1000 residents |
| State: | 70 per 1000 residents |
Deaths: 719
| Here: | 69 per 1000 residents |
| State: | 40 per 1000 residents |
Net international migration: +72
| Here: | +7 per 1000 residents |
| State: | +18 per 1000 residents |
Net internal migration: +836
| Here: | +80 per 1000 residents |
| State: | +14 per 1000 residents |
Total withdrawal of fresh water for public supply: 0.15 millions of gallons per day (all from ground)
| Here: | 6.3 |
| State: | 7.0 |
| Here: | 4.9 |
| State: | 4.3 |

- Year house built in Middlesex County, Virginia
- 02020 or later
- 3402010 to 2019
- 1,2832000 to 2009
- 1,1601990 to 1999
- 1,1001980 to 1989
- 1,0001970 to 1979
- 5051960 to 1969
- 5311950 to 1959
- 4591940 to 1949
- 7391939 or earlier
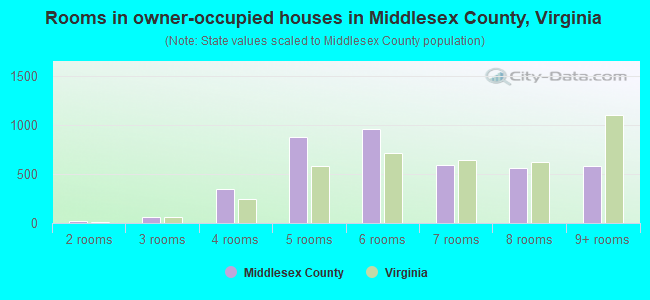
- Rooms in owner-occupied houses in Middlesex County, Virginia
- 01 room
- 112 rooms
- 393 rooms
- 3304 rooms
- 9035 rooms
- 9296 rooms
- 5267 rooms
- 6848 rooms
- 6849+ rooms
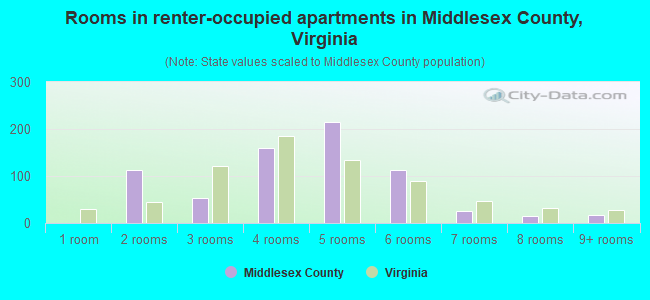
- Rooms in renter-occupied apartments in Middlesex County, Virginia
- 01 room
- 702 rooms
- 753 rooms
- 1394 rooms
- 1795 rooms
- 2176 rooms
- 277 rooms
- 108 rooms
- 209+ rooms
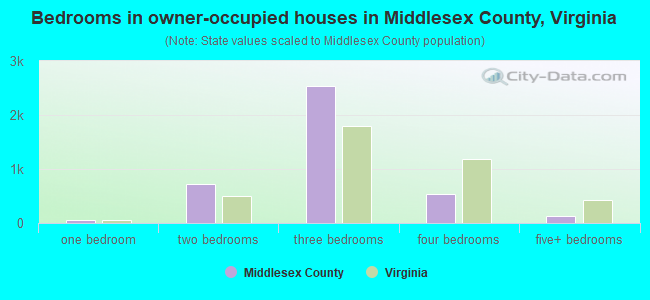
- Bedrooms in owner-occupied houses in Middlesex County, Virginia
- 0no bedroom
- 331 bedroom
- 7782 bedrooms
- 2,5163 bedrooms
- 6024 bedrooms
- 1735+ bedrooms

- Bedrooms in renter-occupied apartments in Middlesex County, Virginia
- 0no bedroom
- 1421 bedroom
- 2252 bedrooms
- 3453 bedrooms
- 194 bedrooms
- 95+ bedrooms
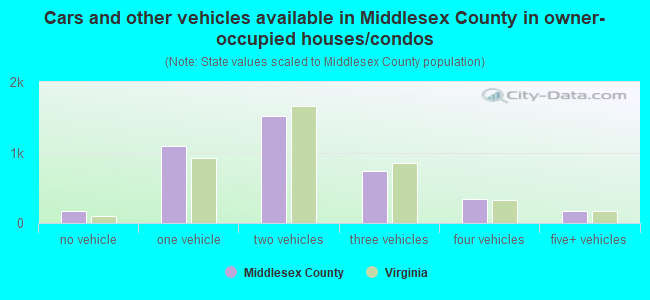
- Cars and other vehicles available in Middlesex County in owner-occupied houses/condos
- 135no vehicle
- 1,0761 vehicle
- 1,5082 vehicles
- 9873 vehicles
- 2654 vehicles
- 1525+ vehicles

- Cars and other vehicles available in Middlesex County in renter-occupied apartments
- 5no vehicle
- 3401 vehicle
- 2412 vehicles
- 1063 vehicles
- 464 vehicles
- 05+ vehicles
89.5% of Middlesex County residents lived in the same house 1 years ago.
Out of people who lived in different houses, 6% lived in this county.
Out of people who lived in different counties, 84% lived in Virginia.
| Middlesex County: | 89.5% |
| State average: | 86.6% |
Place of birth for U.S.-born residents:
- This state: 6,998
- Other state: 3,189
- Northeast: 1,283
- Midwest: 403
- South: 1,215
- West: 284
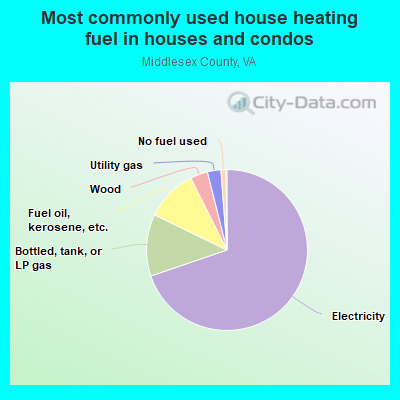
- 74.1%Electricity
- 14.1%Bottled, tank, or LP gas
- 6.5%Fuel oil, kerosene, etc.
- 3.0%Wood
- 1.4%Utility gas
- 0.8%No fuel used
- 0.2%Solar energy
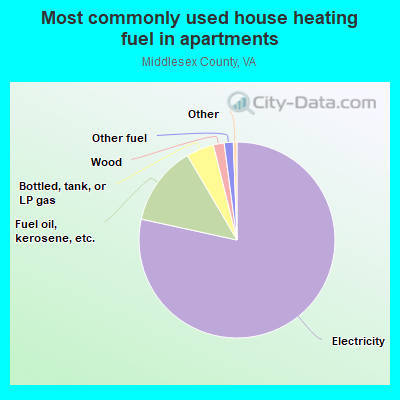
- 87.4%Electricity
- 7.5%Fuel oil, kerosene, etc.
- 3.3%Bottled, tank, or LP gas
- 1.9%Wood
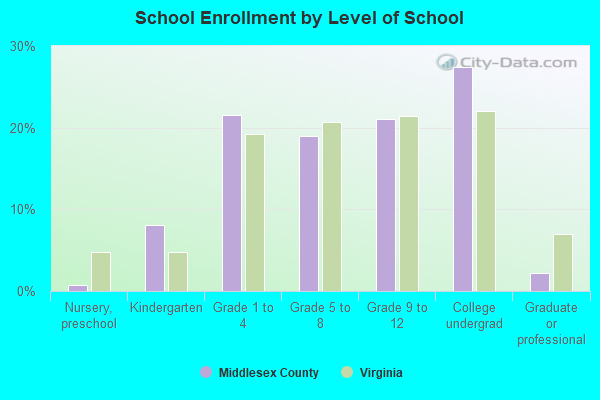
Private vs. public school enrollment:
| Here: | 3.5% |
| Virginia: | 13.2% |
| Here: | 3.9% |
| Virginia: | 10.2% |
| Here: | 36.0% |
| Virginia: | 18.7% |


Middlesex County government finances - Expenditure in 2020:
- Bond Funds - Cash and Securities: $1,752,000
- Charges - Other: $3,522,000
Elementary and Secondary Education School Lunch: $301,000
Elementary and Secondary Education School Lunch: $213,000
Air Transportation: $197,000
Solid Waste Management: $93,000
Elementary and Secondary Education School Tuition and Transportation: $66,000
Other: $64,000
Elementary and Secondary Education School Tuition and Transportation: $55,000
Parks and Recreation: $15,000
Parks and Recreation: $12,000
Elementary and Secondary Education - Other: $2,000
- Construction - Elementary and Secondary Education: $746,000
Elementary and Secondary Education: $241,000
- Current Operations - Elementary and Secondary Education: $16,702,000
Elementary and Secondary Education: $14,265,000
Health - Other: $5,443,000
Public Welfare - Other: $1,664,000
Public Welfare - Other: $1,660,000
Police Protection: $1,533,000
Police Protection: $1,488,000
Correctional Institutions: $1,002,000
Solid Waste Management: $900,000
Judicial and Legal Services: $841,000
Correctional Institutions: $830,000
Financial Administration: $754,000
General Public Buildings: $675,000
Central Staff Services: $648,000
Health - Other: $540,000
Solid Waste Management: $449,000
Local Fire Protection: $435,000
General - Other: $431,000
Judicial and Legal Services: $387,000
Financial Administration: $362,000
Libraries: $354,000
Local Fire Protection: $348,000
General - Other: $267,000
General Public Buildings: $250,000
Air Transportation: $207,000
Parks and Recreation: $158,000
Central Staff Services: $137,000
Protective Inspection and Regulation - Other: $123,000
Libraries: $119,000
Parks and Recreation: $87,000
Protective Inspection and Regulation - Other: $66,000
Housing and Community Development: $43,000
Natural Resources - Other: $36,000
Natural Resources - Other: $31,000
- Federal Intergovernmental - Public Welfare: $643,000
Health and Hospitals: $560,000
Public Welfare: $270,000
Other: $52,000
General Local Government Support: $13,000
- General - Interest on Debt: $1,463,000
Interest on Debt: $223,000
- Intergovernmental to Local - Other - Elementary and Secondary Education: $355,000
Other - Elementary and Secondary Education: $312,000
Other - General - Other: $99,000
Other - Air Transportation: $19,000
- Local Intergovernmental - Education: $429,000
Education: $408,000
General Local Government Support: $134,000
Health and Hospitals: $84,000
- Long Term Debt - Beginning Outstanding - Unspecified Public Purpose: $20,540,000
Outstanding Unspecified Public Purpose: $19,407,000
Beginning Outstanding - Unspecified Public Purpose: $6,927,000
Outstanding Unspecified Public Purpose: $6,369,000
Retired Unspecified Public Purpose: $1,133,000
Retired Unspecified Public Purpose: $558,000
- Miscellaneous - General Revenue - Other: $418,000
Interest Earnings: $363,000
Fines and Forfeits: $263,000
General Revenue - Other: $259,000
Donations From Private Sources: $121,000
Interest Earnings: $112,000
Donations From Private Sources: $100,000
Sale of Property: $55,000
Rents: $41,000
Fines and Forfeits: $37,000
Sale of Property: $4,000
- Other Capital Outlay - General - Other: $543,000
Elementary and Secondary Education: $473,000
Elementary and Secondary Education: $456,000
Police Protection: $83,000
Solid Waste Management: $59,000
General Public Building: $27,000
Health - Other: $27,000
Financial Administration: $6,000
Judicial and Legal Services: $6,000
General - Other: $4,000
- Other Funds - Cash and Securities: $13,075,000
Cash and Securities: $6,139,000
- State Intergovernmental - Education: $9,906,000
Education: $6,287,000
Other: $2,107,000
Other: $1,229,000
General Local Government Support: $1,202,000
Health and Hospitals: $970,000
Public Welfare: $670,000
General Local Government Support: $508,000
Public Welfare: $222,000
- Tax - Property: $15,973,000
Property: $11,331,000
General Sales and Gross Receipts: $1,416,000
General Sales and Gross Receipts: $1,055,000
Motor Vehicle License: $376,000
Public Utilities Sales: $339,000
Occupation and Business License - Other: $237,000
Public Utilities Sales: $231,000
Motor Vehicle License: $229,000
Death and Gift: $220,000
Other License: $148,000
Other: $137,000
Documentary and Stock Transfer: $58,000
Other License: $50,000
Public Utility License: $23,000
- Total Salaries and Wages: $10,682,000
: $9,142,000
Middlesex County government finances - Revenue in 2020:
- Bond Funds - Cash and Securities: $1,752,000
- Charges - Other: $3,522,000
Elementary and Secondary Education School Lunch: $301,000
Elementary and Secondary Education School Lunch: $213,000
Air Transportation: $197,000
Solid Waste Management: $93,000
Elementary and Secondary Education School Tuition and Transportation: $66,000
Other: $64,000
Elementary and Secondary Education School Tuition and Transportation: $55,000
Parks and Recreation: $15,000
Parks and Recreation: $12,000
Elementary and Secondary Education - Other: $2,000
- Construction - Elementary and Secondary Education: $746,000
Elementary and Secondary Education: $241,000
- Current Operations - Elementary and Secondary Education: $16,702,000
Elementary and Secondary Education: $14,265,000
Health - Other: $5,443,000
Public Welfare - Other: $1,664,000
Public Welfare - Other: $1,660,000
Police Protection: $1,533,000
Police Protection: $1,488,000
Correctional Institutions: $1,002,000
Solid Waste Management: $900,000
Judicial and Legal Services: $841,000
Correctional Institutions: $830,000
Financial Administration: $754,000
General Public Buildings: $675,000
Central Staff Services: $648,000
Health - Other: $540,000
Solid Waste Management: $449,000
Local Fire Protection: $435,000
General - Other: $431,000
Judicial and Legal Services: $387,000
Financial Administration: $362,000
Libraries: $354,000
Local Fire Protection: $348,000
General - Other: $267,000
General Public Buildings: $250,000
Air Transportation: $207,000
Parks and Recreation: $158,000
Central Staff Services: $137,000
Protective Inspection and Regulation - Other: $123,000
Libraries: $119,000
Parks and Recreation: $87,000
Protective Inspection and Regulation - Other: $66,000
Housing and Community Development: $43,000
Natural Resources - Other: $36,000
Natural Resources - Other: $31,000
- Federal Intergovernmental - Public Welfare: $643,000
Health and Hospitals: $560,000
Public Welfare: $270,000
Other: $52,000
General Local Government Support: $13,000
- General - Interest on Debt: $1,463,000
Interest on Debt: $223,000
- Intergovernmental to Local - Other - Elementary and Secondary Education: $355,000
Other - Elementary and Secondary Education: $312,000
Other - General - Other: $99,000
Other - Air Transportation: $19,000
- Local Intergovernmental - Education: $429,000
Education: $408,000
General Local Government Support: $134,000
Health and Hospitals: $84,000
- Long Term Debt - Beginning Outstanding - Unspecified Public Purpose: $20,540,000
Outstanding Unspecified Public Purpose: $19,407,000
Beginning Outstanding - Unspecified Public Purpose: $6,927,000
Outstanding Unspecified Public Purpose: $6,369,000
Retired Unspecified Public Purpose: $1,133,000
Retired Unspecified Public Purpose: $558,000
- Miscellaneous - General Revenue - Other: $418,000
Interest Earnings: $363,000
Fines and Forfeits: $263,000
General Revenue - Other: $259,000
Donations From Private Sources: $121,000
Interest Earnings: $112,000
Donations From Private Sources: $100,000
Sale of Property: $55,000
Rents: $41,000
Fines and Forfeits: $37,000
Sale of Property: $4,000
- Other Capital Outlay - General - Other: $543,000
Elementary and Secondary Education: $473,000
Elementary and Secondary Education: $456,000
Police Protection: $83,000
Solid Waste Management: $59,000
General Public Building: $27,000
Health - Other: $27,000
Financial Administration: $6,000
Judicial and Legal Services: $6,000
General - Other: $4,000
- Other Funds - Cash and Securities: $13,075,000
Cash and Securities: $6,139,000
- State Intergovernmental - Education: $9,906,000
Education: $6,287,000
Other: $2,107,000
Other: $1,229,000
General Local Government Support: $1,202,000
Health and Hospitals: $970,000
Public Welfare: $670,000
General Local Government Support: $508,000
Public Welfare: $222,000
- Tax - Property: $15,973,000
Property: $11,331,000
General Sales and Gross Receipts: $1,416,000
General Sales and Gross Receipts: $1,055,000
Motor Vehicle License: $376,000
Public Utilities Sales: $339,000
Occupation and Business License - Other: $237,000
Public Utilities Sales: $231,000
Motor Vehicle License: $229,000
Death and Gift: $220,000
Other License: $148,000
Other: $137,000
Documentary and Stock Transfer: $58,000
Other License: $50,000
Public Utility License: $23,000
- Total Salaries and Wages: $10,682,000
: $9,142,000
Middlesex County government finances - Debt in 2020:
- Bond Funds - Cash and Securities: $1,752,000
- Charges - Other: $3,522,000
Elementary and Secondary Education School Lunch: $301,000
Elementary and Secondary Education School Lunch: $213,000
Air Transportation: $197,000
Solid Waste Management: $93,000
Elementary and Secondary Education School Tuition and Transportation: $66,000
Other: $64,000
Elementary and Secondary Education School Tuition and Transportation: $55,000
Parks and Recreation: $15,000
Parks and Recreation: $12,000
Elementary and Secondary Education - Other: $2,000
- Construction - Elementary and Secondary Education: $746,000
Elementary and Secondary Education: $241,000
- Current Operations - Elementary and Secondary Education: $16,702,000
Elementary and Secondary Education: $14,265,000
Health - Other: $5,443,000
Public Welfare - Other: $1,664,000
Public Welfare - Other: $1,660,000
Police Protection: $1,533,000
Police Protection: $1,488,000
Correctional Institutions: $1,002,000
Solid Waste Management: $900,000
Judicial and Legal Services: $841,000
Correctional Institutions: $830,000
Financial Administration: $754,000
General Public Buildings: $675,000
Central Staff Services: $648,000
Health - Other: $540,000
Solid Waste Management: $449,000
Local Fire Protection: $435,000
General - Other: $431,000
Judicial and Legal Services: $387,000
Financial Administration: $362,000
Libraries: $354,000
Local Fire Protection: $348,000
General - Other: $267,000
General Public Buildings: $250,000
Air Transportation: $207,000
Parks and Recreation: $158,000
Central Staff Services: $137,000
Protective Inspection and Regulation - Other: $123,000
Libraries: $119,000
Parks and Recreation: $87,000
Protective Inspection and Regulation - Other: $66,000
Housing and Community Development: $43,000
Natural Resources - Other: $36,000
Natural Resources - Other: $31,000
- Federal Intergovernmental - Public Welfare: $643,000
Health and Hospitals: $560,000
Public Welfare: $270,000
Other: $52,000
General Local Government Support: $13,000
- General - Interest on Debt: $1,463,000
Interest on Debt: $223,000
- Intergovernmental to Local - Other - Elementary and Secondary Education: $355,000
Other - Elementary and Secondary Education: $312,000
Other - General - Other: $99,000
Other - Air Transportation: $19,000
- Local Intergovernmental - Education: $429,000
Education: $408,000
General Local Government Support: $134,000
Health and Hospitals: $84,000
- Long Term Debt - Beginning Outstanding - Unspecified Public Purpose: $20,540,000
Outstanding Unspecified Public Purpose: $19,407,000
Beginning Outstanding - Unspecified Public Purpose: $6,927,000
Outstanding Unspecified Public Purpose: $6,369,000
Retired Unspecified Public Purpose: $1,133,000
Retired Unspecified Public Purpose: $558,000
- Miscellaneous - General Revenue - Other: $418,000
Interest Earnings: $363,000
Fines and Forfeits: $263,000
General Revenue - Other: $259,000
Donations From Private Sources: $121,000
Interest Earnings: $112,000
Donations From Private Sources: $100,000
Sale of Property: $55,000
Rents: $41,000
Fines and Forfeits: $37,000
Sale of Property: $4,000
- Other Capital Outlay - General - Other: $543,000
Elementary and Secondary Education: $473,000
Elementary and Secondary Education: $456,000
Police Protection: $83,000
Solid Waste Management: $59,000
General Public Building: $27,000
Health - Other: $27,000
Financial Administration: $6,000
Judicial and Legal Services: $6,000
General - Other: $4,000
- Other Funds - Cash and Securities: $13,075,000
Cash and Securities: $6,139,000
- State Intergovernmental - Education: $9,906,000
Education: $6,287,000
Other: $2,107,000
Other: $1,229,000
General Local Government Support: $1,202,000
Health and Hospitals: $970,000
Public Welfare: $670,000
General Local Government Support: $508,000
Public Welfare: $222,000
- Tax - Property: $15,973,000
Property: $11,331,000
General Sales and Gross Receipts: $1,416,000
General Sales and Gross Receipts: $1,055,000
Motor Vehicle License: $376,000
Public Utilities Sales: $339,000
Occupation and Business License - Other: $237,000
Public Utilities Sales: $231,000
Motor Vehicle License: $229,000
Death and Gift: $220,000
Other License: $148,000
Other: $137,000
Documentary and Stock Transfer: $58,000
Other License: $50,000
Public Utility License: $23,000
- Total Salaries and Wages: $10,682,000
: $9,142,000
Middlesex County government finances - Cash and Securities in 2020:
- Bond Funds - Cash and Securities: $1,752,000
- Charges - Other: $3,522,000
Elementary and Secondary Education School Lunch: $301,000
Elementary and Secondary Education School Lunch: $213,000
Air Transportation: $197,000
Solid Waste Management: $93,000
Elementary and Secondary Education School Tuition and Transportation: $66,000
Other: $64,000
Elementary and Secondary Education School Tuition and Transportation: $55,000
Parks and Recreation: $15,000
Parks and Recreation: $12,000
Elementary and Secondary Education - Other: $2,000
- Construction - Elementary and Secondary Education: $746,000
Elementary and Secondary Education: $241,000
- Current Operations - Elementary and Secondary Education: $16,702,000
Elementary and Secondary Education: $14,265,000
Health - Other: $5,443,000
Public Welfare - Other: $1,664,000
Public Welfare - Other: $1,660,000
Police Protection: $1,533,000
Police Protection: $1,488,000
Correctional Institutions: $1,002,000
Solid Waste Management: $900,000
Judicial and Legal Services: $841,000
Correctional Institutions: $830,000
Financial Administration: $754,000
General Public Buildings: $675,000
Central Staff Services: $648,000
Health - Other: $540,000
Solid Waste Management: $449,000
Local Fire Protection: $435,000
General - Other: $431,000
Judicial and Legal Services: $387,000
Financial Administration: $362,000
Libraries: $354,000
Local Fire Protection: $348,000
General - Other: $267,000
General Public Buildings: $250,000
Air Transportation: $207,000
Parks and Recreation: $158,000
Central Staff Services: $137,000
Protective Inspection and Regulation - Other: $123,000
Libraries: $119,000
Parks and Recreation: $87,000
Protective Inspection and Regulation - Other: $66,000
Housing and Community Development: $43,000
Natural Resources - Other: $36,000
Natural Resources - Other: $31,000
- Federal Intergovernmental - Public Welfare: $643,000
Health and Hospitals: $560,000
Public Welfare: $270,000
Other: $52,000
General Local Government Support: $13,000
- General - Interest on Debt: $1,463,000
Interest on Debt: $223,000
- Intergovernmental to Local - Other - Elementary and Secondary Education: $355,000
Other - Elementary and Secondary Education: $312,000
Other - General - Other: $99,000
Other - Air Transportation: $19,000
- Local Intergovernmental - Education: $429,000
Education: $408,000
General Local Government Support: $134,000
Health and Hospitals: $84,000
- Long Term Debt - Beginning Outstanding - Unspecified Public Purpose: $20,540,000
Outstanding Unspecified Public Purpose: $19,407,000
Beginning Outstanding - Unspecified Public Purpose: $6,927,000
Outstanding Unspecified Public Purpose: $6,369,000
Retired Unspecified Public Purpose: $1,133,000
Retired Unspecified Public Purpose: $558,000
- Miscellaneous - General Revenue - Other: $418,000
Interest Earnings: $363,000
Fines and Forfeits: $263,000
General Revenue - Other: $259,000
Donations From Private Sources: $121,000
Interest Earnings: $112,000
Donations From Private Sources: $100,000
Sale of Property: $55,000
Rents: $41,000
Fines and Forfeits: $37,000
Sale of Property: $4,000
- Other Capital Outlay - General - Other: $543,000
Elementary and Secondary Education: $473,000
Elementary and Secondary Education: $456,000
Police Protection: $83,000
Solid Waste Management: $59,000
General Public Building: $27,000
Health - Other: $27,000
Financial Administration: $6,000
Judicial and Legal Services: $6,000
General - Other: $4,000
- Other Funds - Cash and Securities: $13,075,000
Cash and Securities: $6,139,000
- State Intergovernmental - Education: $9,906,000
Education: $6,287,000
Other: $2,107,000
Other: $1,229,000
General Local Government Support: $1,202,000
Health and Hospitals: $970,000
Public Welfare: $670,000
General Local Government Support: $508,000
Public Welfare: $222,000
- Tax - Property: $15,973,000
Property: $11,331,000
General Sales and Gross Receipts: $1,416,000
General Sales and Gross Receipts: $1,055,000
Motor Vehicle License: $376,000
Public Utilities Sales: $339,000
Occupation and Business License - Other: $237,000
Public Utilities Sales: $231,000
Motor Vehicle License: $229,000
Death and Gift: $220,000
Other License: $148,000
Other: $137,000
Documentary and Stock Transfer: $58,000
Other License: $50,000
Public Utility License: $23,000
- Total Salaries and Wages: $10,682,000
: $9,142,000
Supplemental Security Income (SSI) in 2006:
- Total number of recipients: 228
- Number of aged recipients: 32
- Number of blind and disabled recipients: 196
- Number of recipients under 18: 36
- Number of recipients between 18 and 64: 139
- Number of recipients older than 64: 53
- Number of recipients also receiving OASDI: 96
- Amount of payments (thousands of dollars): 91
| Most common first names in Middlesex County, VA among deceased individuals | ||
| Name | Count | Lived (average) |
|---|---|---|
| James | 37 | 74.7 years |
| William | 33 | 72.1 years |
| Mary | 26 | 78.1 years |
| George | 19 | 70.5 years |
| John | 19 | 75.2 years |
| Thomas | 16 | 72.7 years |
| Charles | 15 | 76.2 years |
| Robert | 14 | 77.8 years |
| Virginia | 13 | 80.9 years |
| Elizabeth | 12 | 80.2 years |
| Most common last names in Middlesex County, VA among deceased individuals | ||
| Last name | Count | Lived (average) |
|---|---|---|
| Johnson | 22 | 80.7 years |
| Smith | 17 | 79.5 years |
| Brown | 16 | 74.8 years |
| Williams | 14 | 73.8 years |
| Fitchett | 13 | 73.6 years |
| Thornton | 12 | 76.4 years |
| Bray | 11 | 80.6 years |
| Green | 11 | 80.2 years |
| Brokenboroug | 10 | 81.4 years |
| Burch | 10 | 77.6 years |
| Businesses in Middlesex County, VA | ||||
| Name | Count | Name | Count | |
|---|---|---|---|---|
| 7-Eleven | 4 | MasterBrand Cabinets | 1 | |
| Curves | 1 | True Value | 1 | |
| FedEx | 3 | U-Haul | 1 | |
| Hardee's | 1 | UPS | 3 | |
| Jimmy Jazz | 1 | |||