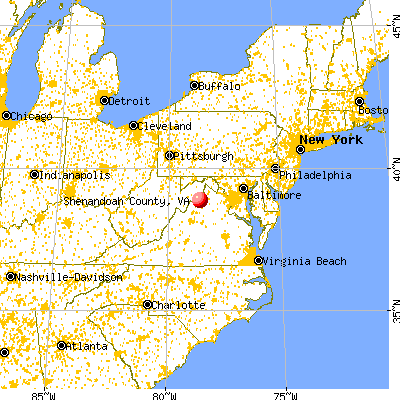
Shenandoah County, Virginia (VA)
County owner-occupied free and clear houses and condos in 2010: 4,404
County owner-occupied houses and condos in 2000: 10,453
Renter-occupied apartments: 4,869 (it was 3,843 in 2000)
| % of renters here: | 27% |
| State: | 33% |
Land area: 512 sq. mi.
Water area: 0.3 sq. mi.
Population density: 87 people per square mile (average).
Industries providing employment: Educational, health and social services (19.7%), Manufacturing (13.0%), Retail trade (12.3%).
Type of workers:
- Private wage or salary: 78%
- Government: 16%
- Self-employed, not incorporated: 6%
- Unpaid family work: 0%
- OSM Map
- General Map
- Google Map
- MSN Map


- 37,37484.6%White Non-Hispanic Alone
- 3,7178.4%Hispanic or Latino
- 1,2802.9%Two or more races
- 1,1232.5%Black Non-Hispanic Alone
- 5471.2%Asian alone
- 1300.3%Some other race alone
- 140.03%Native Hawaiian and Other
Pacific Islander alone - 100.02%American Indian and Alaska Native alone

| Median resident age: | 43.9 years |
| Virginia median age: | 39.0 years |
| Males: 22,063 | |
| Females: 22,577 |

 | Virginia, which direction do you want to go? (113 replies) |
| Navigating Life in NOVA during Covid19 (490 replies) |
| Northern Virginia is not worth it as far as a place to live. (223 replies) |
| Gov. Northam issues stay-at-home order (108 replies) |
| Retirement homestead with expansive views of rolling hills? (13 replies) |
| Critique our planned move from Blacksburg to NOVA (36 replies) |
| Shenandoah County: | 2.0 people |
| Virginia: | 3 people |
Estimated median household income in 2022: $61,168 ($39,173 in 1999)
| This county: | $61,168 |
| Virginia: | $85,873 |
Median contract rent in 2022 for apartments: $805 (lower quartile is $623, upper quartile is $984)
| This county: | $805 |
| State: | $1270 |
Estimated median house or condo value in 2022: $266,472 (it was $101,100 in 2000)
| Shenandoah: | $266,472 |
| Virginia: | $365,700 |
Mean price in 2022:
Median monthly housing costs for homes and condos with a mortgage: $1,373Detached houses: $336,795
Here: $336,795 State: $472,865 Townhouses or other attached units: $368,339
Here: $368,339 State: $457,437 In 2-unit structures: $215,814
Here: $215,814 State: $396,289 In 5-or-more-unit structures: $220,121
Here: $220,121 State: $382,551 Mobile homes: $82,184
Here: $82,184 State: $100,736
Median monthly housing costs for units without a mortgage: $419
Institutionalized population: 349
Crime in 2021 (reported by the sheriff's office or county police, not the county total):
- Murders: 0
- Rapes: 11
- Robberies: 2
- Assaults: 19
- Burglaries: 22
- Thefts: 182
- Auto thefts: 2
Crime in 2020 (reported by the sheriff's office or county police, not the county total):
- Murders: 0
- Rapes: 9
- Robberies: 2
- Assaults: 35
- Burglaries: 26
- Thefts: 191
- Auto thefts: 7
Single-family new house construction building permits:
- 2022: 175 buildings, average cost: $220,700
- 2021: 194 buildings, average cost: $215,900
- 2020: 135 buildings, average cost: $202,900
- 2019: 123 buildings, average cost: $202,900
- 2018: 115 buildings, average cost: $172,000
- 2017: 115 buildings, average cost: $173,500
- 2016: 104 buildings, average cost: $173,500
- 2015: 92 buildings, average cost: $189,000
- 2014: 87 buildings, average cost: $176,900
- 2013: 75 buildings, average cost: $211,900
- 2012: 67 buildings, average cost: $169,100
- 2011: 87 buildings, average cost: $134,000
- 2010: 80 buildings, average cost: $184,900
- 2009: 102 buildings, average cost: $132,700
- 2008: 135 buildings, average cost: $159,300
- 2007: 258 buildings, average cost: $178,600
- 2006: 477 buildings, average cost: $175,600
- 2005: 561 buildings, average cost: $162,300
- 2004: 456 buildings, average cost: $147,600
- 2003: 359 buildings, average cost: $122,600
- 2002: 363 buildings, average cost: $116,900
- 2001: 275 buildings, average cost: $106,500
- 2000: 240 buildings, average cost: $93,100
- 1999: 226 buildings, average cost: $100,800
- 1998: 223 buildings, average cost: $94,700
- 1997: 197 buildings, average cost: $92,400


Median real estate property taxes paid for housing units with mortgages in 2022: $1,375 (0.5%)
Median real estate property taxes paid for housing units with no mortgage in 2022: $1,516 (0.6%)


| Shenandoah County: | 13.3% |
| Virginia: | 10.6% |
Median age of residents in 2022: 43.9 years old
(Males: 42.7 years old, Females: 45.8 years old)
(Median age for: White residents: 47.2 years old, Black residents: 36.5 years old, American Indian residents: 35.9 years old, Asian residents: 39.4 years old, Hispanic or Latino residents: 27.2 years old, Other race residents: 22.3 years old)
Fair market rent in 2006 for a 1-bedroom apartment in Shenandoah County is $426 a month.
Fair market rent for a 2-bedroom apartment is $521 a month.
Fair market rent for a 3-bedroom apartment is $695 a month.
Cities in this county include: Strasburg, Woodstock, Mount Jackson, New Market, Basye, Basye-Bryce Mountain, Edinburg, Maurertown, Toms Brook.
Neighboring counties: Placer County, California  , Teller County, Colorado , Marion County, Illinois , Montgomery County, Missouri , St. Louis County, Missouri .
| Here: | 2.5% |
| Virginia: | 2.7% |


Current college students: 824
People 25 years of age or older with a high school degree or higher: 88.6%
People 25 years of age or older with a bachelor's degree or higher: 20.7%
Number of foreign born residents: 2,071 (48.7% naturalized citizens)
| Shenandoah County: | 4.6% |
| Whole state: | 12.7% |

- Year of entry for the foreign-born population
- 6072010 or later
- 5372000 to 2009
- 3891990 to 1999
- 2591980 to 1989
- 1221970 to 1979
- 210Before 1970
Mean travel time to work (commute): minutes
Percentage of county residents living and working in this county: 99.2%


Housing units in structures:
- One, detached: 16,406
- One, attached: 1,669
- Two: 268
- 3 or 4: 354
- 5 to 9: 512
- 10 to 19: 866
- 20 to 49: 332
- 50 or more: 239
- Mobile homes: 837
- Boats, RVs, vans, etc.: 10
Housing units in Shenandoah County with a mortgage: 7,834 (959 second mortgage, 12 home equity loan, 642 both second mortgage and home equity loan)
Houses without a mortgage: 441
| Here: | 1.6% with mortgage |
| State: | 97.2% with mortgage |
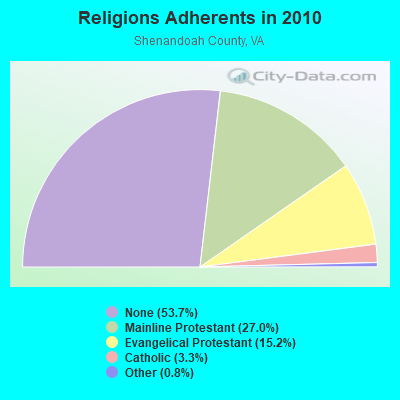
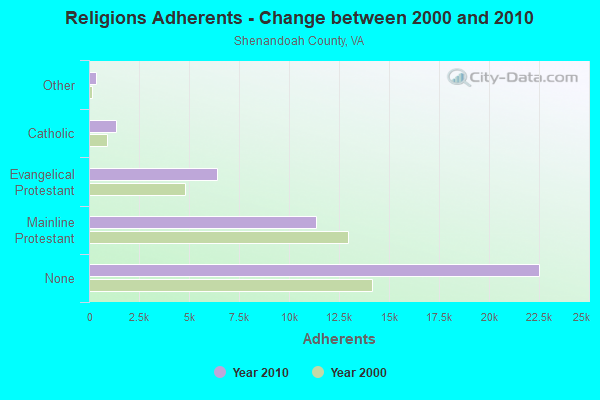
Religion statistics for Shenandoah County
| Religion | Adherents | Congregations |
|---|---|---|
| Mainline Protestant | 11,355 | 66 |
| Evangelical Protestant | 6,380 | 43 |
| Catholic | 1,374 | 2 |
| Other | 345 | 2 |
| None | 22,539 | - |
Source: Clifford Grammich, Kirk Hadaway, Richard Houseal, Dale E.Jones, Alexei Krindatch, Richie Stanley and Richard H.Taylor. 2012. 2010 U.S.Religion Census: Religious Congregations & Membership Study. Association of Statisticians of American Religious Bodies. Jones, Dale E., et al. 2002. Congregations and Membership in the United States 2000. Nashville, TN: Glenmary Research Center.
Food Environment Statistics:
| Shenandoah County: | 2.48 / 10,000 pop. |
| State: | 2.03 / 10,000 pop. |
| Here: | 0.25 / 10,000 pop. |
| Virginia: | 0.17 / 10,000 pop. |
| This county: | 1.24 / 10,000 pop. |
| Virginia: | 1.43 / 10,000 pop. |
| Shenandoah County: | 6.45 / 10,000 pop. |
| Virginia: | 4.03 / 10,000 pop. |
| This county: | 6.70 / 10,000 pop. |
| State: | 7.65 / 10,000 pop. |
| Shenandoah County: | 10.2% |
| Virginia: | 9.3% |
| Shenandoah County: | 25.9% |
| State: | 26.7% |
| Here: | 18.7% |
| State: | 18.6% |
Agriculture in Shenandoah County:
Average size of farms: 135 acresAverage value of agricultural products sold per farm: $70,432
Average value of crops sold per acre for harvested cropland: $138.61
The value of nursery, greenhouse, floriculture, and sod as a percentage of the total market value of agricultural products sold: 1.22%
The value of livestock, poultry, and their products as a percentage of the total market value of agricultural products sold: 90.81%
Average total farm production expenses per farm: $59,737
Harvested cropland as a percentage of land in farms: 34.71%
Irrigated harvested cropland as a percentage of land in farms: 2.37%
Average market value of all machinery and equipment per farm: $34,993
The percentage of farms operated by a family or individual: 89.38%
Average age of principal farm operators: 58 years
Average number of cattle and calves per 100 acres of all land in farms: 28.80
Milk cows as a percentage of all cattle and calves: 5.89%
Corn for grain: 5605 harvested acres
All wheat for grain: 665 harvested acres
Soybeans for beans: 3239 harvested acres
Vegetables: 80 harvested acres
Land in orchards: 2,497 acres
Earthquake activity:
Shenandoah County-area historical earthquake activity is significantly above Virginia state average. It is 48% smaller than the overall U.S. average.On 8/23/2011 at 17:51:04, a magnitude 5.8 (5.8 MW, Depth: 3.7 mi, Class: Moderate, Intensity: VI - VII) earthquake occurred 73.9 miles away from Shenandoah County center
On 9/25/1998 at 19:52:52, a magnitude 5.2 (4.8 MB, 4.3 MS, 5.2 LG, 4.5 MW, Depth: 3.1 mi) earthquake occurred 206.2 miles away from the county center
On 8/25/2011 at 05:07:52, a magnitude 4.5 (4.5 ML, Depth: 4.2 mi, Class: Light, Intensity: IV - V) earthquake occurred 70.8 miles away from the county center
On 12/9/2003 at 20:59:18, a magnitude 4.5 (4.5 ML, Depth: 6.2 mi) earthquake occurred 79.2 miles away from the county center
On 8/9/2020 at 12:07:37, a magnitude 5.1 (5.1 MW, Depth: 4.7 mi) earthquake occurred 215.9 miles away from Shenandoah County center
On 12/9/2003 at 20:59:14, a magnitude 4.5 (4.5 MB, 4.5 LG) earthquake occurred 95.0 miles away from the county center
Magnitude types: regional Lg-wave magnitude (LG), body-wave magnitude (MB), local magnitude (ML), surface-wave magnitude (MS), moment magnitude (MW)
Most recent natural disasters:
- Virginia Covid-19 Pandemic, Incident Period: January 20, 2020, Major Disaster (Presidential) Declared DR-4512-VA: April 2, 2020, FEMA Id: 4512, Natural disaster type: Other
- Virginia Severe Winter Storm And Snowstorm, Incident Period: January 22, 2016 to January 23, 2016, Major Disaster (Presidential) Declared DR-4262: March 07, 2016, FEMA Id: 4262, Natural disaster type: Snowstorm, Winter Storm
- Virginia Hurricane Sandy, Incident Period: October 26, 2012 to November 01, 2012, Emergency Declared EM-3359: October 29, 2012, FEMA Id: 3359, Natural disaster type: Hurricane
- Virginia Severe Storms and Straight-line Winds, Incident Period: June 29, 2012 to July 01, 2012, Major Disaster (Presidential) Declared DR-4072: July 27, 2012, FEMA Id: 4072, Natural disaster type: Storm, Wind
- Virginia Severe Winter Storms and Snowstorms, Incident Period: February 05, 2010 to February 11, 2010, Major Disaster (Presidential) Declared DR-1905: April 27, 2010, FEMA Id: 1905, Natural disaster type: Snowstorm, Winter Storm
- Virginia Hurricane Katrina Evacuation, Incident Period: August 29, 2005 to October 01, 2005, Emergency Declared EM-3240: September 12, 2005, FEMA Id: 3240, Natural disaster type: Hurricane
- Virginia Hurricane Isabel, Incident Period: September 18, 2003 to October 01, 2003, Major Disaster (Presidential) Declared DR-1491: September 18, 2003, FEMA Id: 1491, Natural disaster type: Hurricane
- Virginia Severe Storms and Tornado, Incident Period: April 28, 2002 to May 03, 2002, Major Disaster (Presidential) Declared DR-1411: May 05, 2002, FEMA Id: 1411, Natural disaster type: Storm, Tornado
- Virginia Shenandoah Gap Fire Complex, Incident Period: November 19, 2001 to December 09, 2001, Fire Management Assistance Declared: November 20, 2001, FEMA Id: 2393, Natural disaster type: Fire
- Virginia Winter Storm, Incident Period: January 25, 2000 to January 30, 2000, Major Disaster (Presidential) Declared DR-1318: February 28, 2000, FEMA Id: 1318, Natural disaster type: Winter Storm
- 9 other natural disasters have been reported since 1953.
The number of natural disasters in Shenandoah County (19) is greater than the US average (15).
Major Disasters (Presidential) Declared: 13
Emergencies Declared: 5
Causes of natural disasters: Hurricanes: 4, Storms: 4, Winter Storms: 4, Floods: 3, Droughts: 2, Snowstorms: 2, Blizzard: 1, Fire: 1, Tornado: 1, Tropical Storm: 1, Wind: 1, Other: 1 (Note: some incidents may be assigned to more than one category).

Means of transportation to work:
- Drove a car alone: 11,000 (72.6%)
- Carpooled: 1,422 (9.4%)
- Bus: 10 (0.1%)
- Taxicab, motorcycle, or other means: 281 (1.9%)
- Bicycle: 18 (0.1%)
- Walked: 318 (2.1%)
- Worked at home: 1,995 (13.2%)


- Health care and social assistance (20%)
- Retail trade (12%)
- Educational services (11%)
- Manufacturing (8%)
- Accommodation and food services (8%)
- Professional, scientific, and technical services (5%)
- Finance and insurance (5%)

- Health care and social assistance (22%)
- Retail trade (13%)
- Educational services (13%)
- Manufacturing (9%)
- Accommodation and food services (9%)
- Professional, scientific, and technical services (6%)
- Finance and insurance (6%)

- Management occupations (13%)
- Production occupations (12%)
- Construction and extraction occupations (10%)
- Sales and related occupations (8%)
- Installation, maintenance, and repair occupations (8%)
- Transportation occupations (6%)
- Material moving occupations (5%)

- Office and administrative support occupations (20%)
- Food preparation and serving related occupations (9%)
- Sales and related occupations (9%)
- Educational instruction, and library occupations (8%)
- Healthcare support occupations (7%)
- Health diagnosing and treating practitioners and other technical occupations (6%)
- Management occupations (6%)

- Mexico (24%)
- El Salvador (9%)
- Ethiopia (9%)
- Germany (8%)
- Nicaragua (6%)
- Pakistan (6%)
- South Africa (4%)

- German (24%)
- American (16%)
- English (9%)
- Irish (7%)
- European (3%)
- Italian (3%)
- Scottish (1%)


People in group quarters in Shenandoah County, Virginia in 2010:
- 258 people in nursing facilities/skilled-nursing facilities
- 91 people in local jails and other municipal confinement facilities
- 37 people in group homes intended for adults
- 30 people in workers' group living quarters and job corps centers
- 11 people in other noninstitutional facilities
People in group quarters in Shenandoah County, Virginia in 2000:
- 309 people in nursing homes
- 106 people in other noninstitutional group quarters
- 57 people in local jails and other confinement facilities (including police lockups)
- 19 people in other nonhousehold living situations
- 18 people in homes for the mentally retarded
- 4 people in homes or halfway houses for drug/alcohol abuse
7.35% of this county's 2021 resident taxpayers lived in other counties in 2020 ($61,975 average adjusted gross income)
| Here: | 7.35% |
| Virginia average: | 10.16% |
10 or fewer of this county's residents moved from foreign countries.
5.15% relocated from other counties in Virginia ($44,442 average AGI)
2.21% relocated from other states ($17,534 average AGI)
Shenandoah County: 2.21% Virginia average: 3.91%

Top counties from which taxpayers relocated into this county between 2020 and 2021:
| from Frederick County, VA | |
| from Warren County, VA | |
| from Rockingham County, VA | |
| from Fairfax County, VA | |
| from Prince William County, VA | |
| from Winchester city, VA | |
| from Harrisonburg city, VA |
6.10% of this county's 2020 resident taxpayers moved to other counties in 2021 ($53,733 average adjusted gross income)
| Here: | 6.10% |
| Virginia average: | 10.20% |
10 or fewer of this county's residents moved to foreign countries.
3.94% relocated to other counties in Virginia ($33,247 average AGI)
2.16% relocated to other states ($20,485 average AGI)
Shenandoah County: 2.16% Virginia average: 3.98%

Top counties to which taxpayers relocated from this county between 2020 and 2021:
| to Frederick County, VA | |
| to Warren County, VA | |
| to Rockingham County, VA | |
| to Winchester city, VA | |
| to Harrisonburg city, VA | |
| to Berkeley County, WV | |
| to Page County, VA |
Births per 1000 population from 1990 to 1999: 11.9
Births per 1000 population from 2000 to 2006: 12.2

Deaths per 1000 population from 1990 to 1999: 11.2
Deaths per 1000 population from 2000 to 2009: 10.7
Deaths per 1000 population from 2010 to 2020: 11.3

Infant deaths per 1000 live births from 1990 to 1999: 6.5
Infant deaths per 1000 live births from 2000 to 2006: 4.7

Persons under 19 years old without health insurance coverage in 2018: 6.2%


Persons enrolled in hospital insurance and/or supplemental medical insurance (Medicare) in July 1, 2007: 7,886 (6,926 aged, 960 disabled)
Children under 18 without health insurance coverage in 2007: 1,074 (11%)


Most common underlying causes of death in Shenandoah County, Virginia in 1999 - 2019:
- Bronchus or lung, unspecified - Malignant neoplasms (639)
- Acute myocardial infarction, unspecified (446)
- Chronic obstructive pulmonary disease, unspecified (400)
- Atherosclerotic heart disease (386)
- Unspecified dementia (359)
- Congestive heart failure (284)
- Pneumonia, unspecified (216)
- Alzheimer disease, unspecified (209)
- Stroke, not specified as haemorrhage or infarction (205)
- Septicaemia, unspecified (73)
Population without health insurance coverage in 2000: 10%
Children under 18 without health insurance coverage in 2000: 9%
Short term general hospital admissions per 100,000 population in 2004: 4,136
Short term general hospital beds per 100,000 population in 2004: 60
Emergency room visits per 100,000 population in 2004: 39,696
General practice office based MDs per 100,000 population in 2005: 1,210
Medical specialist MDs per 100,000 population in 2005: 1,156
Dentists per 100,000 population in 1998: 8
Total births per 100,000 population, July 2005 - July 2006 : 32
Total deaths per 100,000 population, July 2005 - July 2006: 69
Limited-service eating places per 100,000 population in 2005 : 13
Suicides per 1,000,000 population from 2000 to 2006: 179.9. This is more than state average.

- Firearm - 107.2
- Other - 72.7
Household type by relationship:
Households: 44,640- Male householders: 8,613 (2,342 living alone), Female householders: 9,417 (2,908 living alone)
8,275 spouses (8,195 opposite-sex spouses), 1,661 unmarried partners, (1,567 opposite-sex unmarried partners), 12,356 children (11,197 natural, 338 adopted, 803 stepchildren), 1,031 grandchildren, 303 brothers or sisters, 958 parents, 0 foster children, 770 other relatives, 923 non-relatives
- In group quarters: 432
Size of family households: 5,967 2-persons, 2,309 3-persons, 2,004 4-persons, 822 5-persons, 368 6-persons, 205 7-or-more-persons.
Size of nonfamily households: 5,250 1-person, 933 2-persons, 111 3-persons, 28 4-persons, 42 5-persons.
5,108 married couples with children.
3,158 single-parent households (762 men, 2,396 women).
90.8% of residents of Shenandoah speak English at home.
6.7% of residents speak Spanish at home (69% speak English very well, 15% speak English well, 11% speak English not well, 5% don't speak English at all).
1.4% of residents speak other Indo-European language at home (74% speak English very well, 18% speak English well, 4% speak English not well, 4% don't speak English at all).
0.6% of residents speak Asian or Pacific Island language at home (43% speak English very well, 54% speak English well, 4% speak English not well).
0.7% of residents speak other language at home (21% speak English very well, 28% speak English well, 19% speak English not well, 33% don't speak English at all).
In fiscal year 2004:
Federal Government expenditure: $188,065,000 ($4,945 per capita)
Department of Defense expenditure: $13,314,000
Federal direct payments to individuals for retirement and disability: $122,355,000
Federal other direct payments to individuals: $35,470,000
Federal direct payments not to individuals: $1,020,000
Federal grants: $17,511,000
Federal procurement contracts: $1,870,000 ($156,000 Department of Defense)
Federal salaries and wages: $9,839,000 ($1,598,000 Department of Defense)
Federal Government direct loans: $514,000
Federal guaranteed/insured loans: $23,000,000
Federal Government insurance: $38,825,000
Population change from April 1, 2000 to July 1, 2005:
Births: 2,316| Here: | 59 per 1000 residents |
| State: | 70 per 1000 residents |
Deaths: 2,089
| Here: | 53 per 1000 residents |
| State: | 40 per 1000 residents |
Net international migration: +274
| Here: | +7 per 1000 residents |
| State: | +18 per 1000 residents |
Net internal migration: +3,692
| Here: | +94 per 1000 residents |
| State: | +14 per 1000 residents |

Total withdrawal of fresh water for public supply: 2.49 millions of gallons per day (43% from ground, 57% from surface)
| Here: | 6.5 |
| State: | 7.0 |
| Here: | 4.7 |
| State: | 4.3 |

- Year house built in Shenandoah County, Virginia
- 632020 or later
- 8862010 to 2019
- 4,2072000 to 2009
- 2,4861990 to 1999
- 2,9841980 to 1989
- 3,4641970 to 1979
- 1,3371960 to 1969
- 9681950 to 1959
- 8931940 to 1949
- 3,9591939 or earlier

- Rooms in owner-occupied houses in Shenandoah County, Virginia
- 201 room
- 592 rooms
- 3653 rooms
- 1,0094 rooms
- 2,5075 rooms
- 2,7566 rooms
- 2,0937 rooms
- 1,6378 rooms
- 2,7479+ rooms

- Rooms in renter-occupied apartments in Shenandoah County, Virginia
- 1691 room
- 2342 rooms
- 4483 rooms
- 1,2144 rooms
- 1,1095 rooms
- 5706 rooms
- 4067 rooms
- 2208 rooms
- 4459+ rooms

- Bedrooms in owner-occupied houses in Shenandoah County, Virginia
- 39no bedroom
- 2061 bedroom
- 2,4462 bedrooms
- 6,9413 bedrooms
- 2,7494 bedrooms
- 7975+ bedrooms

- Bedrooms in renter-occupied apartments in Shenandoah County, Virginia
- 171no bedroom
- 7741 bedroom
- 1,7202 bedrooms
- 1,5653 bedrooms
- 4914 bedrooms
- 905+ bedrooms

- Cars and other vehicles available in Shenandoah County in owner-occupied houses/condos
- 263no vehicle
- 3,0951 vehicle
- 4,6812 vehicles
- 2,8893 vehicles
- 1,2994 vehicles
- 9825+ vehicles

- Cars and other vehicles available in Shenandoah County in renter-occupied apartments
- 641no vehicle
- 1,8951 vehicle
- 1,5922 vehicles
- 4273 vehicles
- 2004 vehicles
- 425+ vehicles
90.3% of Shenandoah County residents lived in the same house 1 years ago.
Out of people who lived in different houses, 33% lived in this county.
Out of people who lived in different counties, 58% lived in Virginia.
| Shenandoah County: | 90.3% |
| State average: | 86.6% |
Place of birth for U.S.-born residents:
- This state: 28,728
- Other state: 12,674
- Northeast: 3,544
- Midwest: 1,530
- South: 6,472
- West: 1,109


- 51.9%Electricity
- 14.4%Fuel oil, kerosene, etc.
- 14.1%Bottled, tank, or LP gas
- 10.9%Wood
- 7.5%Utility gas
- 1.0%Other fuel
- 0.3%No fuel used

- 75.5%Electricity
- 7.8%Fuel oil, kerosene, etc.
- 5.8%Bottled, tank, or LP gas
- 5.5%Utility gas
- 3.1%Wood
- 1.2%Other fuel
- 0.8%No fuel used
- 0.2%Coal or coke
Private vs. public school enrollment:
| Here: | 17.0% |
| Virginia: | 13.2% |
| Here: | 9.0% |
| Virginia: | 10.2% |
| Here: | 18.4% |
| Virginia: | 18.7% |


Shenandoah County government finances - Expenditure in 2017:
- Charges - Solid Waste Management: $1,367,000
Sewerage: $1,167,000
Other: $973,000
Parks and Recreation: $845,000
Elementary and Secondary Education School Lunch: $835,000
Elementary and Secondary Education School Tuition and Transportation: $30,000
Elementary and Secondary Education - Other: $18,000
- Current Operations - Elementary and Secondary Education: $67,831,000
Public Welfare - Other: $8,037,000
Local Fire Protection: $5,135,000
Police Protection: $5,087,000
Correctional Institutions: $2,362,000
Solid Waste Management: $2,301,000
Central Staff Services: $1,997,000
Judicial and Legal Services: $1,971,000
Sewerage: $1,906,000
Financial Administration: $1,219,000
Parks and Recreation: $1,216,000
General Public Buildings: $1,140,000
General - Other: $931,000
Water Utilities: $781,000
Libraries: $720,000
Health - Other: $563,000
Corrections - Other: $484,000
Natural Resources - Other: $447,000
Protective Inspection and Regulation - Other: $371,000
- Federal Intergovernmental - Education: $4,375,000
General Local Government Support: $3,067,000
- General - Interest on Debt: $1,844,000
- Intergovernmental to Local - Other - Elementary and Secondary Education: $2,440,000
- Local Intergovernmental - Education: $3,680,000
- Long Term Debt - Beginning Outstanding - Unspecified Public Purpose: $46,093,000
Outstanding Unspecified Public Purpose: $41,884,000
Retired Unspecified Public Purpose: $4,209,000
- Miscellaneous - General Revenue - Other: $978,000
Interest Earnings: $569,000
Fines and Forfeits: $61,000
- Other Capital Outlay - Elementary and Secondary Education: $2,022,000
Solid Waste Management: $346,000
Local Fire Protection: $250,000
Police Protection: $141,000
Central Staff Services: $15,000
Sewerage: $12,000
- Other Funds - Cash and Securities: $27,025,000
- Revenue - Water Utilities: $702,000
- State Intergovernmental - Education: $38,548,000
General Local Government Support: $10,469,000
- Tax - Property: $42,564,000
General Sales and Gross Receipts: $3,536,000
Public Utilities Sales: $1,938,000
Motor Vehicle License: $871,000
Documentary and Stock Transfer: $410,000
Other License: $372,000
Other Selective Sales: $160,000
Alcoholic Beverage License: $4,000
- Total Salaries and Wages: $41,613,000
Shenandoah County government finances - Revenue in 2017:
- Charges - Solid Waste Management: $1,367,000
Sewerage: $1,167,000
Other: $973,000
Parks and Recreation: $845,000
Elementary and Secondary Education School Lunch: $835,000
Elementary and Secondary Education School Tuition and Transportation: $30,000
Elementary and Secondary Education - Other: $18,000
- Current Operations - Elementary and Secondary Education: $67,831,000
Public Welfare - Other: $8,037,000
Local Fire Protection: $5,135,000
Police Protection: $5,087,000
Correctional Institutions: $2,362,000
Solid Waste Management: $2,301,000
Central Staff Services: $1,997,000
Judicial and Legal Services: $1,971,000
Sewerage: $1,906,000
Financial Administration: $1,219,000
Parks and Recreation: $1,216,000
General Public Buildings: $1,140,000
General - Other: $931,000
Water Utilities: $781,000
Libraries: $720,000
Health - Other: $563,000
Corrections - Other: $484,000
Natural Resources - Other: $447,000
Protective Inspection and Regulation - Other: $371,000
- Federal Intergovernmental - Education: $4,375,000
General Local Government Support: $3,067,000
- General - Interest on Debt: $1,844,000
- Intergovernmental to Local - Other - Elementary and Secondary Education: $2,440,000
- Local Intergovernmental - Education: $3,680,000
- Long Term Debt - Beginning Outstanding - Unspecified Public Purpose: $46,093,000
Outstanding Unspecified Public Purpose: $41,884,000
Retired Unspecified Public Purpose: $4,209,000
- Miscellaneous - General Revenue - Other: $978,000
Interest Earnings: $569,000
Fines and Forfeits: $61,000
- Other Capital Outlay - Elementary and Secondary Education: $2,022,000
Solid Waste Management: $346,000
Local Fire Protection: $250,000
Police Protection: $141,000
Central Staff Services: $15,000
Sewerage: $12,000
- Other Funds - Cash and Securities: $27,025,000
- Revenue - Water Utilities: $702,000
- State Intergovernmental - Education: $38,548,000
General Local Government Support: $10,469,000
- Tax - Property: $42,564,000
General Sales and Gross Receipts: $3,536,000
Public Utilities Sales: $1,938,000
Motor Vehicle License: $871,000
Documentary and Stock Transfer: $410,000
Other License: $372,000
Other Selective Sales: $160,000
Alcoholic Beverage License: $4,000
- Total Salaries and Wages: $41,613,000
Shenandoah County government finances - Debt in 2017:
- Charges - Solid Waste Management: $1,367,000
Sewerage: $1,167,000
Other: $973,000
Parks and Recreation: $845,000
Elementary and Secondary Education School Lunch: $835,000
Elementary and Secondary Education School Tuition and Transportation: $30,000
Elementary and Secondary Education - Other: $18,000
- Current Operations - Elementary and Secondary Education: $67,831,000
Public Welfare - Other: $8,037,000
Local Fire Protection: $5,135,000
Police Protection: $5,087,000
Correctional Institutions: $2,362,000
Solid Waste Management: $2,301,000
Central Staff Services: $1,997,000
Judicial and Legal Services: $1,971,000
Sewerage: $1,906,000
Financial Administration: $1,219,000
Parks and Recreation: $1,216,000
General Public Buildings: $1,140,000
General - Other: $931,000
Water Utilities: $781,000
Libraries: $720,000
Health - Other: $563,000
Corrections - Other: $484,000
Natural Resources - Other: $447,000
Protective Inspection and Regulation - Other: $371,000
- Federal Intergovernmental - Education: $4,375,000
General Local Government Support: $3,067,000
- General - Interest on Debt: $1,844,000
- Intergovernmental to Local - Other - Elementary and Secondary Education: $2,440,000
- Local Intergovernmental - Education: $3,680,000
- Long Term Debt - Beginning Outstanding - Unspecified Public Purpose: $46,093,000
Outstanding Unspecified Public Purpose: $41,884,000
Retired Unspecified Public Purpose: $4,209,000
- Miscellaneous - General Revenue - Other: $978,000
Interest Earnings: $569,000
Fines and Forfeits: $61,000
- Other Capital Outlay - Elementary and Secondary Education: $2,022,000
Solid Waste Management: $346,000
Local Fire Protection: $250,000
Police Protection: $141,000
Central Staff Services: $15,000
Sewerage: $12,000
- Other Funds - Cash and Securities: $27,025,000
- Revenue - Water Utilities: $702,000
- State Intergovernmental - Education: $38,548,000
General Local Government Support: $10,469,000
- Tax - Property: $42,564,000
General Sales and Gross Receipts: $3,536,000
Public Utilities Sales: $1,938,000
Motor Vehicle License: $871,000
Documentary and Stock Transfer: $410,000
Other License: $372,000
Other Selective Sales: $160,000
Alcoholic Beverage License: $4,000
- Total Salaries and Wages: $41,613,000
Shenandoah County government finances - Cash and Securities in 2017:
- Charges - Solid Waste Management: $1,367,000
Sewerage: $1,167,000
Other: $973,000
Parks and Recreation: $845,000
Elementary and Secondary Education School Lunch: $835,000
Elementary and Secondary Education School Tuition and Transportation: $30,000
Elementary and Secondary Education - Other: $18,000
- Current Operations - Elementary and Secondary Education: $67,831,000
Public Welfare - Other: $8,037,000
Local Fire Protection: $5,135,000
Police Protection: $5,087,000
Correctional Institutions: $2,362,000
Solid Waste Management: $2,301,000
Central Staff Services: $1,997,000
Judicial and Legal Services: $1,971,000
Sewerage: $1,906,000
Financial Administration: $1,219,000
Parks and Recreation: $1,216,000
General Public Buildings: $1,140,000
General - Other: $931,000
Water Utilities: $781,000
Libraries: $720,000
Health - Other: $563,000
Corrections - Other: $484,000
Natural Resources - Other: $447,000
Protective Inspection and Regulation - Other: $371,000
- Federal Intergovernmental - Education: $4,375,000
General Local Government Support: $3,067,000
- General - Interest on Debt: $1,844,000
- Intergovernmental to Local - Other - Elementary and Secondary Education: $2,440,000
- Local Intergovernmental - Education: $3,680,000
- Long Term Debt - Beginning Outstanding - Unspecified Public Purpose: $46,093,000
Outstanding Unspecified Public Purpose: $41,884,000
Retired Unspecified Public Purpose: $4,209,000
- Miscellaneous - General Revenue - Other: $978,000
Interest Earnings: $569,000
Fines and Forfeits: $61,000
- Other Capital Outlay - Elementary and Secondary Education: $2,022,000
Solid Waste Management: $346,000
Local Fire Protection: $250,000
Police Protection: $141,000
Central Staff Services: $15,000
Sewerage: $12,000
- Other Funds - Cash and Securities: $27,025,000
- Revenue - Water Utilities: $702,000
- State Intergovernmental - Education: $38,548,000
General Local Government Support: $10,469,000
- Tax - Property: $42,564,000
General Sales and Gross Receipts: $3,536,000
Public Utilities Sales: $1,938,000
Motor Vehicle License: $871,000
Documentary and Stock Transfer: $410,000
Other License: $372,000
Other Selective Sales: $160,000
Alcoholic Beverage License: $4,000
- Total Salaries and Wages: $41,613,000
Supplemental Security Income (SSI) in 2006:
- Total number of recipients: 543
- Number of aged recipients: 60
- Number of blind and disabled recipients: 483
- Number of recipients under 18: 82
- Number of recipients between 18 and 64: 335
- Number of recipients older than 64: 126
- Number of recipients also receiving OASDI: 270
- Amount of payments (thousands of dollars): 200
| Most common first names in Shenandoah County, VA among deceased individuals | ||
| Name | Count | Lived (average) |
|---|---|---|
| Mary | 302 | 80.2 years |
| William | 287 | 76.4 years |
| Charles | 280 | 74.4 years |
| John | 268 | 75.1 years |
| Robert | 204 | 72.3 years |
| James | 196 | 72.6 years |
| George | 120 | 76.1 years |
| Harry | 102 | 77.5 years |
| Virginia | 94 | 80.8 years |
| Dorothy | 93 | 76.1 years |
| Most common last names in Shenandoah County, VA among deceased individuals | ||
| Last name | Count | Lived (average) |
|---|---|---|
| Miller | 218 | 76.9 years |
| Dellinger | 129 | 77.4 years |
| Funkhouser | 102 | 77.4 years |
| Smith | 72 | 77.4 years |
| Coffman | 70 | 78.4 years |
| Bowman | 65 | 76.8 years |
| Bowers | 63 | 78.0 years |
| Baker | 60 | 76.6 years |
| Orndorff | 58 | 78.7 years |
| Keller | 54 | 80.6 years |
| Businesses in Shenandoah County, VA | ||||
| Name | Count | Name | Count | |
|---|---|---|---|---|
| 7-Eleven | 5 | Hilton | 1 | |
| Ace Hardware | 1 | Holiday Inn | 1 | |
| Advance Auto Parts | 1 | KFC | 1 | |
| Arby's | 3 | La-Z-Boy | 1 | |
| AutoZone | 1 | Lane Furniture | 1 | |
| Baskin-Robbins | 1 | Lowe's | 1 | |
| Burger King | 4 | Marriott | 1 | |
| CVS | 1 | MasterBrand Cabinets | 3 | |
| Chevrolet | 1 | McDonald's | 3 | |
| Comfort Inn | 1 | Nike | 1 | |
| Cracker Barrel | 1 | Pizza Hut | 1 | |
| Dairy Queen | 1 | Quality | 1 | |
| Days Inn | 1 | RadioShack | 2 | |
| Decora Cabinetry | 2 | Ramada | 1 | |
| Dennys | 2 | Rite Aid | 2 | |
| Domino's Pizza | 1 | Sprint Nextel | 2 | |
| Dunkin Donuts | 2 | Subway | 4 | |
| FedEx | 6 | Taco Bell | 1 | |
| Ford | 1 | True Value | 1 | |
| GNC | 2 | U-Haul | 3 | |
| GameStop | 1 | UPS | 7 | |
| Goodwill | 1 | Walmart | 1 | |
| H&R Block | 2 | Wendy's | 2 | |