Webster County, Kentucky (KY)
County owner-occupied free and clear houses and condos in 2010: 1,885
County owner-occupied houses and condos in 2000: 4,339
Renter-occupied apartments: 1,245 (it was 1,221 in 2000)
| % of renters here: | 22% |
| State: | 31% |
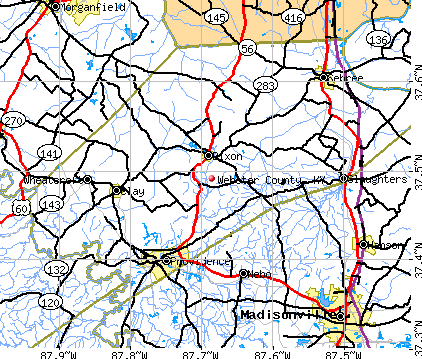
Land area: 335 sq. mi.
Water area: 0.9 sq. mi.
Population density: 39 people per square mile (low).
Industries providing employment: Manufacturing (26.8%), Educational, health and social services (17.5%).
Type of workers:
- Private wage or salary: 78%
- Government: 16%
- Self-employed, not incorporated: 6%
- Unpaid family work: 0%
- OSM Map
- General Map
- Google Map
- MSN Map

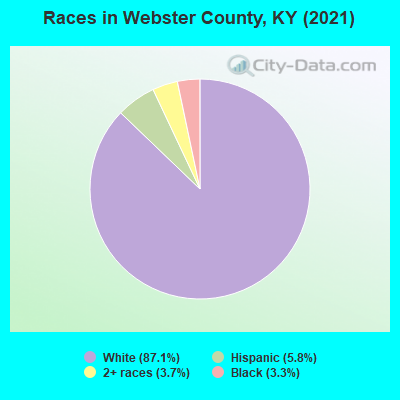
- 11,30687.4%White Non-Hispanic Alone
- 7816.0%Hispanic or Latino
- 5154.0%Black Non-Hispanic Alone
- 2932.3%Two or more races
- 290.2%Native Hawaiian and Other
Pacific Islander alone - 50.04%Asian alone
- 20.02%Some other race alone
| Median resident age: | 40.0 years |
| Kentucky median age: | 39.4 years |
| Males: 6,484 | |
| Females: 6,493 |


| Webster County: | 2.0 people |
| Kentucky: | 2 people |
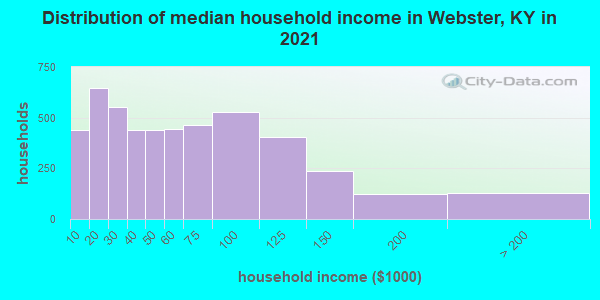
Estimated median household income in 2022: $54,675 ($31,529 in 1999)
| This county: | $54,675 |
| Kentucky: | $59,341 |
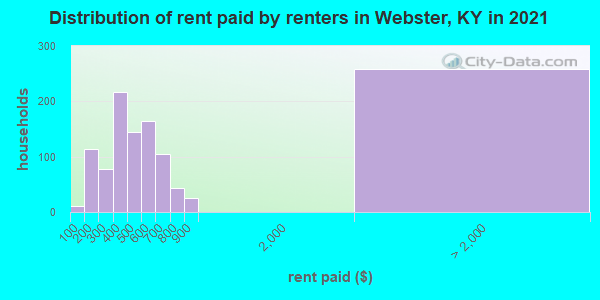
Median contract rent in 2022 for apartments: $461 (lower quartile is $303, upper quartile is $576)
| This county: | $461 |
| State: | $702 |
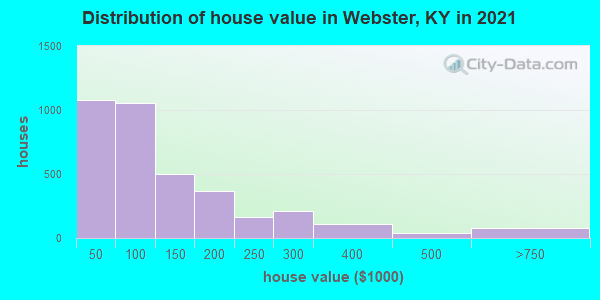
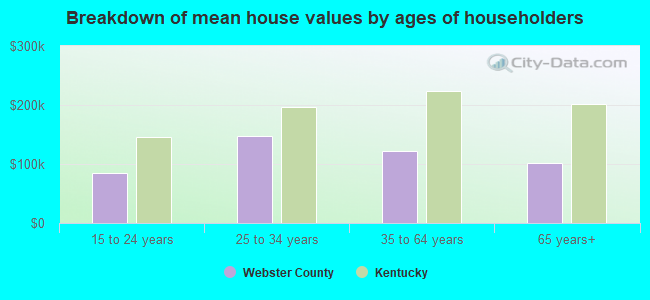
Estimated median house or condo value in 2022: $96,154 (it was $44,200 in 2000)
| Webster: | $96,154 |
| Kentucky: | $196,300 |
Mean price in 2022:
Median monthly housing costs for homes and condos with a mortgage: $1,111Detached houses: $151,746
Here: $151,746 State: $256,452 Townhouses or other attached units: $125,717
Here: $125,717 State: $264,090 Mobile homes: $59,576
Here: $59,576 State: $84,635
Median monthly housing costs for units without a mortgage: $395
Institutionalized population: 370
Crime in 2021 (reported by the sheriff's office or county police, not the county total):
- Murders: 0
- Rapes: 0
- Robberies: 0
- Assaults: 2
- Burglaries: 7
- Thefts: 15
- Auto thefts: 9
Crime in 2020 (reported by the sheriff's office or county police, not the county total):
- Murders: 0
- Rapes: 0
- Robberies: 0
- Assaults: 3
- Burglaries: 7
- Thefts: 17
- Auto thefts: 8
Health of residents in Webster County based on CDC Behavioral Risk Factor Surveillance System Survey Questionnaires from 2013 to 2021:
General health status score of residents in this county from 1 (poor) to 5 (excellent) is 3.3. This is worse than average.65.6% of residents exercised in the past month. This is less than average.
47.9% of residents smoked 100+ cigarettes in their lives. This is about average.
44.6% of adult residents drank alcohol in the past 30 days. This is less than average.
70.4% of residents visited a dentist within the past year. This is about average.
Average weight of males is 206 pounds. This is more than average.
Average weight of females is 165 pounds. This is about average.
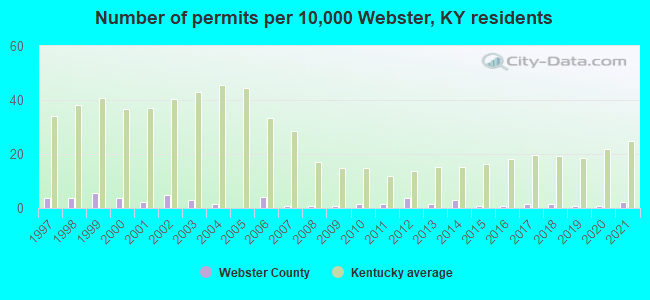
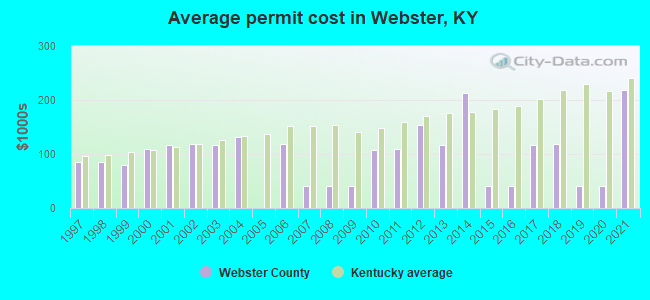
Single-family new house construction building permits:
- 2022: 7 buildings, average cost: $253,200
- 2021: 3 buildings, average cost: $217,500
- 2020: 1 building, cost: $40,000
- 2019: 1 building, cost: $40,000
- 2018: 2 buildings, average cost: $117,600
- 2017: 2 buildings, average cost: $117,100
- 2016: 1 building, cost: $40,000
- 2015: 1 building, cost: $40,000
- 2014: 4 buildings, average cost: $212,800
- 2013: 2 buildings, average cost: $116,300
- 2012: 5 buildings, average cost: $153,300
- 2011: 2 buildings, average cost: $109,700
- 2010: 2 buildings, average cost: $107,800
- 2009: 1 building, cost: $40,000
- 2008: 1 building, cost: $40,000
- 2007: 1 building, cost: $40,000
- 2006: 6 buildings, average cost: $119,300
- 2005: 0 buildings
- 2004: 2 buildings, average cost: $131,000
- 2003: 4 buildings, average cost: $117,400
- 2002: 7 buildings, average cost: $119,300
- 2001: 3 buildings, average cost: $117,400
- 2000: 5 buildings, average cost: $109,000
- 1999: 8 buildings, average cost: $79,000
- 1998: 5 buildings, average cost: $86,200
- 1997: 5 buildings, average cost: $86,200
Median real estate property taxes paid for housing units with mortgages in 2022: $1,313 (0.9%)
Median real estate property taxes paid for housing units with no mortgage in 2022: $584 (0.7%)
| Webster County: | 16.4% |
| Kentucky: | 16.5% |
Median age of residents in 2022: 40.0 years old
(Males: 39.5 years old, Females: 41.0 years old)
(Median age for: White residents: 42.7 years old, Black residents: 45.3 years old, American Indian residents: 43.2 years old, Hispanic or Latino residents: 19.8 years old, Other race residents: 15.2 years old)
Area name: Evansville, IN-KY HUD Metro FMR Area
Fair market rent in 2006 for a 1-bedroom apartment in Webster County is $437 a month.
Fair market rent for a 2-bedroom apartment is $543 a month.
Fair market rent for a 3-bedroom apartment is $670 a month.
Cities in this county include: Providence, Sebree, Clay, Dixon, Slaughters, Wheatcroft, Onton.
Neighboring counties: Mohave County, Arizona  , Camden County, Missouri , Butler County
  , Harper County, Oklahoma , Iron County, Missouri , Prowers County, Colorado , Pratt County, Kansas .
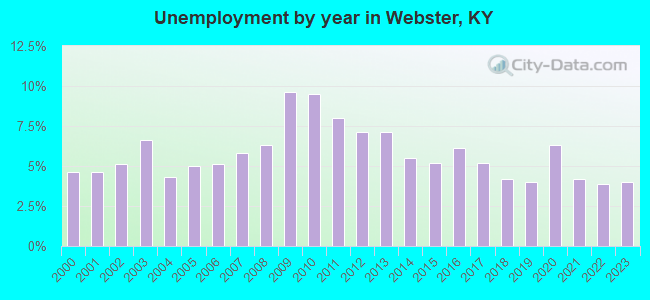
| Here: | 3.9% |
| Kentucky: | 3.8% |
Current college students: 543
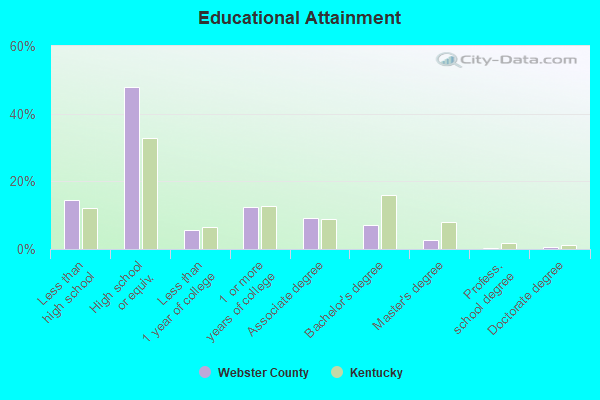
People 25 years of age or older with a high school degree or higher: 85.7%
People 25 years of age or older with a bachelor's degree or higher: 11.5%
Number of foreign born residents: 360 (12.9% naturalized citizens)
| Webster County: | 2.8% |
| Whole state: | 4.0% |
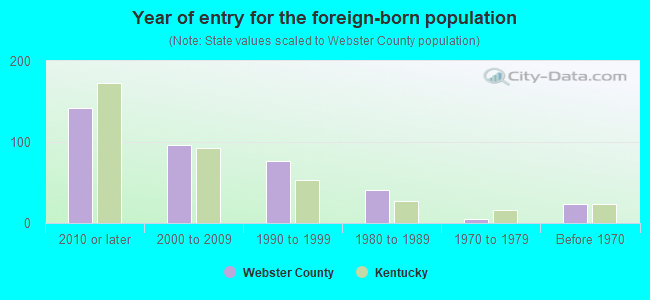
- Year of entry for the foreign-born population
- 2042010 or later
- 622000 to 2009
- 471990 to 1999
- 411980 to 1989
- 51970 to 1979
- 23Before 1970
Mean travel time to work (commute): minutes
Percentage of county residents living and working in this county: 91.6%
Housing units in structures:
- One, detached: 4,040
- One, attached: 141
- Two: 40
- 3 or 4: 195
- 5 to 9: 182
- 10 to 19: 18
- 20 to 49: 53
- 50 or more: 9
- Mobile homes: 1,090
- Boats, RVs, vans, etc.: 8
Housing units in Webster County with a mortgage: 1,448 (158 second mortgage, 0 home equity loan, 140 both second mortgage and home equity loan)
Houses without a mortgage: 49
| Here: | 2.0% with mortgage |
| State: | 96.8% with mortgage |
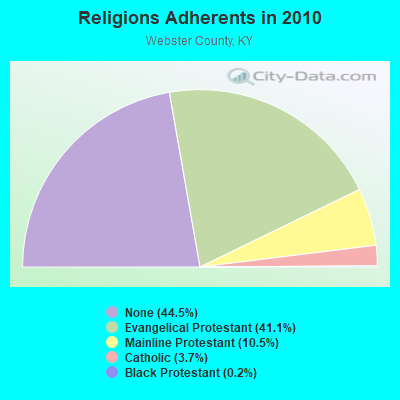
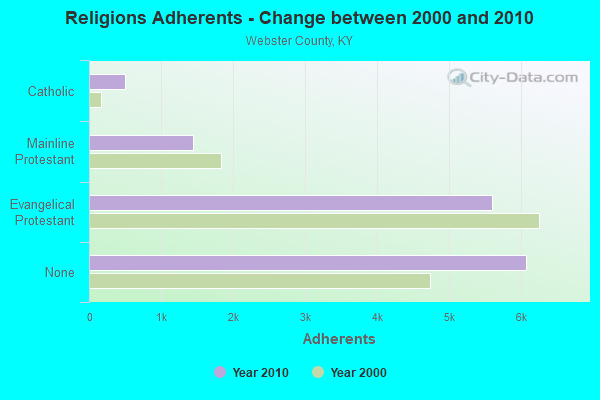
Religion statistics for Webster County
| Religion | Adherents | Congregations |
|---|---|---|
| Evangelical Protestant | 5,593 | 33 |
| Mainline Protestant | 1,437 | 9 |
| Catholic | 500 | 2 |
| Black Protestant | 31 | 2 |
| Other | - | 1 |
| None | 6,060 | - |
Source: Clifford Grammich, Kirk Hadaway, Richard Houseal, Dale E.Jones, Alexei Krindatch, Richie Stanley and Richard H.Taylor. 2012. 2010 U.S.Religion Census: Religious Congregations & Membership Study. Association of Statisticians of American Religious Bodies. Jones, Dale E., et al. 2002. Congregations and Membership in the United States 2000. Nashville, TN: Glenmary Research Center.
Food Environment Statistics:
| Webster County: | 3.61 / 10,000 pop. |
| State: | 2.19 / 10,000 pop. |
| This county: | 0.72 / 10,000 pop. |
| Kentucky: | 0.74 / 10,000 pop. |
| Webster County: | 7.94 / 10,000 pop. |
| Kentucky: | 4.36 / 10,000 pop. |
| This county: | 5.05 / 10,000 pop. |
| State: | 5.74 / 10,000 pop. |
| Webster County: | 10.4% |
| Kentucky: | 11.0% |
| Webster County: | 31.1% |
| State: | 30.0% |
| Here: | 17.4% |
| State: | 15.9% |
Agriculture in Webster County:
Average size of farms: 268 acresAverage value of agricultural products sold per farm: $129,994
Average value of crops sold per acre for harvested cropland: $177.51
The value of livestock, poultry, and their products as a percentage of the total market value of agricultural products sold: 77.90%
Average total farm production expenses per farm: $93,325
Harvested cropland as a percentage of land in farms: 60.39%
Average market value of all machinery and equipment per farm: $59,153
The percentage of farms operated by a family or individual: 89.92%
Average age of principal farm operators: 55 years
Average number of cattle and calves per 100 acres of all land in farms: 6.88
Milk cows as a percentage of all cattle and calves: 0.49%
Corn for grain: 37345 harvested acres
All wheat for grain: 2817 harvested acres
Soybeans for beans: 45373 harvested acres
Vegetables: 1 harvested acres
Earthquake activity:
Webster County-area historical earthquake activity is significantly above Kentucky state average. It is 232% greater than the overall U.S. average.On 4/18/2008 at 09:36:59, a magnitude 5.4 (5.1 MB, 4.8 MS, 5.4 MW, 5.2 MW, Class: Moderate, Intensity: VI - VII) earthquake occurred 67.4 miles away from Webster County center
On 4/18/2008 at 09:36:59, a magnitude 5.2 (5.2 MW, Depth: 8.9 mi) earthquake occurred 67.4 miles away from the county center
On 6/18/2002 at 17:37:15, a magnitude 5.0 (4.3 MB, 4.6 MW, 5.0 LG) earthquake occurred 34.7 miles away from the county center
On 6/10/1987 at 23:48:54, a magnitude 5.1 (4.9 MB, 4.4 MS, 4.6 MS, 5.1 LG) earthquake occurred 92.7 miles away from the county center
On 9/26/1990 at 13:18:51, a magnitude 5.0 (4.7 MB, 4.8 LG, 5.0 LG, Depth: 7.7 mi) earthquake occurred 104.1 miles away from Webster County center
On 4/18/2008 at 15:14:16, a magnitude 4.8 (4.5 MB, 4.8 MW, 4.6 MW, Class: Light, Intensity: IV - V) earthquake occurred 68.7 miles away from the county center
Magnitude types: regional Lg-wave magnitude (LG), body-wave magnitude (MB), surface-wave magnitude (MS), moment magnitude (MW)
Most recent natural disasters:
- Kentucky Covid-19 Pandemic, Incident Period: January 20, 2020, FEMA Id: 4497, Natural disaster type: Other
- Kentucky Severe Storms, Straight-line Winds, Flooding, Landslides, And Mudslides, Incident Period: February 6, 2019 - March 10, 2019, FEMA Id: 4428, Natural disaster type: Storm, Mudslide, Landslide, Flood, Wind
- Kentucky Severe Storms, Tornadoes, Flooding, Landslides, And Mudslides, Incident Period: February 21, 2018 - March 21, 2018, FEMA Id: 4361, Natural disaster type: Storm, Tornado, Mudslide, Landslide, Flood
- Kentucky Severe Winter Storm, Snowstorm, Flooding, Landslides, and Mudslides, Incident Period: March 03, 2015 to March 09, 2015, Major Disaster (Presidential) Declared DR-4218: May 12, 2015, FEMA Id: 4218, Natural disaster type: Snowstorm, Winter Storm, Mudslide, Landslide, Flood
- Kentucky Severe Storms, Tornadoes, and Flooding, Incident Period: April 12, 2011 to May 20, 2011, Major Disaster (Presidential) Declared DR-1976: May 04, 2011, FEMA Id: 1976, Natural disaster type: Storm, Tornado, Flood
- Kentucky Severe Winter Storm, Incident Period: January 27, 2009 to February 05, 2009, Emergency Declared EM-3302: January 28, 2009, FEMA Id: 3302, Natural disaster type: Winter Storm
- Kentucky Severe Winter Storm and Flooding, Incident Period: January 26, 2009 to February 13, 2009, Major Disaster (Presidential) Declared DR-1818: February 05, 2009, FEMA Id: 1818, Natural disaster type: Winter Storm, Flood
- Kentucky Severe Wind Storm associated with Tropical Depression Ike, Incident Period: September 12, 2008 to September 14, 2008, Major Disaster (Presidential) Declared DR-1802: October 09, 2008, FEMA Id: 1802, Natural disaster type: Storm, Tropical Depression, Wind
- Kentucky Hurricane Katrina Evacuation, Incident Period: August 29, 2005 to October 01, 2005, Emergency Declared EM-3231: September 10, 2005, FEMA Id: 3231, Natural disaster type: Hurricane
- Kentucky Severe Winter Storm and Record Snow, Incident Period: December 21, 2004 to December 23, 2004, Major Disaster (Presidential) Declared DR-1578: February 08, 2005, FEMA Id: 1578, Natural disaster type: Winter Storm, Snow
- 7 other natural disasters have been reported since 1953.
The number of natural disasters in Webster County (17) is near the US average (15).
Major Disasters (Presidential) Declared: 12
Emergencies Declared: 2
Causes of natural disasters: Floods: 10, Storms: 10, Tornadoes: 6, Mudslides: 4, Winter Storms: 4, Landslides: 3, Winds: 2, Blizzard: 1, Flash Flood: 1, Hurricane: 1, Snow: 1, Snowstorm: 1, Tropical Depression: 1, Other: 1 (Note: some incidents may be assigned to more than one category).
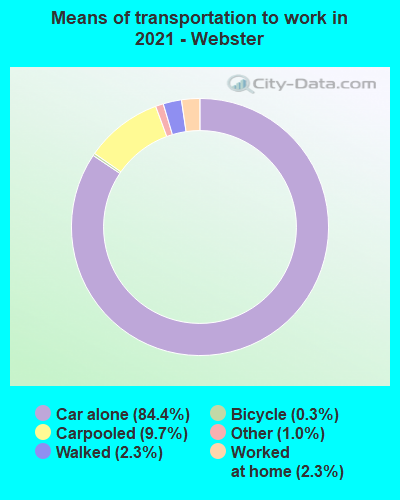
Means of transportation to work:
- Drove a car alone: 3,125 (79.8%)
- Carpooled: 475 (12.1%)
- Ferryboat: 1 (0.0%)
- Taxicab, motorcycle, or other means: 46 (1.2%)
- Bicycle: 5 (0.1%)
- Walked: 61 (1.6%)
- Worked at home: 155 (4.0%)


- Manufacturing (21%)
- Health care and social assistance (18%)
- Educational services (12%)
- Retail trade (10%)
- Accommodation and food services (7%)
- Finance and insurance (5%)
- Transportation and warehousing (5%)
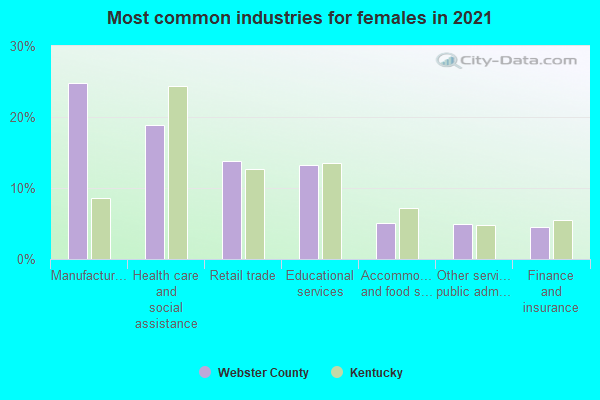
- Manufacturing (22%)
- Health care and social assistance (19%)
- Educational services (12%)
- Retail trade (11%)
- Accommodation and food services (7%)
- Finance and insurance (5%)
- Transportation and warehousing (5%)
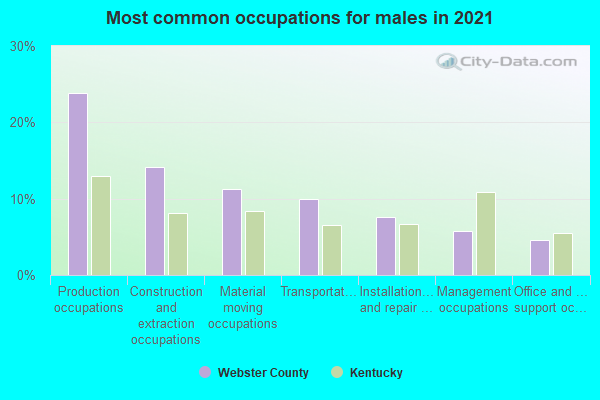
- Production occupations (21%)
- Construction and extraction occupations (18%)
- Transportation occupations (12%)
- Material moving occupations (11%)
- Installation, maintenance, and repair occupations (6%)
- Management occupations (5%)
- Office and administrative support occupations (4%)
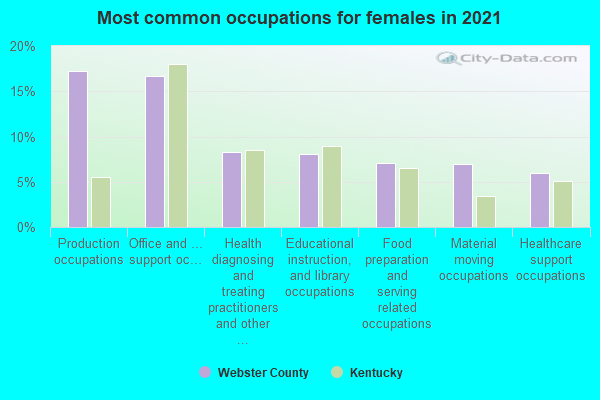
- Office and administrative support occupations (18%)
- Production occupations (15%)
- Educational instruction, and library occupations (10%)
- Health diagnosing and treating practitioners and other technical occupations (10%)
- Food preparation and serving related occupations (7%)
- Material moving occupations (7%)
- Sales and related occupations (6%)
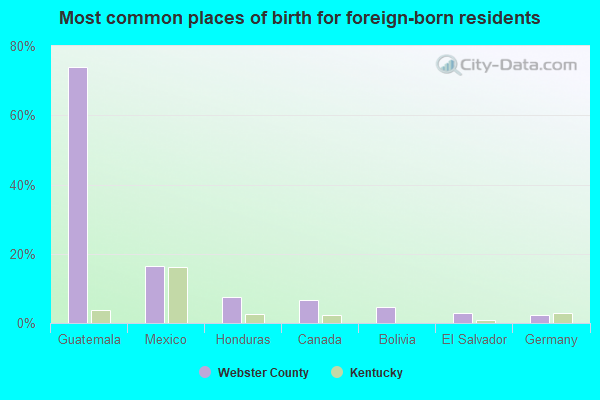
- Guatemala (55%)
- El Salvador (22%)
- Canada (6%)
- Mexico (5%)
- Bolivia (5%)
- Somalia (2%)
- Germany (2%)
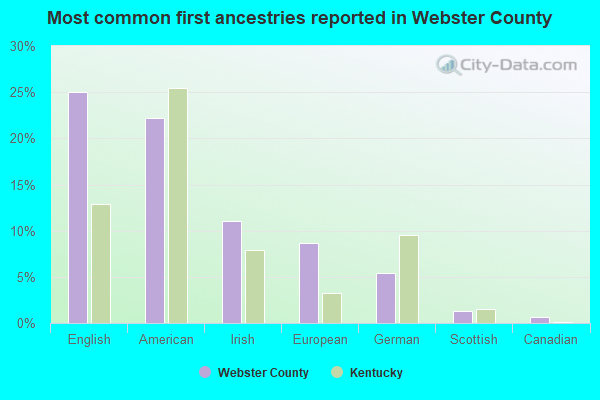
- English (23%)
- American (20%)
- European (11%)
- Irish (9%)
- German (5%)
- Scottish (1%)
- Italian (1%)

People in group quarters in Webster County, Kentucky in 2010:
- 245 people in local jails and other municipal confinement facilities
- 114 people in nursing facilities/skilled-nursing facilities
- 23 people in residential treatment centers for adults
- 11 people in residential treatment centers for juveniles (non-correctional)
People in group quarters in Webster County, Kentucky in 2000:
- 167 people in nursing homes
- 73 people in local jails and other confinement facilities (including police lockups)
- 10 people in homes for abused, dependent, and neglected children
- 7 people in other noninstitutional group quarters
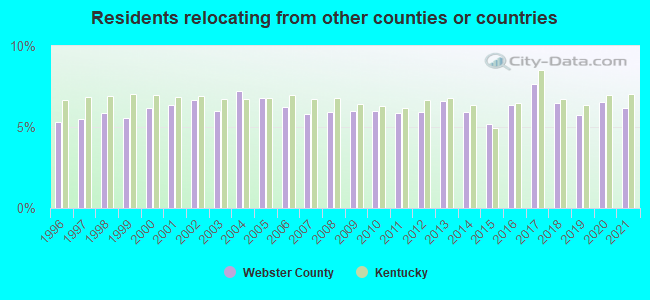
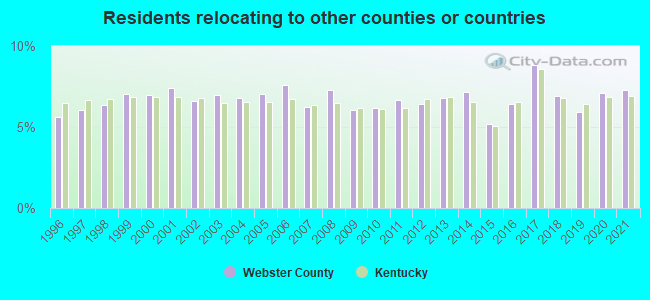
6.15% of this county's 2021 resident taxpayers lived in other counties in 2020 ($34,615 average adjusted gross income)
| Here: | 6.15% |
| Kentucky average: | 7.04% |
10 or fewer of this county's residents moved from foreign countries.
4.84% relocated from other counties in Kentucky ($28,015 average AGI)
1.31% relocated from other states ($6,597 average AGI)
Webster County: 1.31% Kentucky average: 2.87%
Top counties from which taxpayers relocated into this county between 2020 and 2021:
| from Hopkins County, KY | |
| from Henderson County, KY | |
| from Union County, KY |
7.28% of this county's 2020 resident taxpayers moved to other counties in 2021 ($41,483 average adjusted gross income)
| Here: | 7.28% |
| Kentucky average: | 6.89% |
10 or fewer of this county's residents moved to foreign countries.
5.48% relocated to other counties in Kentucky ($30,547 average AGI)
1.80% relocated to other states ($10,936 average AGI)
Webster County: 1.80% Kentucky average: 2.73%
Top counties to which taxpayers relocated from this county between 2020 and 2021:
| to Hopkins County, KY | |
| to Henderson County, KY | |
| to Union County, KY |
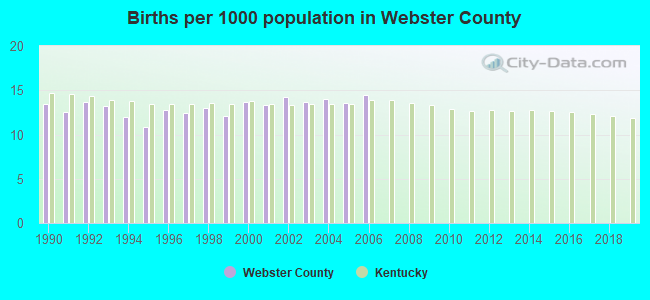
Births per 1000 population from 1990 to 1999: 12.6
Births per 1000 population from 2000 to 2006: 13.9
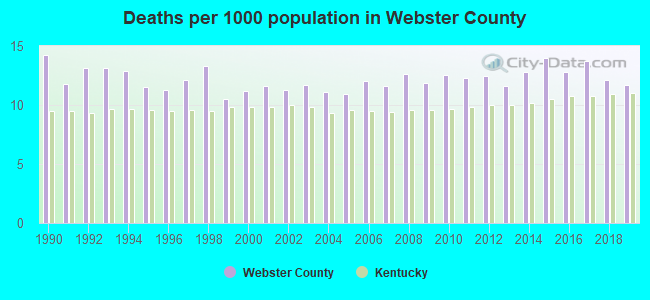
Deaths per 1000 population from 1990 to 1999: 12.4
Deaths per 1000 population from 2000 to 2009: 11.6
Deaths per 1000 population from 2010 to 2020: 12.9
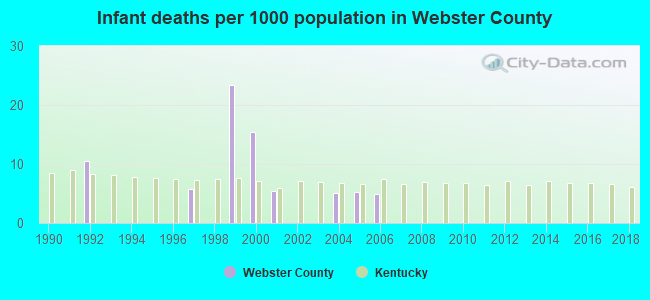
Infant deaths per 1000 live births from 1990 to 1999: 4.0
Infant deaths per 1000 live births from 2000 to 2006: 5.2
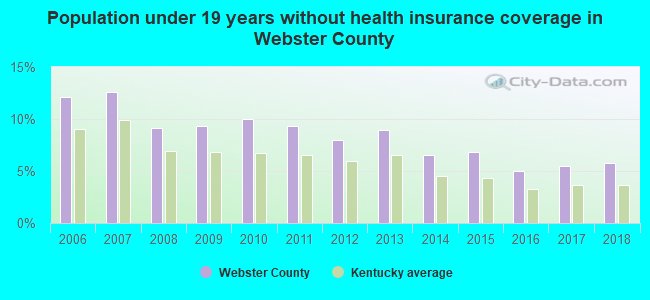
Persons under 19 years old without health insurance coverage in 2018: 5.8%

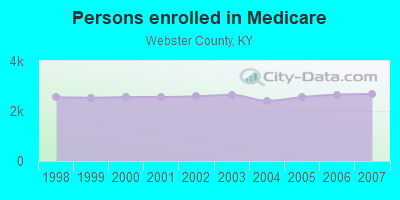
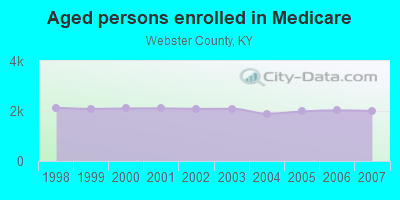
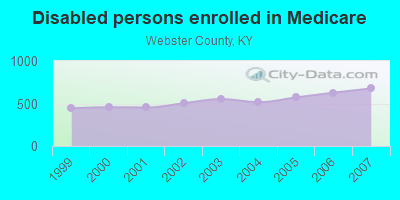
Persons enrolled in hospital insurance and/or supplemental medical insurance (Medicare) in July 1, 2007: 2,678 (2,001 aged, 677 disabled)
Children under 18 without health insurance coverage in 2007: 351 (11%)
Most common underlying causes of death in Webster County, Kentucky in 1999 - 2019:
- Bronchus or lung, unspecified - Malignant neoplasms (209)
- Acute myocardial infarction, unspecified (197)
- Chronic obstructive pulmonary disease, unspecified (159)
- Atherosclerotic heart disease (22)
- Unspecified dementia (12)
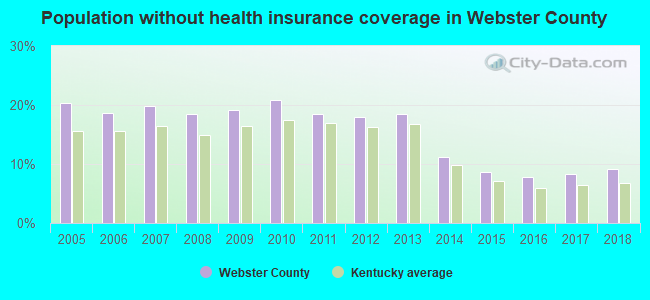
Population without health insurance coverage in 2000: 14%
Children under 18 without health insurance coverage in 2000: 11%
Medical specialist MDs per 100,000 population in 2005: 1,137
Dentists per 100,000 population in 1998: 7
Total births per 100,000 population, July 2005 - July 2006 : 30
Total deaths per 100,000 population, July 2005 - July 2006: 49
Household type by relationship:
Households: 12,977- Male householders: 2,628 (649 living alone), Female householders: 2,335 (598 living alone)
2,484 spouses (2,450 opposite-sex spouses), 392 unmarried partners, (392 opposite-sex unmarried partners), 3,370 children (3,161 natural, 86 adopted, 125 stepchildren), 462 grandchildren, 251 brothers or sisters, 39 parents, 23 foster children, 254 other relatives, 281 non-relatives
- In group quarters: 401
Size of family households: 1,753 2-persons, 880 3-persons, 405 4-persons, 246 5-persons, 183 6-persons, 57 7-or-more-persons.
Size of nonfamily households: 1,248 1-person, 187 2-persons, 18 3-persons.
1,376 married couples with children.
958 single-parent households (357 men, 601 women).
94.9% of residents of Webster speak English at home.
4.0% of residents speak Spanish at home (48% speak English very well, 13% speak English well, 11% speak English not well, 28% don't speak English at all).
0.9% of residents speak other Indo-European language at home (76% speak English very well, 24% speak English well).
0.2% of residents speak Asian or Pacific Island language at home (33% speak English very well, 67% speak English well).
In fiscal year 2004:
Federal Government expenditure: $84,487,000 ($5,979 per capita)
Department of Defense expenditure: $950,000
Federal direct payments to individuals for retirement and disability: $39,822,000
Federal other direct payments to individuals: $17,466,000
Federal direct payments not to individuals: $4,111,000
Federal grants: $14,435,000
Federal procurement contracts: $6,080,000 ($0,000 Department of Defense)
Federal salaries and wages: $2,574,000 ($0,000 Department of Defense)
Federal Government direct loans: $131,000
Federal guaranteed/insured loans: $1,419,000
Federal Government insurance: $8,602,000
Population change from April 1, 2000 to July 1, 2005:
Births: 1,018| Here: | 72 per 1000 residents |
| State: | 69 per 1000 residents |
Deaths: 839
| Here: | 59 per 1000 residents |
| State: | 50 per 1000 residents |
Net international migration: +119
| Here: | +8 per 1000 residents |
| State: | +7 per 1000 residents |
Net internal migration: -235
| Here: | |
| State: |
Total withdrawal of fresh water for public supply: 5.62 millions of gallons per day (16% from ground, 84% from surface)
| Here: | 6.3 |
| State: | 6.4 |
| Here: | 4.9 |
| State: | 4.4 |
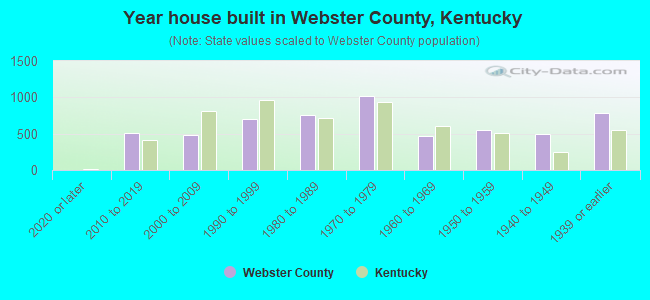
- Year house built in Webster County, Kentucky
- 02020 or later
- 5602010 to 2019
- 6002000 to 2009
- 7531990 to 1999
- 6731980 to 1989
- 9091970 to 1979
- 4451960 to 1969
- 5721950 to 1959
- 4641940 to 1949
- 7021939 or earlier
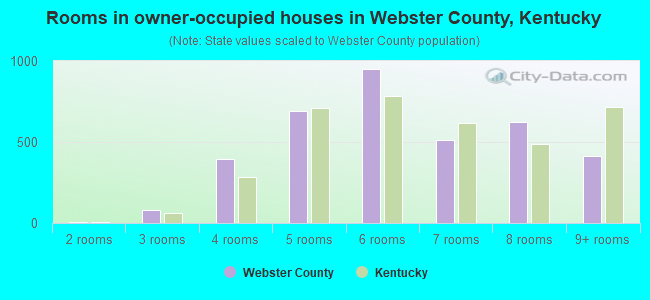
- Rooms in owner-occupied houses in Webster County, Kentucky
- 01 room
- 52 rooms
- 683 rooms
- 3564 rooms
- 6435 rooms
- 9496 rooms
- 6317 rooms
- 5198 rooms
- 4369+ rooms
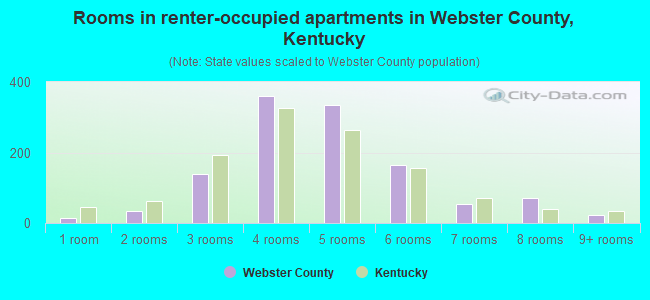
- Rooms in renter-occupied apartments in Webster County, Kentucky
- 181 room
- 352 rooms
- 1193 rooms
- 3524 rooms
- 3915 rooms
- 2616 rooms
- 517 rooms
- 1288 rooms
- 179+ rooms
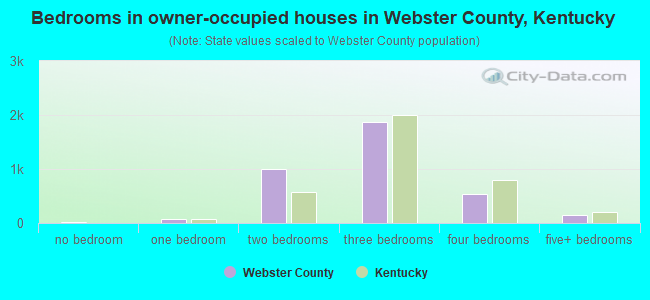
- Bedrooms in owner-occupied houses in Webster County, Kentucky
- 26no bedroom
- 631 bedroom
- 9172 bedrooms
- 2,0333 bedrooms
- 4444 bedrooms
- 1265+ bedrooms
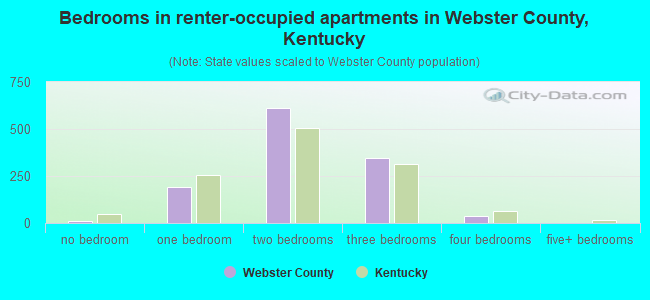
- Bedrooms in renter-occupied apartments in Webster County, Kentucky
- 19no bedroom
- 1731 bedroom
- 6072 bedrooms
- 4773 bedrooms
- 894 bedrooms
- 05+ bedrooms
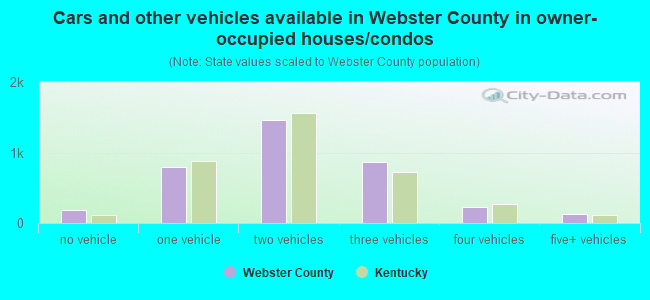
- Cars and other vehicles available in Webster County in owner-occupied houses/condos
- 130no vehicle
- 7191 vehicle
- 1,4592 vehicles
- 9133 vehicles
- 2384 vehicles
- 1325+ vehicles
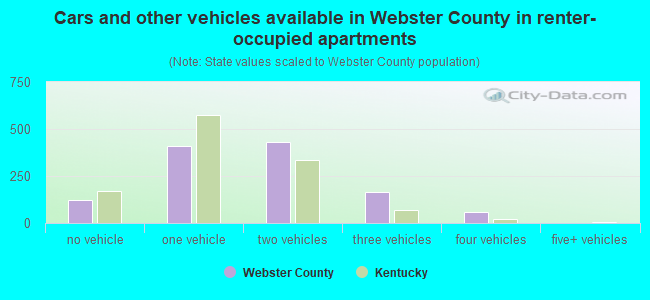
- Cars and other vehicles available in Webster County in renter-occupied apartments
- 122no vehicle
- 4351 vehicle
- 4382 vehicles
- 3073 vehicles
- 654 vehicles
- 25+ vehicles
89.5% of Webster County residents lived in the same house 1 years ago.
Out of people who lived in different houses, 26% lived in this county.
Out of people who lived in different counties, 80% lived in Kentucky.
| Webster County: | 89.5% |
| State average: | 87.2% |
Place of birth for U.S.-born residents:
- This state: 9,104
- Other state: 3,479
- Northeast: 277
- Midwest: 1,998
- South: 985
- West: 200
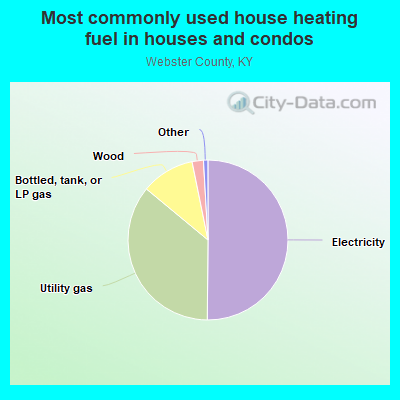
- 49.6%Electricity
- 35.6%Utility gas
- 10.5%Bottled, tank, or LP gas
- 3.4%Wood
- 0.4%Fuel oil, kerosene, etc.
- 0.3%Other fuel
- 0.2%No fuel used
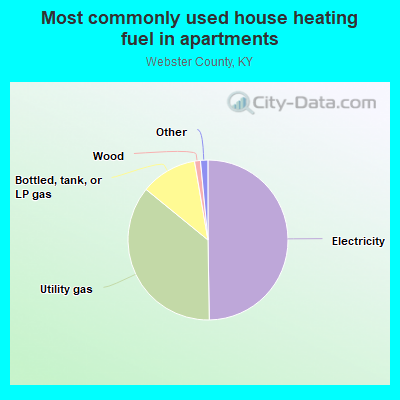
- 49.1%Electricity
- 34.9%Utility gas
- 13.8%Bottled, tank, or LP gas
- 1.0%Wood
- 0.7%No fuel used
- 0.4%Fuel oil, kerosene, etc.
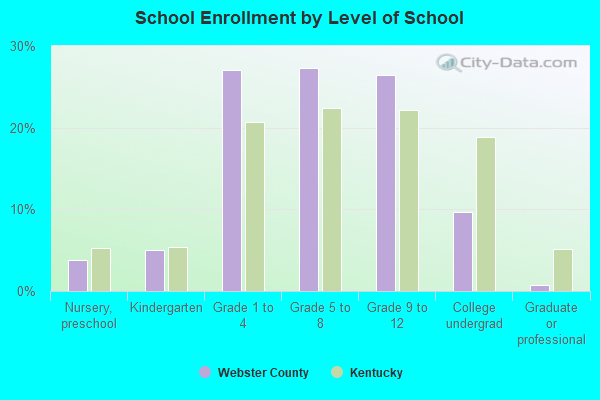
Private vs. public school enrollment:
| Here: | 9.4% |
| Kentucky: | 17.2% |
| Here: | 4.2% |
| Kentucky: | 15.2% |
| Here: | 8.5% |
| Kentucky: | 19.6% |

Webster County government finances - Expenditure in 2018:
- Bond Funds - Cash and Securities: $209,000
- Charges - Other: $227,000
Solid Waste Management: $58,000
Regular Highways: $12,000
- Construction - Solid Waste Management: $7,000
General - Other: $1,000
Correctional Institutions: $1,000
- Current Operations - Correctional Institutions: $2,187,000
General - Other: $1,805,000
Regular Highways: $1,405,000
Central Staff Services: $770,000
Police Protection: $750,000
Solid Waste Management: $518,000
Public Welfare - Other: $273,000
General Public Buildings: $226,000
Health - Other: $224,000
Sewerage: $205,000
Judicial and Legal Services: $141,000
Natural Resources - Other: $111,000
Financial Administration: $94,000
Local Fire Protection: $23,000
Water Utilities: $19,000
Parks and Recreation: $6,000
Air Transportation: $1,000
- Federal Intergovernmental - Other: $104,000
Health and Hospitals: $3,000
- General - Interest on Debt: $173,000
- Local Intergovernmental - Other: $106,000
- Long Term Debt - Beginning Outstanding - Unspecified Public Purpose: $44,460,000
Outstanding Unspecified Public Purpose: $44,250,000
Outstanding Nonguaranteed - Industrial Revenue: $42,735,000
Beginning Outstanding - Public Debt for Private Purpose: $42,735,000
Retired Unspecified Public Purpose: $210,000
- Miscellaneous - General Revenue - Other: $445,000
Donations From Private Sources: $103,000
Sale of Property: $39,000
Interest Earnings: $10,000
Rents: $3,000
- Other Capital Outlay - Correctional Institutions: $219,000
Protective Inspection and Regulation - Other: $75,000
Health - Other: $53,000
Solid Waste Management: $50,000
Police Protection: $33,000
General - Other: $2,000
- Other Funds - Cash and Securities: $1,520,000
- Sinking Funds - Cash and Securities: $42,735,000
- State Intergovernmental - Other: $5,498,000
Highways: $1,156,000
General Local Government Support: $6,000
- Tax - Property: $1,128,000
Public Utilities Sales: $238,000
Corporation License: $55,000
Documentary and Stock Transfer: $26,000
Other License: $3,000
- Total Salaries and Wages: $3,635,000
Webster County government finances - Revenue in 2018:
- Bond Funds - Cash and Securities: $209,000
- Charges - Other: $227,000
Solid Waste Management: $58,000
Regular Highways: $12,000
- Construction - Solid Waste Management: $7,000
General - Other: $1,000
Correctional Institutions: $1,000
- Current Operations - Correctional Institutions: $2,187,000
General - Other: $1,805,000
Regular Highways: $1,405,000
Central Staff Services: $770,000
Police Protection: $750,000
Solid Waste Management: $518,000
Public Welfare - Other: $273,000
General Public Buildings: $226,000
Health - Other: $224,000
Sewerage: $205,000
Judicial and Legal Services: $141,000
Natural Resources - Other: $111,000
Financial Administration: $94,000
Local Fire Protection: $23,000
Water Utilities: $19,000
Parks and Recreation: $6,000
Air Transportation: $1,000
- Federal Intergovernmental - Other: $104,000
Health and Hospitals: $3,000
- General - Interest on Debt: $173,000
- Local Intergovernmental - Other: $106,000
- Long Term Debt - Beginning Outstanding - Unspecified Public Purpose: $44,460,000
Outstanding Unspecified Public Purpose: $44,250,000
Outstanding Nonguaranteed - Industrial Revenue: $42,735,000
Beginning Outstanding - Public Debt for Private Purpose: $42,735,000
Retired Unspecified Public Purpose: $210,000
- Miscellaneous - General Revenue - Other: $445,000
Donations From Private Sources: $103,000
Sale of Property: $39,000
Interest Earnings: $10,000
Rents: $3,000
- Other Capital Outlay - Correctional Institutions: $219,000
Protective Inspection and Regulation - Other: $75,000
Health - Other: $53,000
Solid Waste Management: $50,000
Police Protection: $33,000
General - Other: $2,000
- Other Funds - Cash and Securities: $1,520,000
- Sinking Funds - Cash and Securities: $42,735,000
- State Intergovernmental - Other: $5,498,000
Highways: $1,156,000
General Local Government Support: $6,000
- Tax - Property: $1,128,000
Public Utilities Sales: $238,000
Corporation License: $55,000
Documentary and Stock Transfer: $26,000
Other License: $3,000
- Total Salaries and Wages: $3,635,000
Webster County government finances - Debt in 2018:
- Bond Funds - Cash and Securities: $209,000
- Charges - Other: $227,000
Solid Waste Management: $58,000
Regular Highways: $12,000
- Construction - Solid Waste Management: $7,000
General - Other: $1,000
Correctional Institutions: $1,000
- Current Operations - Correctional Institutions: $2,187,000
General - Other: $1,805,000
Regular Highways: $1,405,000
Central Staff Services: $770,000
Police Protection: $750,000
Solid Waste Management: $518,000
Public Welfare - Other: $273,000
General Public Buildings: $226,000
Health - Other: $224,000
Sewerage: $205,000
Judicial and Legal Services: $141,000
Natural Resources - Other: $111,000
Financial Administration: $94,000
Local Fire Protection: $23,000
Water Utilities: $19,000
Parks and Recreation: $6,000
Air Transportation: $1,000
- Federal Intergovernmental - Other: $104,000
Health and Hospitals: $3,000
- General - Interest on Debt: $173,000
- Local Intergovernmental - Other: $106,000
- Long Term Debt - Beginning Outstanding - Unspecified Public Purpose: $44,460,000
Outstanding Unspecified Public Purpose: $44,250,000
Outstanding Nonguaranteed - Industrial Revenue: $42,735,000
Beginning Outstanding - Public Debt for Private Purpose: $42,735,000
Retired Unspecified Public Purpose: $210,000
- Miscellaneous - General Revenue - Other: $445,000
Donations From Private Sources: $103,000
Sale of Property: $39,000
Interest Earnings: $10,000
Rents: $3,000
- Other Capital Outlay - Correctional Institutions: $219,000
Protective Inspection and Regulation - Other: $75,000
Health - Other: $53,000
Solid Waste Management: $50,000
Police Protection: $33,000
General - Other: $2,000
- Other Funds - Cash and Securities: $1,520,000
- Sinking Funds - Cash and Securities: $42,735,000
- State Intergovernmental - Other: $5,498,000
Highways: $1,156,000
General Local Government Support: $6,000
- Tax - Property: $1,128,000
Public Utilities Sales: $238,000
Corporation License: $55,000
Documentary and Stock Transfer: $26,000
Other License: $3,000
- Total Salaries and Wages: $3,635,000
Webster County government finances - Cash and Securities in 2018:
- Bond Funds - Cash and Securities: $209,000
- Charges - Other: $227,000
Solid Waste Management: $58,000
Regular Highways: $12,000
- Construction - Solid Waste Management: $7,000
General - Other: $1,000
Correctional Institutions: $1,000
- Current Operations - Correctional Institutions: $2,187,000
General - Other: $1,805,000
Regular Highways: $1,405,000
Central Staff Services: $770,000
Police Protection: $750,000
Solid Waste Management: $518,000
Public Welfare - Other: $273,000
General Public Buildings: $226,000
Health - Other: $224,000
Sewerage: $205,000
Judicial and Legal Services: $141,000
Natural Resources - Other: $111,000
Financial Administration: $94,000
Local Fire Protection: $23,000
Water Utilities: $19,000
Parks and Recreation: $6,000
Air Transportation: $1,000
- Federal Intergovernmental - Other: $104,000
Health and Hospitals: $3,000
- General - Interest on Debt: $173,000
- Local Intergovernmental - Other: $106,000
- Long Term Debt - Beginning Outstanding - Unspecified Public Purpose: $44,460,000
Outstanding Unspecified Public Purpose: $44,250,000
Outstanding Nonguaranteed - Industrial Revenue: $42,735,000
Beginning Outstanding - Public Debt for Private Purpose: $42,735,000
Retired Unspecified Public Purpose: $210,000
- Miscellaneous - General Revenue - Other: $445,000
Donations From Private Sources: $103,000
Sale of Property: $39,000
Interest Earnings: $10,000
Rents: $3,000
- Other Capital Outlay - Correctional Institutions: $219,000
Protective Inspection and Regulation - Other: $75,000
Health - Other: $53,000
Solid Waste Management: $50,000
Police Protection: $33,000
General - Other: $2,000
- Other Funds - Cash and Securities: $1,520,000
- Sinking Funds - Cash and Securities: $42,735,000
- State Intergovernmental - Other: $5,498,000
Highways: $1,156,000
General Local Government Support: $6,000
- Tax - Property: $1,128,000
Public Utilities Sales: $238,000
Corporation License: $55,000
Documentary and Stock Transfer: $26,000
Other License: $3,000
- Total Salaries and Wages: $3,635,000
Supplemental Security Income (SSI) in 2006:
- Total number of recipients: 519
- Number of aged recipients: 36
- Number of blind and disabled recipients: 483
- Number of recipients under 18: 110
- Number of recipients between 18 and 64: 330
- Number of recipients older than 64: 79
- Number of recipients also receiving OASDI: 191
- Amount of payments (thousands of dollars): 222
| Most common first names in Webster County, KY among deceased individuals | ||
| Name | Count | Lived (average) |
|---|---|---|
| James | 241 | 72.9 years |
| William | 158 | 74.2 years |
| Mary | 151 | 78.5 years |
| John | 126 | 74.8 years |
| George | 92 | 77.0 years |
| Charles | 71 | 71.7 years |
| Thomas | 68 | 72.6 years |
| Robert | 66 | 71.9 years |
| Ruby | 60 | 81.0 years |
| Ruth | 49 | 79.0 years |
| Most common last names in Webster County, KY among deceased individuals | ||
| Last name | Count | Lived (average) |
|---|---|---|
| Brown | 104 | 79.1 years |
| Johnson | 60 | 77.5 years |
| Williams | 56 | 76.2 years |
| Melton | 55 | 78.3 years |
| Gibson | 54 | 78.7 years |
| Vaughn | 51 | 75.3 years |
| Jones | 51 | 76.7 years |
| Hill | 51 | 73.7 years |
| Brooks | 49 | 78.1 years |
| Wilson | 44 | 78.7 years |
| Businesses in Webster County, KY | ||||
| Name | Count | Name | Count | |
|---|---|---|---|---|
| CVS | 1 | McDonald's | 1 | |
| H&R Block | 2 | Subway | 2 | |