Crime rate in Greensboro, North Carolina (NC): murders, rapes, robberies, assaults, burglaries, thefts, auto thefts, arson, law enforcement employees, police officers, crime map
Crime rate in Greensboro, NC
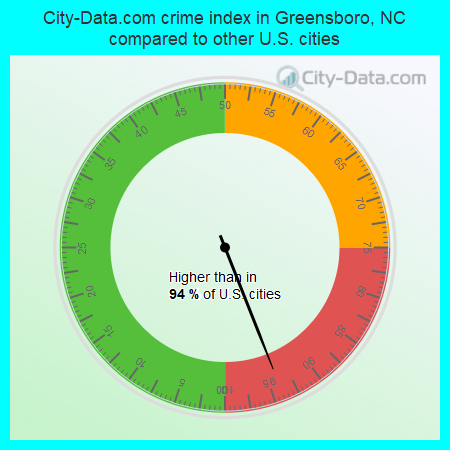
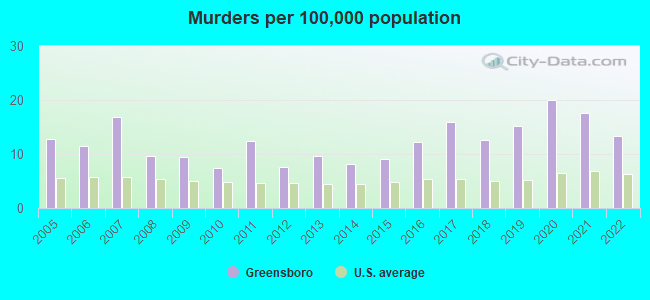
The 2022 crime rate in Greensboro, NC is 404 (City-Data.com crime index), which is 1.6 times higher than the U.S. average. It was higher than in 94.0% U.S. cities. The 2022 Greensboro crime rate fell by 3% compared to 2021. The number of homicides stood at 40 - a decrease of 13 compared to 2021. In the last 5 years Greensboro has seen increasing violent crime and rise of property crime.See how dangerous Greensboro, NC is compared to the nearest cities:
(Note: Higher means more crime)
(Note: Higher means more crime)
| Greensboro: | 404.0 |
| High Point: | 287.6 |
| Archdale: | 126.2 |
| Kernersville: | 236.3 |
| Gibsonville: | 124.0 |
| Elon: | 57.9 |
| Randleman: | 181.8 |
| Thomasville: | 145.7 |
| Reidsville: | 432.5 |
The City-Data.com crime index weighs serious crimes and violent crimes more heavily. Higher means more crime, U.S. average is 246.1. It adjusts for the number of visitors and daily workers commuting into cities.
- means the value is smaller than the state average.- means the value is about the same as the state average.
- means the value is bigger than the state average.
- means the value is much bigger than the state average.
According to our research of North Carolina and other state lists, there were 609 registered sex offenders living in Greensboro, North Carolina as of April 27, 2024.
The ratio of all residents to sex offenders in Greensboro is 471 to 1.
The ratio of registered sex offenders to all residents in this city is near the state average.
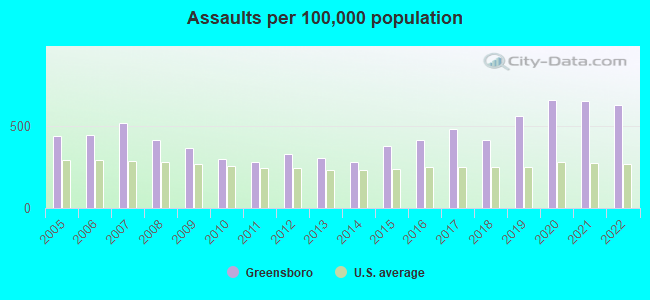
Violent crime rate in 2022
| Greensboro: | 442.9 |
| U.S. Average: | 219.8 |
Violent crime rate in 2021
| Greensboro: | 476.8 |
| U.S. Average: | 224.8 |
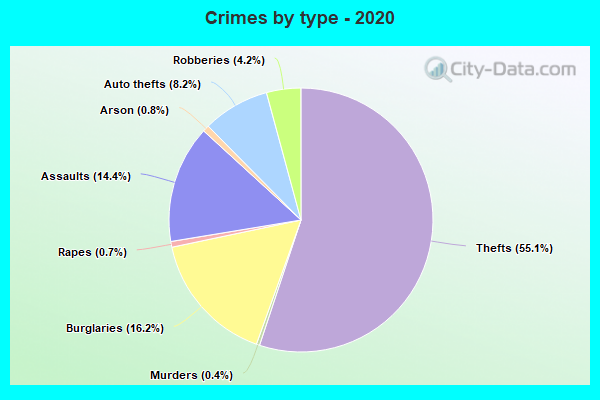
Violent crime rate in 2020
| Greensboro: | 499.0 |
| U.S. Average: | 228.2 |
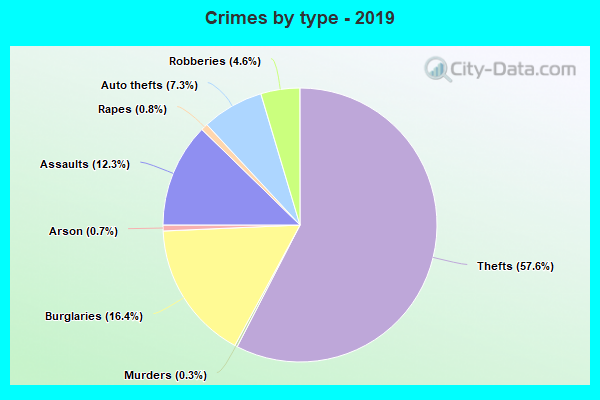
Violent crime rate in 2019
| Greensboro: | 453.7 |
| U.S. Average: | 219.9 |
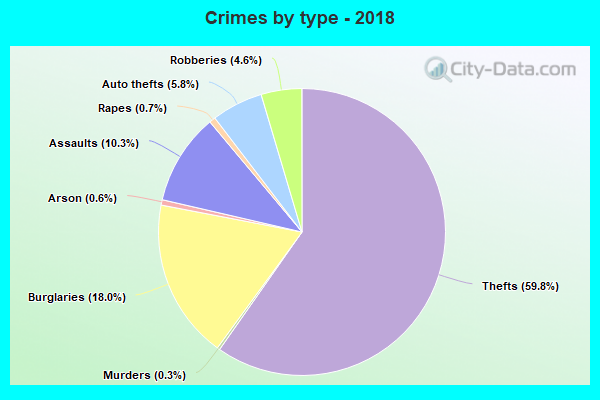
Violent crime rate in 2018
| Greensboro: | 349.6 |
| U.S. Average: | 221.2 |
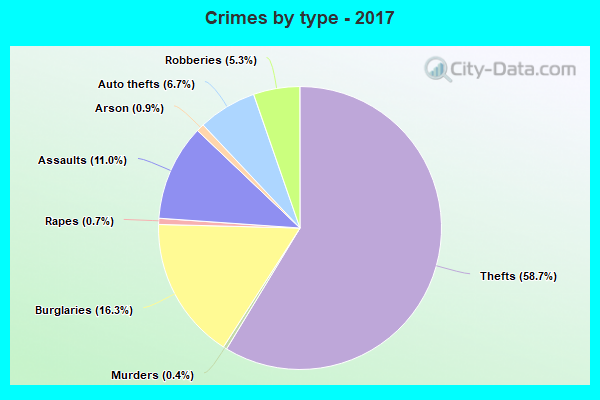
Violent crime rate in 2017
| Greensboro: | 416.8 |
| U.S. Average: | 226.2 |
Violent crime rate in 2016
| Greensboro: | 354.1 |
| U.S. Average: | 227.3 |
Violent crime rate in 2015
| Greensboro: | 324.7 |
| U.S. Average: | 219.3 |
Violent crime rate in 2014
| Greensboro: | 259.9 |
| U.S. Average: | 211.1 |
Violent crime rate in 2013
| Greensboro: | 286.4 |
| U.S. Average: | 214.2 |
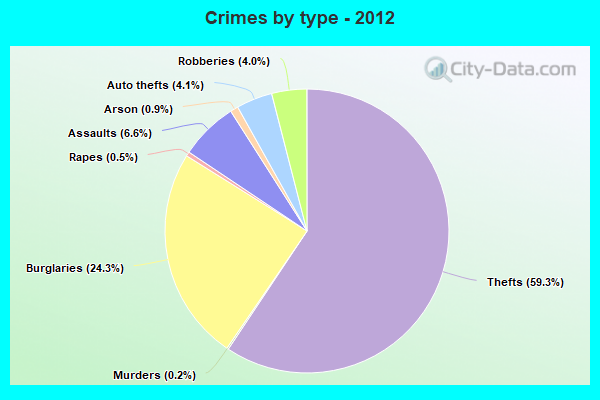
Violent crime rate in 2012
| Greensboro: | 305.6 |
| U.S. Average: | 187.4 |
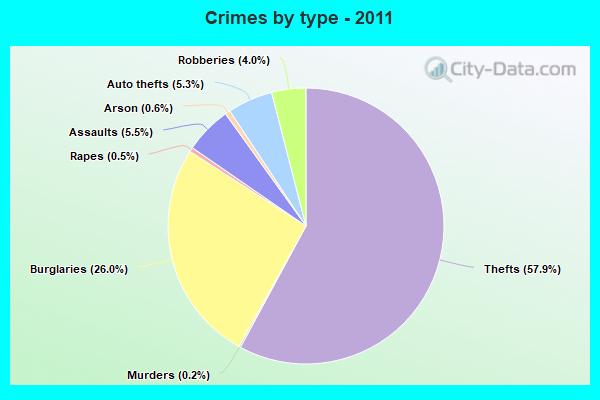
Violent crime rate in 2011
| Greensboro: | 293.1 |
| U.S. Average: | 187.1 |
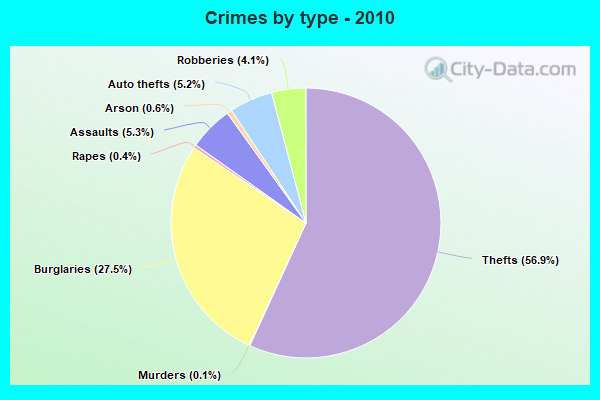
Violent crime rate in 2010
| Greensboro: | 301.9 |
| U.S. Average: | 195.7 |
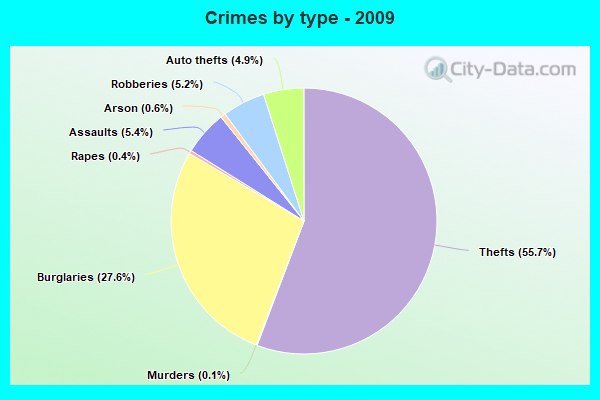
Violent crime rate in 2009
| Greensboro: | 412.3 |
| U.S. Average: | 208.9 |
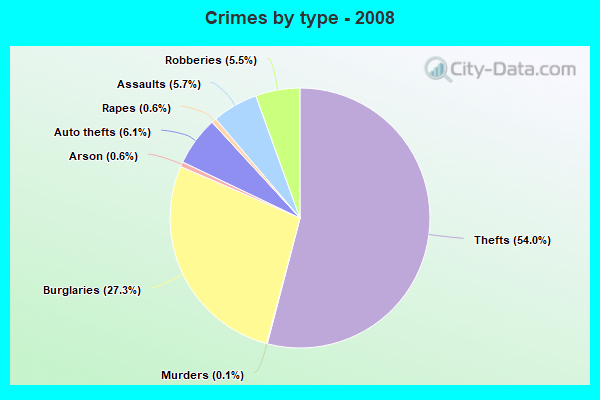
Violent crime rate in 2008
| Greensboro: | 468.4 |
| U.S. Average: | 222.5 |
Violent crime rate in 2007
| Greensboro: | 433.7 |
| U.S. Average: | 229.1 |
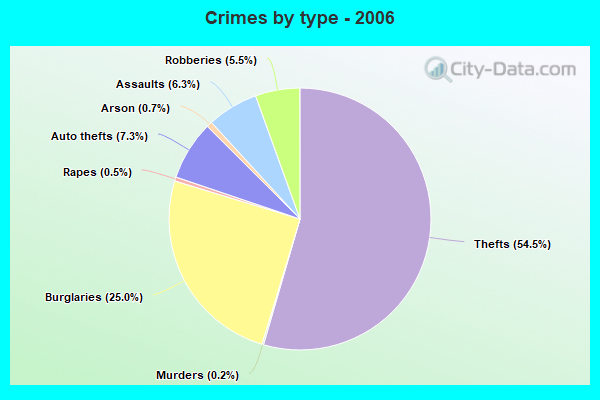
Violent crime rate in 2006
| Greensboro: | 385.1 |
| U.S. Average: | 232.6 |
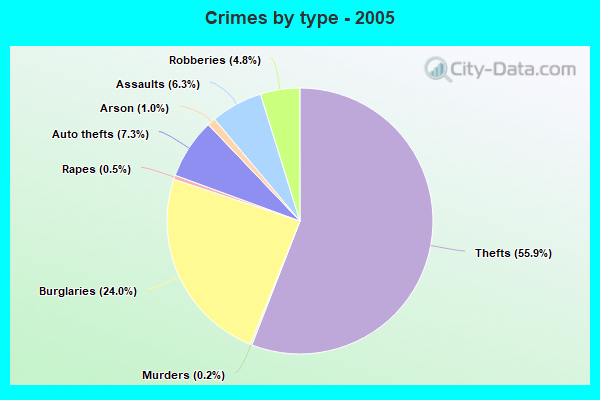
Violent crime rate in 2005
| Greensboro: | 367.5 |
| U.S. Average: | 227.0 |
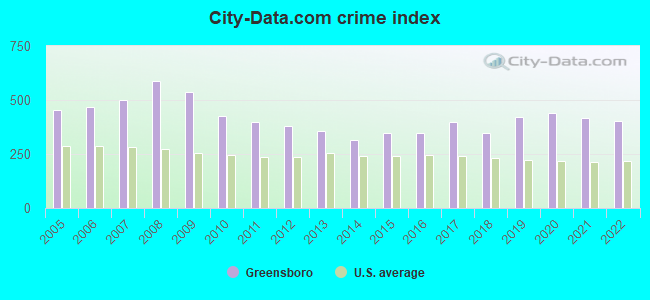
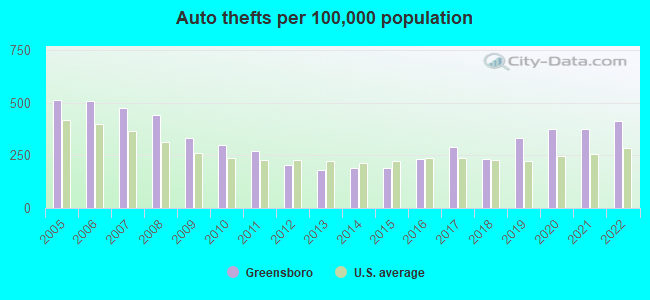
Property crime rate in 2022
| Greensboro: | 313.9 |
| U.S. Average: | 166.5 |
Property crime rate in 2021
| Greensboro: | 311.1 |
| U.S. Average: | 157.8 |
Property crime rate in 2020
| Greensboro: | 329.8 |
| U.S. Average: | 169.6 |
Property crime rate in 2019
| Greensboro: | 330.0 |
| U.S. Average: | 179.7 |
Property crime rate in 2018
| Greensboro: | 299.0 |
| U.S. Average: | 190.2 |
Property crime rate in 2017
| Greensboro: | 313.9 |
| U.S. Average: | 206.4 |
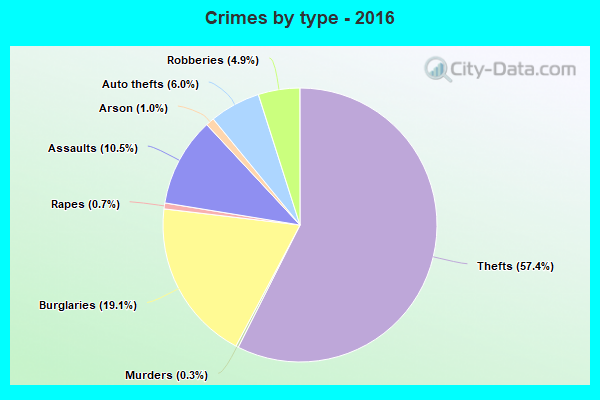
Property crime rate in 2016
| Greensboro: | 295.7 |
| U.S. Average: | 216.6 |
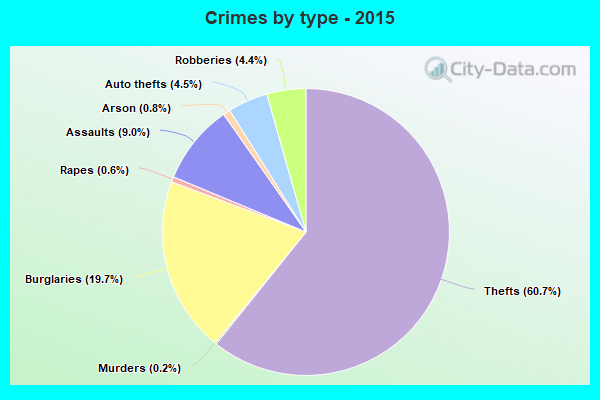
Property crime rate in 2015
| Greensboro: | 321.5 |
| U.S. Average: | 221.5 |
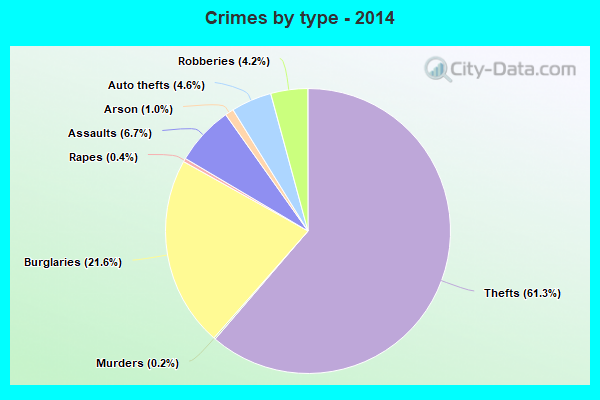
Property crime rate in 2014
| Greensboro: | 332.2 |
| U.S. Average: | 230.8 |
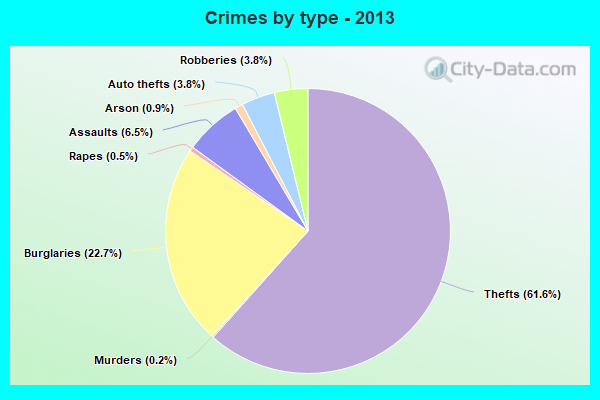
Property crime rate in 2013
| Greensboro: | 384.1 |
| U.S. Average: | 250.4 |
Property crime rate in 2012
| Greensboro: | 420.6 |
| U.S. Average: | 267.3 |
Property crime rate in 2011
| Greensboro: | 453.2 |
| U.S. Average: | 273.5 |
Property crime rate in 2010
| Greensboro: | 519.9 |
| U.S. Average: | 276.4 |
Property crime rate in 2009
| Greensboro: | 619.3 |
| U.S. Average: | 285.6 |
Property crime rate in 2008
| Greensboro: | 658.2 |
| U.S. Average: | 302.2 |
Property crime rate in 2007
| Greensboro: | 534.8 |
| U.S. Average: | 309.2 |
Property crime rate in 2006
| Greensboro: | 503.5 |
| U.S. Average: | 317.3 |
Property crime rate in 2005
| Greensboro: | 497.4 |
| U.S. Average: | 322.3 |
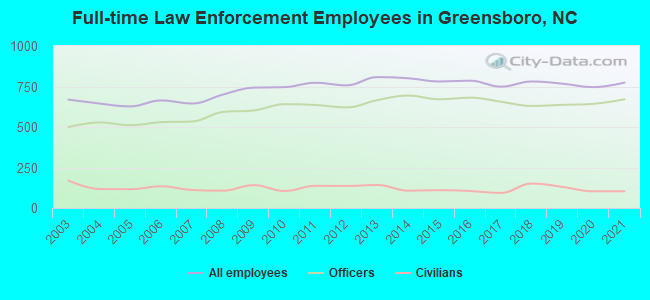
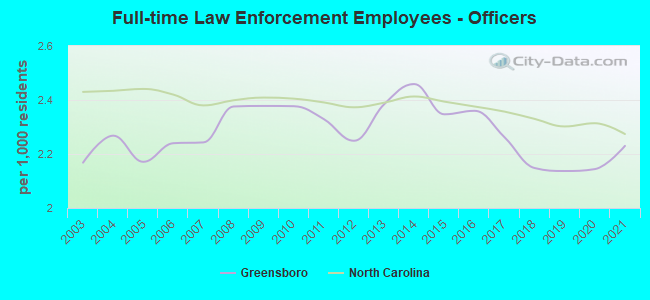
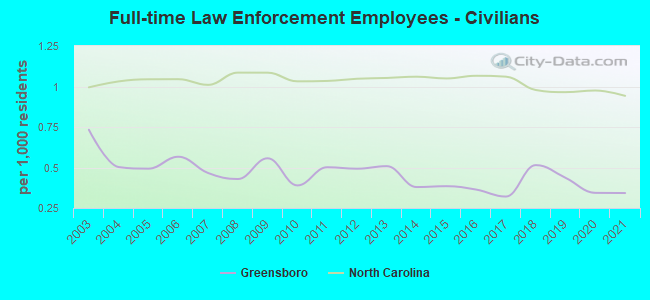
Full-time law enforcement employees in 2021, including police officers: 774 (671 officers - 538 male; 133 female).
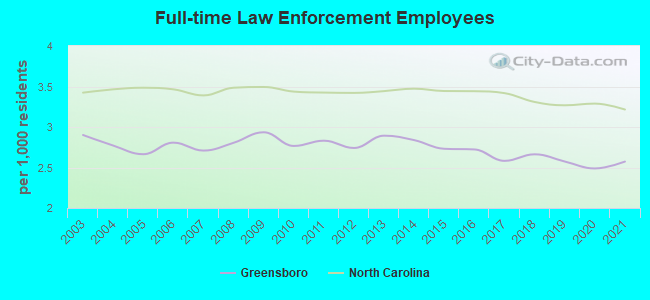
| Officers per 1,000 residents here: | 2.23 |
| North Carolina average: | 2.27 |
Full-time law enforcement employees in 2020, including police officers: 746 (643 officers - 538 male; 105 female).
| Officers per 1,000 residents here: | 2.14 |
| North Carolina average: | 2.31 |
Full-time law enforcement employees in 2019, including police officers: 767 (637 officers - 533 male; 104 female).
| Officers per 1,000 residents here: | 2.14 |
| North Carolina average: | 2.30 |
Full-time law enforcement employees in 2018, including police officers: 781 (630 officers - 542 male; 88 female).
| Officers per 1,000 residents here: | 2.15 |
| North Carolina average: | 2.33 |
Full-time law enforcement employees in 2017, including police officers: 749 (656 officers - 565 male; 91 female).
| Officers per 1,000 residents here: | 2.26 |
| North Carolina average: | 2.36 |
Full-time law enforcement employees in 2016, including police officers: 786 (681 officers - 590 male; 91 female).
| Officers per 1,000 residents here: | 2.36 |
| North Carolina average: | 2.38 |
Full-time law enforcement employees in 2015, including police officers: 781 (671 officers - 582 male; 89 female).
| Officers per 1,000 residents here: | 2.35 |
| North Carolina average: | 2.39 |
Full-time law enforcement employees in 2014, including police officers: 801 (694 officers - 591 male; 103 female).
| Officers per 1,000 residents here: | 2.46 |
| North Carolina average: | 2.41 |
Full-time law enforcement employees in 2013, including police officers: 808 (666 officers - 566 male; 100 female).
| Officers per 1,000 residents here: | 2.38 |
| North Carolina average: | 2.39 |
Full-time law enforcement employees in 2012, including police officers: 757 (621 officers - 531 male; 90 female).
| Officers per 1,000 residents here: | 2.25 |
| North Carolina average: | 2.37 |
Full-time law enforcement employees in 2011, including police officers: 773 (636 officers - 550 male; 86 female).
| Officers per 1,000 residents here: | 2.33 |
| North Carolina average: | 2.39 |
Full-time law enforcement employees in 2010, including police officers: 746 (641 officers - 554 male; 87 female).
| Officers per 1,000 residents here: | 2.38 |
| North Carolina average: | 2.40 |
Full-time law enforcement employees in 2009, including police officers: 743 (602 officers - 524 male; 78 female).
| Officers per 1,000 residents here: | 2.38 |
| North Carolina average: | 2.41 |
Full-time law enforcement employees in 2008, including police officers: 700 (593 officers - 511 male; 82 female).
| Officers per 1,000 residents here: | 2.38 |
| North Carolina average: | 2.40 |
Full-time law enforcement employees in 2007, including police officers: 645 (534 officers - 458 male; 76 female).
| Officers per 1,000 residents here: | 2.24 |
| North Carolina average: | 2.38 |
Full-time law enforcement employees in 2006, including police officers: 664 (530 officers - 455 male; 75 female).
| Officers per 1,000 residents here: | 2.24 |
| North Carolina average: | 2.42 |
Full-time law enforcement employees in 2005, including police officers: 627 (511 officers - 439 male; 72 female).
| Officers per 1,000 residents here: | 2.17 |
| North Carolina average: | 2.44 |
Full-time law enforcement employees in 2004, including police officers: 645 (528 officers - 455 male; 73 female).
| Officers per 1,000 residents here: | 2.27 |
| North Carolina average: | 2.43 |
Full-time law enforcement employees in 2003, including police officers: 669 (500 officers - 427 male; 73 female).
| Officers per 1,000 residents here: | 2.17 |
| North Carolina average: | 2.43 |

Zip codes: 27214, 27235, 27282, 27301, 27313, 27358, 27401, 27403, 27405, 27407, 27408, 27409, 27410, 27455.