Crime rate in Darby Township, Pennsylvania (PA): murders, rapes, robberies, assaults, burglaries, thefts, auto thefts, arson, law enforcement employees, police officers, crime map

Crime rate in Darby Township, PA
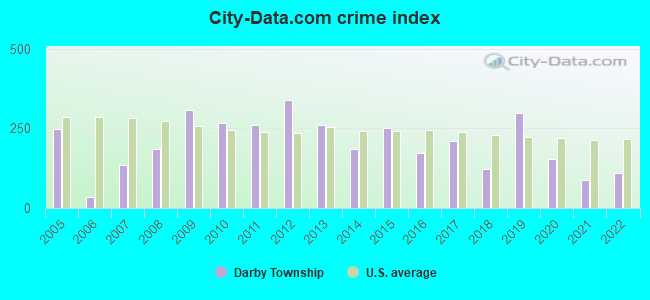
The 2022 crime rate in Darby Township, PA is 109 (City-Data.com crime index), which is 2.3 times lower than the U.S. average. It was higher than in 53.2% U.S. cities. The 2022 Darby Township crime rate rose by 23% compared to 2021. In the last 5 years Darby Township has seen increasing violent crime and decline of property crime.See how dangerous Darby Township, PA is compared to the nearest cities:
(Note: Higher means more crime)
(Note: Higher means more crime)
| Darby Township: | 109.1 |
| Glenolden: | 66.6 |
| Collingdale: | 93.8 |
| Aldan: | 22.7 |
| Sharon Hill: | 61.1 |
| Folcroft: | 148.8 |
| Norwood: | 42.4 |
| Clifton Heights: | 72.5 |
| Darby: | 120.6 |
The City-Data.com crime index weighs serious crimes and violent crimes more heavily. Higher means more crime, U.S. average is 246.1. It adjusts for the number of visitors and daily workers commuting into cities.
- means the value is smaller than the state average.- means the value is about the same as the state average.
- means the value is bigger than the state average.
- means the value is much bigger than the state average.
Violent crime rate in 2022
| Darby Township: | 170.6 |
| U.S. Average: | 219.8 |
Violent crime rate in 2021
| Darby Township: | 71.8 |
| U.S. Average: | 224.8 |
Violent crime rate in 2020
| Darby Township: | 253.2 |
| U.S. Average: | 228.2 |
Violent crime rate in 2019
| Darby Township: | 410.5 |
| U.S. Average: | 219.9 |
Violent crime rate in 2018
| Darby Township: | 118.5 |
| U.S. Average: | 221.2 |
Violent crime rate in 2017
| Darby Township: | 268.8 |
| U.S. Average: | 226.2 |
Violent crime rate in 2016
| Darby Township: | 209.0 |
| U.S. Average: | 227.3 |
Violent crime rate in 2015
| Darby Township: | 316.3 |
| U.S. Average: | 219.3 |
Violent crime rate in 2014
| Darby Township: | 134.3 |
| U.S. Average: | 211.1 |
Violent crime rate in 2013
| Darby Township: | 285.7 |
| U.S. Average: | 214.2 |
Violent crime rate in 2012
| Darby Township: | 500.8 |
| U.S. Average: | 187.4 |
Violent crime rate in 2011
| Darby Township: | 322.8 |
| U.S. Average: | 187.1 |
Violent crime rate in 2010
| Darby Township: | 205.1 |
| U.S. Average: | 195.7 |
Violent crime rate in 2009
| Darby Township: | 326.0 |
| U.S. Average: | 208.9 |
Violent crime rate in 2008
| Darby Township: | 167.8 |
| U.S. Average: | 222.5 |
Violent crime rate in 2007
| Darby Township: | 165.9 |
| U.S. Average: | 229.1 |
Violent crime rate in 2006
| Darby Township: | 47.9 |
| U.S. Average: | 232.6 |
Violent crime rate in 2005
| Darby Township: | 198.5 |
| U.S. Average: | 227.0 |
Property crime rate in 2022
| Darby Township: | 57.2 |
| U.S. Average: | 166.5 |
Property crime rate in 2021
| Darby Township: | 67.1 |
| U.S. Average: | 157.8 |
Property crime rate in 2020
| Darby Township: | 77.0 |
| U.S. Average: | 169.6 |
Property crime rate in 2019
| Darby Township: | 144.8 |
| U.S. Average: | 179.7 |
Property crime rate in 2018
| Darby Township: | 90.5 |
| U.S. Average: | 190.2 |
Property crime rate in 2017
| Darby Township: | 143.0 |
| U.S. Average: | 206.4 |
Property crime rate in 2016
| Darby Township: | 106.1 |
| U.S. Average: | 216.6 |
Property crime rate in 2015
| Darby Township: | 144.7 |
| U.S. Average: | 221.5 |
Property crime rate in 2014
| Darby Township: | 193.4 |
| U.S. Average: | 230.8 |
Property crime rate in 2013
| Darby Township: | 210.3 |
| U.S. Average: | 250.4 |
Property crime rate in 2012
| Darby Township: | 197.1 |
| U.S. Average: | 267.3 |
Property crime rate in 2011
| Darby Township: | 194.2 |
| U.S. Average: | 273.5 |
Property crime rate in 2010
| Darby Township: | 254.2 |
| U.S. Average: | 276.4 |
Property crime rate in 2009
| Darby Township: | 255.5 |
| U.S. Average: | 285.6 |
Property crime rate in 2008
| Darby Township: | 132.2 |
| U.S. Average: | 302.2 |
Property crime rate in 2007
| Darby Township: | 103.8 |
| U.S. Average: | 309.2 |
Property crime rate in 2006
| Darby Township: | 28.2 |
| U.S. Average: | 317.3 |
Property crime rate in 2005
| Darby Township: | 221.6 |
| U.S. Average: | 322.3 |


Full-time law enforcement employees in 2021, including police officers: 145 (133 officers - 124 male; 9 female).
| Officers per 1,000 residents here: | 1.60 |
| Pennsylvania average: | 2.55 |
Full-time law enforcement employees in 2020, including police officers: 128 (116 officers - 109 male; 7 female).
| Officers per 1,000 residents here: | 1.40 |
| Pennsylvania average: | 2.70 |
Full-time law enforcement employees in 2019, including police officers: 145 (126 officers - 120 male; 6 female).
| Officers per 1,000 residents here: | 1.52 |
| Pennsylvania average: | 2.71 |
Full-time law enforcement employees in 2018, including police officers: 145 (126 officers - 120 male; 6 female).
| Officers per 1,000 residents here: | 1.52 |
| Pennsylvania average: | 2.60 |
Full-time law enforcement employees in 2017, including police officers: 145 (126 officers - 120 male; 6 female).
| Officers per 1,000 residents here: | 1.53 |
| Pennsylvania average: | 2.64 |
Full-time law enforcement employees in 2016, including police officers: 145 (126 officers - 120 male; 6 female).
| Officers per 1,000 residents here: | 1.52 |
| Pennsylvania average: | 2.59 |
Full-time law enforcement employees in 2015, including police officers: 145 (126 officers - 120 male; 6 female).
| Officers per 1,000 residents here: | 1.52 |
| Pennsylvania average: | 2.04 |
Full-time law enforcement employees in 2014, including police officers: 145 (126 officers - 120 male; 6 female).
| Officers per 1,000 residents here: | 1.52 |
| Pennsylvania average: | 2.57 |
Full-time law enforcement employees in 2013, including police officers: 145 (126 officers - 120 male; 6 female).
| Officers per 1,000 residents here: | 1.52 |
| Pennsylvania average: | 2.58 |
Full-time law enforcement employees in 2012, including police officers: 145 (126 officers - 120 male; 6 female).
| Officers per 1,000 residents here: | 1.52 |
| Pennsylvania average: | 2.59 |
Full-time law enforcement employees in 2011, including police officers: 145 (126 officers - 120 male; 6 female).
| Officers per 1,000 residents here: | 1.52 |
| Pennsylvania average: | 2.12 |
Full-time law enforcement employees in 2010, including police officers: 145 (126 officers - 120 male; 6 female).
| Officers per 1,000 residents here: | 1.52 |
| Pennsylvania average: | 2.61 |
Full-time law enforcement employees in 2009, including police officers: 145 (126 officers - 120 male; 6 female).
| Officers per 1,000 residents here: | 1.61 |
| Pennsylvania average: | 2.63 |
Full-time law enforcement employees in 2008, including police officers: 145 (126 officers - 120 male; 6 female).
| Officers per 1,000 residents here: | 1.60 |
| Pennsylvania average: | 2.67 |
Full-time law enforcement employees in 2007, including police officers: 139 (126 officers - 120 male; 6 female).
| Officers per 1,000 residents here: | 1.59 |
| Pennsylvania average: | 2.76 |
Full-time law enforcement employees in 2006, including police officers: 134 (124 officers - 120 male; 4 female).
| Officers per 1,000 residents here: | 1.56 |
| Pennsylvania average: | 2.79 |
Full-time law enforcement employees in 2005, including police officers: 137 (127 officers - 124 male; 3 female).
| Officers per 1,000 residents here: | 1.59 |
| Pennsylvania average: | 2.79 |
Full-time law enforcement employees in 2004, including police officers: 135 (125 officers - 122 male; 3 female).
| Officers per 1,000 residents here: | 1.55 |
| Pennsylvania average: | 2.81 |
Full-time law enforcement employees in 2003, including police officers: 135 (125 officers - 122 male; 3 female).
| Officers per 1,000 residents here: | 1.54 |
| Pennsylvania average: | 2.85 |


Zip codes: 19036.